X-ray Emitting Groups in the Infall Region of Abell 2199
Abstract
Using a large redshift survey covering 95 square degrees, we demonstrate that the infall region of Abell 2199 contains Abell 2197, one or two X-ray emitting groups, and up to five additional groups identified in redshift surveys. Our survey shows that the X-ray emitting systems, located at projected radii of , and (2.2, 3.1, and ), are connected kinematically to A2199. A2197 is itself an optically rich cluster; its weak X-ray emission suggests that it is much less massive than A2199. The absence of a sharp peak in the infall pattern at the position of A2197 supports this hypothesis. The outermost group is well outside the virial region of A2199 and it distorts the infall pattern in redshift space. The two X-ray emitting groups are roughly colinear, suggesting the existence of an extended () filament. The identification of these infalling groups provides direct support of hierarchical structure formation; studies of these systems will provide insights into structure evolution. Groups in the infall regions of nearby clusters may offer a unique probe of the physics of the warm/hot ionized medium (WHIM) which is difficult to observe directly with current instruments.
1 Introduction
Hierarchical structure formation predicts that rich clusters of galaxies should be surrounded by less massive, infalling clusters or groups. Many authors have discussed substructure within the virial region (e.g., Geller & Beers (1982); Dressler & Shectman (1988); White, Briel, & Henry (1993); Mohr, Fabricant, & Geller (1993)). Reisenegger et al. (2000, hereafter RQCM) recently demonstrated dynamical connections between many clusters in the Shapley Supercluster and A3558, the central cluster. We describe similar observations of the infall region around A2199 (Abell (1958)) and show that it contains A2197, one or two X-ray emitting groups, and up to five additional groups identified in redshift surveys, all of which lie outside the virial region of A2199.
In redshift space, the infall regions of clusters form a characteristic trumpet-shaped pattern (bounded by caustics) as galaxies fall into the cluster as the cluster potential overwhelms the Hubble flow (Kaiser (1987); Regös & Geller (1989); Diaferio & Geller (1997)). Galaxies outside the caustics are outside the infall region; within the caustics, there are few interlopers. Here, we use the observed caustics around A2199 to identify members of the infall region and to compare the structure of the supercluster as seen in galaxies to the X-ray structure revealed by the ROSAT All-Sky Survey (RASS111The RASS is available at http://www.xray.mpe.mpg.de/cgi-bin/rosat-survey/ ; Voges et al. (1999)). We use the X-ray data to show that the infall region contains bound systems destined for accretion. The physical scale at the redshift of the supercluster () is ().
2 Observations
We have collected 1216 redshifts (957 new or remeasured) in a large region (95 square degrees) surrounding A2199/A2197. Two of us (JJM and GW) used the Decaspec (Fabricant & Hertz (1990)) at the 2.4-m MDM telescope on Kitt Peak to obtain 249 (248 unique) redshifts of galaxies in the central of this region for a separate Jeans’ analysis of the central region of A2199 (J.J. Mohr et al. in preparation).
We used the FAST spectrograph (Fabricant et al. (1998)) on the 1.5-m Tillinghast telescope of the Fred Lawrence Whipple Observatory (FLWO) to obtain 684 spectra of galaxies within .5 (8.4) of the center of A2199. The observations are similar to those described in Rines et al. (2000) and will appear in K. Rines et al. (in preparation). We observed infall galaxy candidates in two campaigns. We selected targets from digitized images of the POSS I from the Automated Plate Scanner222The APS databases are supported by the National Aeronautics and Space Administration and the University of Minnesota, and are available at http://aps.umn.edu/. We initially selected galaxies using the automatic classification system of APS; we visually inspected these targets to eliminate stars. The first campaign yielded a deep sample in the central region around A2199. This sample is complete to 103aE magnitude (roughly equivalent to R16.0) and consists of 305 redshifts. The second campaign (379 redshifts) was a shallower survey ( or ) of all galaxies within of A2199. The completeness limits are not very precise because the magnitudes come from multiple plate scans and because we could not obtain redshifts for some low surface brightness galaxies. We include 84 redshifts associated with the groups NRGs385 and NRGs388 obtained by FAST for a separate study of the X-ray and optical properties of groups of galaxies (59 published in Mahdavi et al. (1999); Mahdavi et al. (2000), hereafter MBGR).
We collected the remaining 200 redshifts from ZCAT333Available at http://cfa-www.harvard.edu/huchra/zcat and/or the NASA/IPAC Extragalactic Database444The NASA/IPAC Extragalactic Database is available at http://nedwww.ipac.caltech.edu/index.html. X-ray data for these systems are available from the RASS.
3 Defining the Infall Region with Caustics
Figure 1 displays the projected radii and redshifts of galaxies surrounding A2199. The expected caustic pattern is easily visible; we calculate the shape with the technique described in Diaferio (1999) using a smoothing parameter of . We use a hierarchical clustering analysis to determine the center of the largest system, A2199; we use this as the center of the supercluster. The caustics shown in Figure 1 do not include the symmetry and first derivative constraints of Diaferio (1999). We will determine the caustics and the supercluster mass profile in more detail in Rines et al. (in preparation). Preliminary results indicate that the total supercluster mass is in the range within a radius of . For comparison, Markevitch et al. (1999, hereafter MVFS) use X-ray data to estimate a mass of within for A2199. The A2199 supercluster is located within the Great Wall (Geller & Huchra (1989); Figure 6b of Falco et al. (1999)), which may complicate the interpretation of the dynamics of the system.
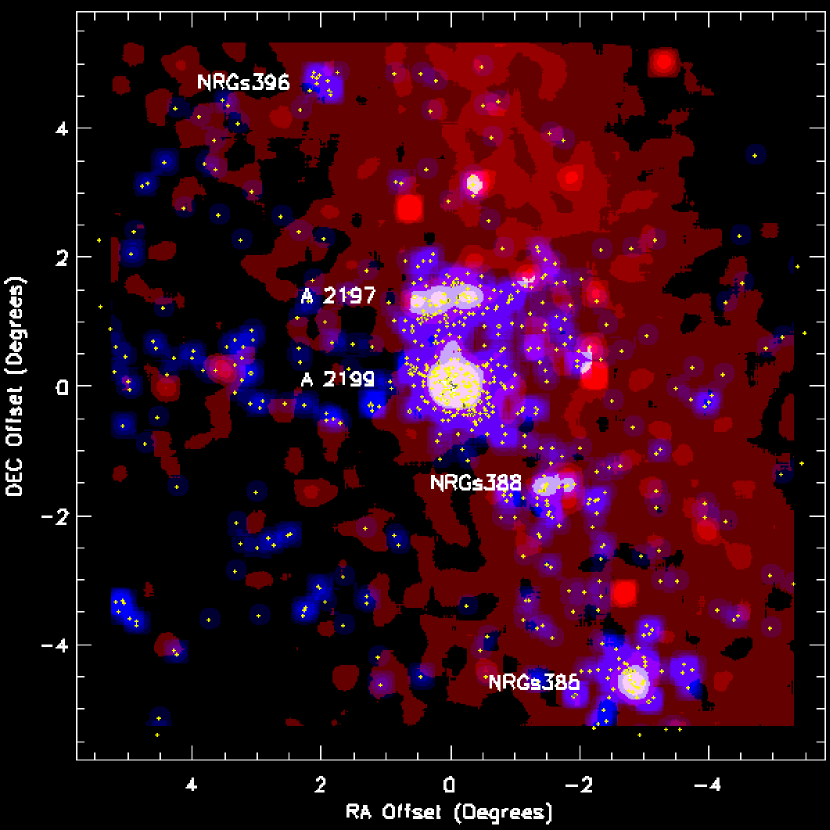
The sky positions of galaxies in the infall region (crosses in Figure 2) show several groups in addition to the main cluster. Table 1 lists the coordinates and basic properties of these systems (MBGR). Figure 2 displays X-ray contours from the RASS (red) and contours of the local galaxy density overlaid (blue). Purple regions in the figure therefore show regions with both significant galaxy overdensities and X-ray emission; X-ray emission confirms that a system is bound. The largest purple region is A2199, at least one background X-ray source and A2197 are to the N, and NRGs388 and NRGs385 are to the SW of A2199. The X-ray emission from A2199 is quite symmetric relative to other clusters (Mohr et al. (1995); MVFS ), which suggests that the inner region of A2199 has not undergone any recent major mergers. The infalling groups are all located at projected radii significantly larger than the virial radius (, Girardi et al. (1998); , MVFS ). We identify galaxies within of these systems in Figure 1.
NRGs385, NRGs388, and A2199 are roughly colinear (Figure 2). This alignment may be coincidental or it may indicate the presence of a filament of galaxies and/or dark matter. A2197 and an optical group with no X-ray counterpart in the RASS lie roughly along the extension of this line to the NE. The apparent X-ray excess in a NE-SW band, coincidentally along the broad apparent filament, is probably an artifact of the RASS scan pattern. Archival pointed PSPC observations indicate that the X-ray surface brightness of the filament is less than erg cm-2s-1arcmin-2. Briel & Henry (1995) obtain similar limits for other clusters.
4 Infalling Systems
4.1 Abell 2197
Rood (1976) first suggested that, due to their close proximity on the sky and in redshift space, A2197 and A2199 are part of a supercluster. Gregory & Thompson (1984) analyzed the pair as a binary cluster. A2197 is an optically rich Abell cluster with an apparent velocity dispersion comparable to A2199 (Girardi et al. (1998)), but X-ray data suggest that A2197 is significantly less massive than A2199 (e.g., White, Jones & Forman (1997); Jones & Forman (1999)). The absence of a sharp spike in the caustic pattern at the projected radius of A2197 (Figure 1) indicates that the infall pattern is dominated by A2199 and that the apparently large velocity dispersion of A2197 is due in part to its proximity to A2199.
A2199 and A2197 provide an interesting contrast. A2199 is a rich, regular cluster with both a centrally concentrated galaxy distribution and X-ray emission. The galaxies around A2197 are significantly elongated to the SE and NW and they are much less centrally concentrated than in A2199. Archival ROSAT data reveals that the X-ray emission has at least three components (all three are evident in Figure 2). The central component is centered on NGC 6173, the more luminous component to the W is centered on NGC 6160, and the source to the E is not centered on any bright galaxies and is probably a background source (C. Jones 2000, private communication; note also that a point source is evident between A2199 and A2197). The galaxy distribution in A2197 is quite different from the X-ray emission, though not as dramatically as A754 (Zabludoff & Zaritsky (1995)). We suggest that A2197 is either forming from the merger of two groups or that it is being disrupted by A2199.
4.2 NRGs388
The X-ray emission from NRGs388 is centered on a bright elliptical which dominates the group (see Figure 6 of MBGR). There is no significant substructure in either the X-ray emission or the galaxy distribution within NRGs388. The apparent absence of ram pressure stripping or tidal distortions may constrain the distribution of intercluster gas or the shape of the gravitational potential of the supercluster.
4.3 NRGs385
NRGs385 is located or virial radii from A2199. Although other investigators have found X-ray emitting groups around rich clusters (e.g., Briel, Henry, & Böhringer (1992); Wang, Connolly, & Brunner (1997); Kull & Böhringer (1999); Donnelly et al. (1999); RQCM ), to our knowledge no other X-ray group so far outside the virial radius of a cluster has been linked to it kinematically. While the kinematic connection is clear, NRGs385 may not be bound to the supercluster (Rines et al. in preparation).
NRGs385 is sufficiently massive that it distorts the caustic pattern in its vicinity (Figure 1). This effect is expected; subclustering increases the amplitude of the caustics at all radii (Diaferio (1999)), but spikes in the amplitude of the caustics can reveal the presence of massive subclusters. The existence of this distortion confirms the hypothesis that subclusters can alter the sharp caustics expected from spherical infall. It is striking that the expected distortion is evident from this group but no such distortions are evident in the infall region of A3558 (see Figure 1 of RQCM ) even though it contains infalling clusters which are probably more massive than NRGs385. The reason for this difference is unclear, although it might depend on the galaxy population included by the selection criteria of RQCM.
The peak of the X-ray emission in NRGs385 is offset (at roughly the 3 level) from the center of the galaxy distribution. The X-ray center is located SW of the optical center, away from A2199. If this offset is not due to a projection effect, it could indicate that either the galaxies do not trace the gravitational potential of the group or the group has recently undergone a merger. We rule out the possibility of ram pressure stripping (e.g., Gunn & Gott (1972)) by the warm/hot ionized medium (WHIM) because the required gas density in the WHIM would produce X-ray emission above our upper limit on the surface brightness of any filament ().
The shape of the X-ray contours may provide information about the physical processes occuring in the infalling groups. NRGs385 is visibly elongated in the direction of A2199 and along the possible filament; the width of the contour is approximately NE-SW and approximately SE-NW (see Figure 6 of Mahdavi et al. (1999)). This elongation may be caused by tidal effects and/or the presence of a filament.
4.4 X-ray Faint Groups
Several small knots of galaxies are evident in Figure 2. Many of these are probably chance superpositions rather than physical groups. Four of them are contained in the RASSCALS optical catalog (MBGR), though none has significant extended X-ray emission (we list upper limits from the RASS in Table 1). A fifth possible group, NRGs396 (Ramella et al. (1997); named according to the convention of MBGR), is located NE of A2199, but is too poor (4 group members in the CfA redshift survey) for inclusion in the RASSCALS catalog (MBGR require a minimum of 5 group members in the CfA redshift survey). The X-ray faint group NRGs389 lies between NRGs385 and NRGs388 and is aligned with the possible filament.
We find marginal evidence () of X-ray emission near NRGs396 in the RASS; pointed observations of these groups with XMM-Newton or Chandra would place tighter constraints on their X-ray properties. Like NRGs385, NRGs396 and NRGs400 are sufficiently distant from the center of the supercluster that they may not be gravitationally bound.
5 Discussion
The infall pattern in redshift space (delineated by the caustics) indicates that A2197 and one or two X-ray groups (NRGs388 and NRGs385) are connected kinematically to A2199. The three systems are located at projected radii of , and (2.2, 3.1, and ) respectively; we also identify five X-ray faint groups in the infall region. All three systems with X-ray emission are significantly less massive than A2199.
To our knowledge, NRGs388 (and possibly NRGs385) is the first X-ray group demonstrably bound to a cluster even though it lies well outside the virial radius (RQCM demonstrate similar connections between X-ray clusters in the Shapley supercluster). The identification of caustics delineating the infall regions of clusters reveals the kinematic connections between clusters and distant, infalling subclusters.
At large radii from rich clusters, it is difficult to observe the WHIM directly with current X-ray instruments (Kull & Böhringer (1999); Pierre, Bryan, & Gastaud (2000); Cen & Ostriker (1999)). The presence of hot gas in at least some infalling groups shows that the intracluster medium in clusters of galaxies can be accreted from infalling groups. Like groups at smaller radii (White et al. 1993, Donnelly et al. (1999)), these groups may interact with the WHIM and thus yield insight into its properties and processes such as cooling and feedback (Pierre et al. 2000).
References
- Abell (1958) Abell, G.O. 1958, ApJS, 3, 211
- Briel & Henry (1995) Briel, U.G., & Henry, J.P. 1995, A&A, 302, L9
- Briel, Henry, & Böhringer (1992) Briel, U.G., Henry, J.P., & Böhringer, H. 1992, A&A, 259, L31
- Cen & Ostriker (1999) Cen, R. & Ostriker, J.P. 1999, ApJ, 514, 1
- Diaferio (1999) Diaferio, A. 1999, MNRAS, 309, 610
- Diaferio & Geller (1997) Diaferio, A. & Geller, M. 1997, ApJ, 481, 633
- Donnelly et al. (1999) Donnelly, R.H., Markevitch, M., Forman, W., Jones, C., Churazov, E., & Gilfanov, M. 1999, ApJ, 513, 690
- Dressler & Shectman (1988) Dressler, A. & Shectman, S.A. 1988, AJ, 95, 985
- Fabricant et al. (1998) Fabricant, D., Cheimets, P., Caldwell, N., & Geary, J. 1998, PASP, 110, 79
- Fabricant & Hertz (1990) Fabricant, D. & Hertz, E. 1990, SPIE Proc., 1235, 747
- Falco et al. (1999) Falco, E.E., et al. 1999, PASP, 111, 438
- Geller & Beers (1982) Geller, M.J., & Beers, T.C. 1982, PASP, 94, 421
- Geller & Huchra (1989) Geller, M.J., & Huchra, J.P. 1989, Science, 246, 897
- Girardi et al. (1998) Girardi, M., Giuricin, G., Mardirossian, F., Mezzetti, M., & Boschin, W. 1998, ApJ, 505, 74
- Gregory & Thompson (1984) Gregory, S.A. & Thompson, L.A. 1984, ApJ, 286, 422
- Gunn & Gott (1972) Gunn, J.E. & Gott, J.R. 1972, ApJ, 176, 1
- Jones & Forman (1999) Jones, C. & Forman, W. 1999, ApJ, 511, 65
- Kaiser (1987) Kaiser, N. 1987, MNRAS, 227, 1
- Kull & Böhringer (1999) Kull, A. & Böhringer, H. 1999, 341, 23
- Kurtz & Mink (1998) Kurtz, M.J. & Mink, D.J. 1998, PASP, 110, 934
- Mahdavi et al. (1999) Mahdavi, A., Geller, M.J., Böhringer, H., Kurtz, M.J., & Ramella, M. 1999, ApJ, 518, 69
- Mahdavi et al. (2000) Mahdavi, A., Böhringer, H., Geller, M.J., & Ramella, M. 2000, ApJ, 534, 114 (MBGR)
- (23) Markevitch, M., Vikhlinin, A., Forman, W.R., & Sarazin, C.L. 1999, ApJ, 527, 545 (MVFS)
- Mohr et al. (1995) Mohr, J.J., Evrard, A.E., Fabricant, D.G., & Geller, M.J. 1995, ApJ, 447, 8
- Mohr, Fabricant, & Geller (1993) Mohr, J.J., Fabricant, D.G., & Geller, M.J. 1993, ApJ, 413, 492
- Pierre, Bryan, & Gastaud (2000) Pierre, M., Bryan, G., & Gastaud, R. 2000, A&A, 356, 403
- Ramella et al. (1997) Ramella, M., Pisani, A., & Geller, M.J. 1997, AJ, 113, 483
- Regös & Geller (1989) Regös, E. & Geller, M. 1989, AJ, 98, 755
- (29) Reisenegger, A., Quintana, H., Carrasco, E.R., & Maze, J. 2000, AJ, 120, 523 (RQCM)
- Rines et al. (2000) Rines, K., Geller, M.J., Diaferio, A., Mohr, J.J., & Wegner, G. 2000, AJ, 120, 2338
- Rood (1976) Rood, H.J. 1976, ApJ, 207, 16
- Voges et al. (1999) Voges, W. et al. 1999, A&A, 349, 389
- Wang, Connolly, & Brunner (1997) Wang, Q.D., Connolly, A.J., & Brunner, R.J. 1997, ApJ, 487, L13
- White, Briel, & Henry (1993) White, S.D.M., Briel, U.G., & Henry, J.P. 1993, MNRAS, 261, L8
- White, Jones & Forman (1997) White, D.A., Jones, C., & Forman, W. 1997, MNRAS, 292, 419
- Zabludoff & Zaritsky (1995) Zabludoff, A.I. & Zaritsky, D. 1995, ApJ, 447, L21
| System | Coordinates | log | ||||
|---|---|---|---|---|---|---|
| RA (J2000) | DEC (J2000) | ergs s-1 | ||||
| A2199 | 16 28 38 | 39 33 05 | 8963 | 80192 | – | 43.9 |
| A2197W | 16 27 41 | 40 55 40 | 9300 | 61256 | 2.2 | 42.9 |
| A2197E | 16 29 43 | 40 49 12 | – | – | 2.0 | 42.7 |
| NRGs385 | 16 17 15 | 34 55 00 | 9478 | 525216 | 8.0 | 42.9 |
| NRGs388 | 16 23 01 | 37 55 21 | 9788 | 46894 | 3.1 | 42.6 |
| NRGs389 | 16 21 57 | 36 02 22 | 10096 | 13238 | 5.8 | |
| NRGs396 | 16 36 50 | 44 13 00 | 9540 | 480105 | 7.6 | 42.0 |
| NRGs395 | 16 37 05 | 36 09 01 | 9957 | 33167 | 5.8 | |
| NRGs399 | 16 41 42 | 39 47 07 | 9677 | 40794 | 3.8 | |
| NRGs400 | 16 48 13 | 35 59 23 | 10085 | 724424 | 8.1 | |