Analysis of ProNaOS submillimeter maps in the M42 Orion Nebula — Temperature - spectral index inverse correlation in several regions
Abstract
We have mapped with the French submillimeter balloon-borne telescope ProNaOS the thermal emission of the dust in the M42 Orion Nebula. The map obtained is 50’ by 40’ with an angular resolution of about 3’ in the four efficient wavelengths 200 , 260 , 360 and 580 . The temperature and index we obtain are highly variable within the studied region: the temperature varies from 12 K to 70 K, and the spectral index from 1.1 to 2.2. The statistical analysis of the temperature and spectral index spatial distribution in this region, as well as in the other regions mapped by ProNaOS, shows an evidence of an inverse correlation between these two parameters. We deduce the column densities of gas and the masses. Being invisible in the IRAS 100 survey, some cold clouds are likely to be the seeds for future star formation activity going on in the complex.
Keywords. — dust — infrared: ISM: continuum — ISM: clouds — ISM: individual (Orion Nebula)
1. Introduction
At about 470 pc, the Orion Nebula is one of the nearest massive star formation regions. The Orion A giant cloud contains the HII region M42, well known as the Great Orion Nebula. Behind the H II region is the OMC-1 molecular cloud, which corresponds to a CO emission peak. North from OMC-1, one can clearly see an extended ”integral-shaped” filament (ISF below) with two denser regions called OMC-2 and OMC-3. This area has been intensively studied, from optical radiations to radio wavelengths, often with high angular resolution but restricted to the hot core of the nebula (see for example the review of Genzel & Stutzki 1989).
We have studied this region with the submillimeter balloon-borne telescope ProNaOS. The simultaneous measurements within four bands covering the wavelength range 200 - 800 allows for the first time to constrain both temperature and spectral index of the dust, and reveals their variation over the whole complex. A little part of the area mapped here had been already mapped by Ristorcelli et al. (1998).
2. Observations
ProNaOS (PROgramme NAtional d’Observations Submillimétriques) is a French balloon-borne submillimeter experiment, with a 2 m diameter telescope (Buisson & Durand 1990). The focal plane instrument SPM (Système Photométrique Multibande, see Lamarre et al. 1994) is composed of a wobbling mirror, providing a beam switching on the sky and four bolometers cooled at 0.3 K (180-240 , 240-340 , 340-540 , 540-1200 ). The beam diameters are 2’ in bands 1 and 2, 2.5’ in band 3 and 3.5’ in band 4. The true sky is optimally restored from the time-ordered data by using a Wiener linear inversion method. The data we present here were obtained during the second flight of ProNaOS in september 1996, at Fort-Sumner, New Mexico.
3. Results
We present in Fig. 1 the images obtained in the extreme photometric bands of ProNaOS-SPM.
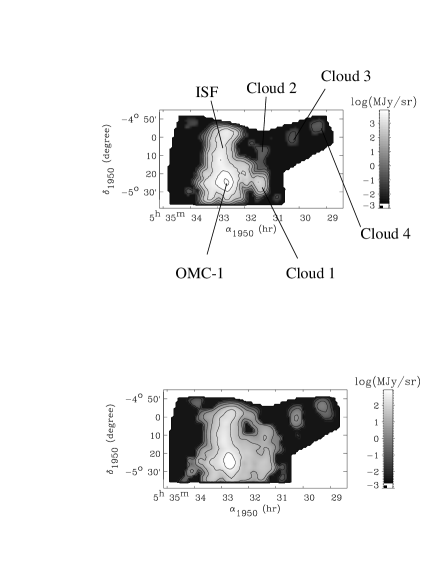
The brightest observed area is the molecular cloud OMC-1. North from it is clearly visible the integral-shaped filament. One can see west from the central core a weaker cloud that we call Cloud 1. A weaker emission can be seen around this cloud, that is linked to the Cloud 2 northwards. The Clouds 2, 3, 4 can be seen on the west of the maps on Fig. 1, from east to west. The Cloud 2 is a weak intensity condensation discovered during the first flight of ProNaOS (Ristorcelli et al. 1998). The Clouds 3 and 4 are two extremely weak condensations, discovered with this ProNaOS flight.
4. Analysis
4.1. Dust temperatures and spectral indexes
We average the intensity of bands 1, 2, 3 with an adequate profile in order to obtain for each band the fwhm of the fourth band (3.5’). We model the emission of the grains with a modified blackbody law:
where is the wavelength, C a constant, T the temperature of the grains, the spectral index and the Planck function.
The three parameters C, T and , are adjusted with a least square fit. The best parameters for each region selected are presented in Table 1. The dust temperature is highly variable inside and in the neighborhood of this molecular complex: from 12 K to 70 K; and the spectral index changes much too: from 1.1 to 2.2.
| T (K) | ||||
| 200 | 580 | |||
| OMC-1(3.6’) | 66.1 | 1.13 | 47 6 | 10.4 0.8 |
| ISF | ||||
| (south) 5.4’ | 22.4 | 1.71 | 5.3 1.0 | 1.3 0.1 |
| ISF | ||||
| (north) 4.2’ | 25.2 | 1.68 | 15 3 | 1.9 0.2 |
| Cloud1 (3.5’) | 17.0 | 2.21 | 4.0 3.2 | 0.76 0.23 |
| Cloud2 (3.5’) | 11.8 | 2.20 | 4.2 1.5 | 0.43 0.07 |
| Cloud3 (3.5’) | 13.3 | 1.98 | 1.4 | 0.19 0.07 |
| Cloud4 (5.2’) | 16.9 | 1.91 | 0.5 | 0.12 0.06 |
4.2. Column densities
Using the dust 100 opacity from Désert et al. (1990), and assuming that the spectral index does not change in the ProNaOS spectral range, we make a simple self-consistent model that allows us to estimate the column density , as a function of the spectral intensity and the spectral index. There is then a proportionality relation between the constant C and :
= 1.67 . C . (100
with in protons/cm2 and C in .
We make another simple model using the 100 opacity of Ossenkopf & Henning (1994) model specific to protostellar cores. The proportionality relation is then:
= 6.02 . C . (100
with in protons/cm2 and C in .
We compare our column density results to those derived from observations of the rotational transition of , made by Nagahama et al. (1998). We transform the observed into the column density in cm-2 by using the correspondence established by Bally et al. (1991) in the Orion Nebula: = 2 1021 cm-2/(K km/s). As we can see in Table 2, there is a rather good agreement between NH estimated by the model from Désert et al. and NH from 13CO data, except for the cold clouds 3 and 4. That may be explained by the fact that some cold condensations are the site of formation of molecular ice mantles on the grains, and of coagulation of grains. These processes are taken into account by the model of Ossenkopf & Henning. The estimations of NH from this model are in rather good agreement with 13CO data for Clouds 3 and 4.
| NH Désert | NH Ossenkopf | NH 13CO | Mass Dés. | Mass Oss. | Jeans m. | |
| (M⊙) | (M⊙) | (M⊙) | ||||
| OMC-1(3.6’) | 1400 | —— | 1080 | 212 | — | — |
| ISF | ||||||
| (south) 5.4’ | 245 | —— | 540 | 83 | — | — |
| ISF | ||||||
| (north) 4.2’ | 525 | —— | 680 | 108 | — | — |
| Cloud1 (3.5’) | 320 | 115 | 350 | 42 | 15 | 12.6 |
| Cloud2 (3.5’) | 320 | 120 | 200 | 46 | 17 | 8.7 |
| Cloud3 (3.5’) | 95 | 34 | 40 | 9.9 | 3.6 | 8.4 |
| Cloud4 (5.2’) | 33 | 12 | 10 | 10.3 | 3.7 | 18.5 |
We also show in Table 2 the mass of each region. In order to have a first evaluation of the gravitational stability of the clouds, we compare their masses to their Jeans masses. We see a trend that the closer to the complex the cold clouds are, the more unstable they seem to be.
4.3. Temperature - index inverse correlation
The correlation coefficient between T and has been computed globally for each studied region of ProNaOS second flight.
The correlation coefficients are -0.92 for Orion, -0.78 for M17, -0.89 for Ophiuci. From our simulations, this inverse correlation has to be an intrinsic physical property of the grains.
5. Conclusion
Our study shows a large distribution of temperatures and spectral indexes all around the M42 Orion Nebula. The temperature varies from 12 K to 70 K, and the spectral index from 1.1 to 2.2. The discovery of two new cold clouds (Clouds 3 and 4) confirms that the existence of cold condensations in such regions is not unusual. The statistical analysis of the temperature and spectral index spatial distribution shows an evidence for an inverse correlation between these two parameters. This effect is not well explained yet, especially in the submillimeter spectral range for cold grains ( 20 K). It has been shown to occur in the laboratory for warm grains by Mennella et al., and for cold grains in the millimeter by Agladze et al.
We see a trend that the closer to the complex the cold clouds are, the more unstable they are. The history of star formation around OMC-1 shows that there has already been 3 to 4 successive bursts of star formation in this region with the embedded cluster responsible for the BN/KL object being the latest. The clouds that we observe close to the active region may thus be the seeds of the next generation of stars. This should be sustained by more observations, particularly of the possible embedded protostars.
References
- Agladze et al. 1996 Agladze, N.I., Sievers, A.J., Jones, S.A., Burlitch, J.M., Beckwith, S.V.W.: 1996, ApJ, 462: 1026-1040
- Bally et al. 1991 Bally, J., Langer, W.D., Liu, W.: 1991, ApJ, 383: 645-663
- Benoît et al. 2000 Benoît, A., et al. : 2000, Astron. Astrophys. Suppl., 141: 523B
- Buisson & Durand 1990 Buisson, F., Duran, M.: 1990, Proc. 29th Liège Colloq., ed. B. Kaldeich (Paris: ESA), 314
- Désert et al. 1990 Désert, F.-X., Boulanger, F., Puget, J.L.: 1990, A&A, 237: 215-236
- Dupac et al. 2000 Dupac, X., Giard, M., Bernard, J.-P., Lamarre, J.-M., Pajot, F., Ristorcelli, I., Serra, G., Torre, J.-P.: 2000, ApJ, submitted
- Genzel & Stutzki 1989 Genzel, R., Stutzki, J.: 1989, Ann. Rev. Astron. Ap., 27, 41
- Lamarre et al. 1994 Lamarre, J.M., et al. : 1994, Infrared Phys. Tech., 35, 277
- Mennella et al. 1998 Mennella, V., Brucato, J.R., Colangeli, L., Palumbo, P., Rotundi, A., Bussoletti, E.: 1998, ApJ, 496: 1058
- Nagahama et al. 1998 Nagahama, T., Mizuno, A., Ogawa, H., Fukui, Y.: 1998, Astron. J., 116, 1, 336-348
- Ossenkopf & Henning 1994 Ossenkopf, V., Henning, T.: 1994, A&A, 291: 943-959
- Ristorcelli et al. 1998 Ristorcelli, I., Serra, G., Lamarre, J.M., Giard, M., Pajot, F., Bernard, J.P., Torre, J.P., De Luca, A., Puget, J.L.: 1998, ApJ, 496: 267-273