A Short Timescale Candidate Microlensing Event in the POINT-AGAPE Pixel Lensing Survey of M31
Abstract
We report the discovery of a short-duration microlensing candidate in the northern field of the POINT-AGAPE pixel lensing survey towards M31. The full-width half-maximum timescale is very short, days. Almost certainly, the source star has been identified on Hubble Space Telescope archival images, allowing us to infer an Einstein crossing time of days, a maximum magnification of , and a lens-source proper motion as/day. The event lies projected at from the center of M31, which is beyond the bulk of the stellar lens population. The lens is likely to reside in one of three locations. It may be a star in the M31 disk, or a massive compact halo object (Macho) in either M31 or the Milky Way. The most probable mass is for an M31 Macho, for a Milky Way Macho and for an M31 stellar lens. Whilst the stellar interpretation is plausible, the Macho interpretation is the most probable for halo fractions above .
(The POINT–AGAPE Collaboration)
1Observatoire Midi-Pyrénées, 57 Avenue d’Azereix, BP 826,
65008 Tarbes Cedex, France
2CERN, 1211 Genève, Switzerland
3Laboratoire de Physique Corpusculaire et Cosmologie,
Collège de France, 11 Place Marcelin Berthelot, F-75231 Paris, France
4Astronomy Unit, School of Mathematical Sciences, Queen Mary
& Westfield College, Mile End Road, London E1 4NS, UK
5Université Bretagne-Sud, campus de Tohannic, BP 573, F-56017
Vannes Cedex, France
6Theoretical Physics, 1 Keble Road, Oxford OX1 3NP, UK
7Department of Astronomy, Ohio State University, 140 West 18th Avenue, Columbus, OH 43210
8Institute of Astronomy, Madingley Road, Cambridge CB3 0HA, UK
9Depto. de Astronomia, UFRJ, Ladeira do Pedro Antônio 43,
20080-090 Rio de Janeiro RJ, Brazil
10DEMIRM UMR 8540, Observatoire de Paris, 61 Avenue
Denfert-Rochereau, F-75014 Paris, France
11Laboratoire d’Astrophysique UMR CNRS 5572, Observatoire
Midi-Pyrénées, 14 Avenue Edouard Belin, F-31400 Toulouse,
France
1 Introduction
Following the suggestion of Paczyński (1986), several groups searched for dark matter in the form of massive compact halo objects (Machos), using gravitational microlensing of background stars in the Magellanic Clouds (see Alcock et al. 2000; Lasserre et al. 2000; and references therein). After monitoring about 107 stars for several years, the results are consistent with a Macho halo mass fraction of , though with considerable uncertainty.
The possibility of detecting microlensing events in M31 was independently suggested by Crotts (1992) and Baillon et al. (1993). The advantage of targeting a large external galaxy is that the number of stars that can act as possible sources is enormous. Moreover, the high inclination of M31’s disk causes an asymmetry in the observed rate of microlensing by lenses in a spheroidal halo. Although this gives an unambiguous signature of the halo lenses (Crotts (1992)), the difficulty is that the sources are resolved only while they are lensed (and then only if the magnification is substantial). Nonetheless, pilot campaigns by the Columbia-VATT group (Crotts & Tomaney (1997)) and by the AGAPE collaboration (Ansari et al. (1997); Ansari et al. (1999)) established the feasibility of such observations and identified some candidate microlensing events. In particular, the AGAPE collaboration (Ansari et al. (1999)) reported a short duration candidate, AGAPE Z1, in the bulge of M31.
The POINT-AGAPE collaboration111 see http://www.point-agape.org employs the Wide Field Camera (WFC) on the 2.5 m Isaac Newton Telescope (INT) to carry out a pixel-lensing survey towards M31, monitoring two fields of 0.3 deg2 each, located North and South of the M31 center. The survey has the potential to map the global distribution of the microlensing events in M31 and to determine any large-scale gradient. POINT-AGAPE is a long-term program, as at least three years of data will be required to make a convincing identification of a gradient (Kerins et al. 2001). Also, it is usually necessary with pixel lensing to establish a long baseline to distinguish microlensing events from variable stars. In this Letter, we report on a particularly interesting and convincing early candidate, PA-99-N1, so named because it is the first event to be announced by POINT-AGAPE that peaks in the northern field in 1999.
2 Observations and Data Analysis
We restrict analysis to a () field centered west and north of the center of M31. The observations are spread over 36 epochs between August and December 1999. The exposures are in two bands: 36 epochs in Sloan and 26 epochs in Sloan . The exposure time is typically between 5 and 10 minutes per night. The sampling averages to one epoch every three nights, though the observations are strongly clustered because the WFC is not always mounted. The data reduction is described in detail elsewhere (Ansari et al. (1997); Strauman et al. (1998); Le Du (2000)).
After bias subtraction and flat-fielding, each image is geometrically and photometrically aligned relative to a reference image (14 August 1999) which was chosen because it has a long exposure time, typical seeing () and little contamination from the Moon. The lightcurves are computed by summing the flux in 7-pixel () square “superpixels” and then removing the correlation with seeing variation. This size is set by the worst seeing .
We use a simple set of candidate selection criteria designed to isolate high signal-to-noise events. Detection of events is made in the band, which has better sampling and lower sky background variability. For an event to be detected, it must induce one and only one significant bump on the lightcurve. A bump is defined by at least 4 consecutive data points rising above the background by a minimum of . Its significance is quantified by the probability of obtaining data points, each of which has at least the signal to noise ratio of the measured points (evaluated assuming Gaussian errors). To pass as a microlensing candidate, we demand the lightcurve has only one bump with and no other bump with . A similar selection procedure was used by the AGAPE Pic du Midi program (Ansari et al. 1997).
The background is the minimum of the running average of 7 consecutive data points. Flagged events are fitted to a high magnification degenerate microlensing curve (Gould 1996) simultaneously in the and bands, whose 6 parameters are (). Here, is the full-width at half-maximum, is the time of the peak, is the baseline flux and is the flux difference between baseline and maximum. We require a per degree of freedom be less than 3 for this fit. We also require at least minimal detection in , i.e. . To insure a high probability of detecting microlensing rather than other forms of stellar variability, given the clustered sampling and relatively short duration of the observations, we demand days and a peak flux , corresponding to . We find one candidate which has day and .
3 The Microlensing Candidate
Figure 1 shows the lightcurves in and of this candidate together with the non-degenerate fit derived below. The data with comparatively large error bars were taken on nights with high Moon background. Using the Aladin Sky Atlas222 see http://aladin.u-strasbg.fr/aladin.gml, we find that PA-99-N1 has J2000 position: , . That is, it lies projected on the near disk, from the center of M31.
There are some straightforward tests to see if PA-99-N1 is compatible with microlensing. First, there are no comparable “bumps” in the remainder of the lightcurve shown in Figure 1 as might be expected for many classes of variable stars. (There is, however, a much smaller but somewhat disturbing bump in December, near day 130. We investigate this bump in § 4.1.) There also are no comparable bumps at this field position in our data taken in 1998 and 1999 with the 1.3m McGraw-Hill telescope at the MDM observatory. Second, microlensing events are achromatic, so the ratio of flux change in different bands should be constant in time (e.g., Ansari et al. 1997). This requires
| (1) |
which does indeed hold for PA-99-N1 (see Fig. 1c).
Using DAOPHOT (Stetson (1987)) on the images taken nearest maximum magnification, we find and , i.e., and , assuming and estimated total extinction . The transformation from instrumental to Johnson is based on 31 standard stars that lie in the same field as PA-99-N1 (Magnier et al. (1992); Magnier et al. (1993); Haiman et al. (1994)).
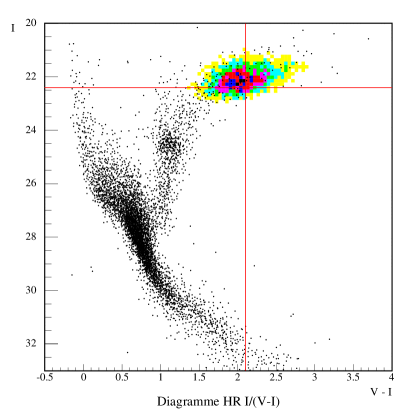
The PA-99-N1 position lies within a series of five Hubble Space Telescope (HST) WFPC2 archival images taken in July 1996, three with F814W () and two with F606W (). We use the relations of Zheng et al. (2001) to transform from these filters to Johnson-Cousins and . Since the event is very red, , the source must lie either high up on the giant branch where essentially all stars are resolved by HST, or must be on the main-sequence and so magnified by (see Fig. 2). The latter possibility is extremely unlikely a priori. Hence, a firm prediction of the microlensing interpretation is that there should be a resolved star in the HST image with the same color and same position as the event.
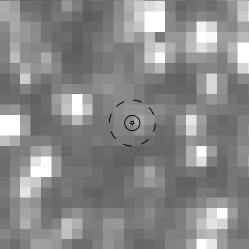
To measure the spatial position of the event within the INT image we take the difference of the image at maximum and another image at baseline that has similar seeing. The difference image shows a well-defined and isolated difference star whose position we measure using IRAF IMEXAMIN. Variation of the IMEXAMIN parameters changes the result by pixels (), which we adopt as the error in the measurement. The spatial transformation between the INT and HST fields is derived by comparing the positions of the eight stars that are both resolved in the INT image and unsaturated in the HST image. The uncertainty in this transformation is much smaller than that of the INT position measurement. Figure 3 shows part of the HST field with the and positional error circle centered on the event. Close to this circle there is a resolved star for which we find and , implying . There are no other resolved stars within the circle. For typical stellar populations this is compatible with the measured for the event (Demarque et al. 1996; Yi, Demarque, & Oemler 1996). The prior probability to find such a star so close to the predicted position is only 3%. We conclude that the resolved HST object is almost certainly the source star of the event.
4 Lightcurve Interpretation
4.1 PA-99-N1 as a Variable Star
Before analyzing PA-99-N1 as a microlensing event, we need to ask whether it is consistent with an interpretation as a variable star? The color and magnitude are compatible with a M0 Mira at maximum. However, such Miras have periods greater than 200 days and their flux at maximum does not vary as rapidly as the event (Allen 1999). PA-99-N1 is unlikely to be a dwarf nova. It is too bright at maximum to be in M31. If it is a Galactic dwarf nova, it must be either unusually faint or improbably far from us ( kpc). It is also unlikely to be a nova. The brightness decrease of PA-99-N1 just after maximum is very rapid with a rate of decline of about 0.7 magnitudes/day. Capaccioli et al. (1989) studied the relation between the rate of decline and the magnitude at maximum for novae in M31 and found that the brighter the nova, the faster the decrease. The decline of PA-99-N1 would indicate a nova as bright as , which would imply , in stark contrast to the small extinction seen in Figure 2. To conclude, there is no type of stellar variability known to us that could generate the lightcurve of PA-99-N1.
However, if the December bump near day 130 in Figure 1 were due to the event source, one would nevertheless have to conclude that the source was probably a variable. We therefore investigate this bump closely. For each of the nine December images, we find a corresponding image at baseline with comparable seeing, and subtract the two. Summing these difference images, we find a very clear stellar profile located south of the source. Hence, this bump is due to genuine stellar variability, which was close enough to contaminate our superpixels, but is clearly distinguishable from the event source. We eliminate these contaminated December points from the analysis.
4.2 PA-99-N1 as a Microlensing Event
Making use of the identification of the HST star as the source of the microlensing event, we fit the data to a full (non-degenerate) microlensing curve and so evaluate the Einstein crossing time, days.
| Fit Parameters | ||||||||
| (days) | (days) | (ADU/s) | (ADU/s) | (ADU/s) | (ADU/s) | |||
.
By permitting the measurement of ,
| (2) |
the identification of the source reduces but does not eliminate the degeneracy in the lens parameters. The mass remains entangled with and , the lens-source relative parallax and proper motion. If the lens transits the source, one can measure and so further break the parameter degeneracy (Gould 1994; Alcock et al. 1997). We are not able to measure for PA-99-N1, but are able to strongly constrain it from the lack of finite source effects that would be induced by a transit.
Let , where is the angular radius of the source. We find that if we fit the lightcurve with fixed at any value , then the other parameters all assume the same values as in Table 1. However, as is increased further, declines, so that the parameter combination saturates at day, and then for , rises dramatically. From this we derive the constraint day, implying,
| (3) |
Using the empirical surface-brightness/color relation of van Belle (1999), the color-color transformation of Bessell & Brett (1988), and an estimated total extinction , we find , where the uncertainty is dominated by the 11% intrinsic scatter about the van Belle (1999) relation. The constraint (3) then yields
| (4) |
where is the transverse speed of the lens relative to the observer-source line of sight, and is the distance to the lens. While the constraint (4) is unimportant for Galactic lenses (where kpc), it strongly limits the allowed range of for M31 lenses (since high values are exponentially suppressed). Hence is crudely measured, which implies, via equation (2), a constrained relation between and . Thus, when the proper-motion constraint (4) is incorporated into the Monte Carlo (see below) it indirectly constrains the mass to a much narrower range than would be allowed without it. Note that our finite source fits incorporate a linear limb-darkening parameter of 0.78 in band, which is appropriate for a (M0-M1, 3630 K) star (Manduca, Bell & Gustafsson 1977; Johnson 1966).
5 Discussion
The location of PA-99-N1, at nearly from the center of M31, is interesting because the majority of stellar lenses are expected to reside within of the M31 center (e.g., Kerins et al. 2001). The significance of the candidate is assessed by performing Monte Carlo simulations of events with the same source magnitude, Einstein timescale and projected position as PA-99-N1, as well as taking account of the lower limit on in equation (4). We use the actual sampling and exposure times for the 1999 season. We model the halos of both galaxies with cored near-isothermal spheres, taking the mass of M31 as twice the mass of the Galaxy and assuming a core radius of 5 kpc for both galaxies. The M31 bulge follows Kent’s (1989) axisymmetric model while the disk has a sech-squared profile (see Kerins et al. 2001 for details). We model the disk stellar lens masses based on the Galactic disk mass function (MF) of Gould, Bahcall, & Flynn (1997) corrected for binaries and extended down to , and the bulge stellar masses using the Zoccali et al. (2000) Galactic bulge MF, similarly corrected and extended.
The thick solid line in Figure 4 (a) shows the relative probability that PA-99-N1 is due to a Macho of mass , assuming full Macho halos. The curve is normalized with respect to the probability that the lens is a star, . The thick dashed (dotted) curve gives the contribution to from M31 (Milky Way) Machos. In addition to this, we have plotted the M31 distribution before applying the proper motion cut of equation (4) (thin dashed line). The black horizontal line (‘d/b’) gives the fractional contribution of the disk lens and bulge source configuration to , whilst the gray line (‘b/b’) shows the contribution of bulge-bulge lensing. The width of these lines reflects the dispersion in the logarithm of the stellar lens mass.
Clearly, if the halos are full of Machos, the most probable interpretation is that the lens is a Macho with mass . This is about five times more likely than PA-99-N1 being due to a stellar lens. The lens is about equally likely to lie in the Milky Way or M31 halo, which is quite unexpected given that the line of sight passes only kpc from the center of M31, but kpc from the Galactic center. Normally this would cause the M31 probability to be much higher (as shown by thin dashed line). However, the constraint (4) severely suppresses the M31 distribution at low masses, while leaving the Milky Way distribution virtually unaffected. This is because the average Milky Way Macho has a relative proper motion of as/day, whilst for the typical M31 Macho it is as/day. The constraint also has the effect of displacing the peak of the M31 distribution towards higher mass.
Assuming a logarithmic prior in the Macho mass gives for an M31 Macho and for a Milky Way Macho. The M31 and Milky Way distributions are both quite broad. As they are about equal in amplitude and are displaced from one another by nearly a decade in mass, their combined distribution is even broader, with a FWHM extending from the planetary to the stellar mass range.
If the lens is a star, then the overall mass probability distribution is given by the thick solid line in Figure 4 (b). The thick dashed line (‘d/b’) shows the contribution from disk-bulge lensing whilst the thick dotted line (‘b/b’) shows the distribution for bulge-bulge lensing. The contribution of lensing involving disk sources is negligible. In the absence of the relative proper motion cut, the disk and bulge distributions would be given by the thin dashed and dotted lines respectively. Including these cuts results in a most probable mass around , making a rather plausible hypothesis that the lens is a low mass star. Logarithmic averaging of the solid line gives , i.e., only a factor 1.8 () uncertainty.
We see that, if the lens is an M31 star, it most likely lies in the disk. This is a direct consequence of the fact that the source lies at the edge of the bulge, while the line of sight passes through the near side of the disk. Comparing Figures 4a and 4b, it is clear that the mass of the lens is much better constrained if it lies in the M31 disk than the M31 halo. This is because for M31 lenses, where is the distance from the lens to the source (see eq. [2]). For both populations, the product is reasonably well constrained, but for halo lenses, can take on a very broad range of values, while for disk lenses, the geometry implies kpc. Since is measured and is constrained by equation (4), is also constrained. This means that we only detect events at the location and timescale of PA-99-N1 if the stellar mass .
The relative rate of Machos to stars is subject to a number of modeling uncertainties. First, we have assumed that the M31 halo is twice as massive as that of the Milky Way. The most recent mass estimates of the M31 halo derived from the kinematics of the satellite galaxies suggest that it may be only roughly as massive as the Milky Way (Evans et al. 2000). Second, it is sensitive to the choice of the core radius for M31’s halo, with larger core radii giving a reduced M31 Macho rate at the location of PA-99-N1. Third, we have assumed that the M31 bulge is axisymmetric, but the twisting of the optical isophotes (e.g., Walterbos & Kennicutt 1987) is evidence for the presence of a bar. Inspection of their Figure 5 shows that the twisting is away from the location of PA-99-N1. We therefore expect a bar model with the same overall mass as our axisymmetric model to have a lower surface density at the position of the event and thus a lower stellar lensing rate there.
6 Conclusions
We have reported the discovery of PA-99-N1, a high signal-to-noise, short duration event which is consistent with the microlensing hypothesis. Almost certainly, the source star has been identified on archival HST frames, from which the Einstein crossing time of days has been determined. We have argued – from the stability of the lightcurve, the achromaticity of the flux excess, the excellence of the fit, and the consistency of the color of the event at maximum with the color of the HST source – that by far the most natural explanation of this event is microlensing. The lens is most likely to be a Macho if the halo fraction is above . However, it is also plausible that the lens is a disk star with a mass of .
Acknowledgments: YLD, EJK and SJS are supported by PPARC postdoctoral fellowships and EL by a CNPq postdoctoral fellowship. NWE acknowledges financial support from the Royal Society. Work by AG was supported in part by a grant from Le Ministère de l’Education Nationale de la Recherche et de la Technologie and in part by grant AST 97-27520 from the NSF.

References
- (1) Alcock C., et al., 1997, ApJ, 491, 436
- (2) Alcock C., et al., 2000, ApJ, 542, 281
- Allen (1999) Allen C., 1999, Astrophysical Quantities, 4th edition (ed. A.N. Cox)
- Ansari et al. (1997) Ansari R., et al., 1997, A&A, 324, 843
- Ansari et al. (1999) Ansari R., et al., 1999, A&A, 344, L49
- Baillon et al. (1993) Baillon P., Bouquet A., Giraud-Héraud Y., Kaplan J., 1993, A&A, 277, 1
- (7) Bessell M.S., Brett J.M., 1988, PASP, 100, 1134
- Capaccioli et al. (1989) Capaccioli M., Della Valle M., D’Onofrio M., Rosin L., 1989, AJ, 97, 1622
- Crotts (1992) Crotts A.P.S., 1992, ApJ, 399, L43
- Crotts & Tomaney (1997) Crotts A.P.S., Tomaney A.B., 1997, ApJ, 473, L87
- Demarque et al. (1996) Demarque, P., Chaboyer, B., Guenther, D., Pinsonneault, M, Pinsonneault, L., & Yi, S. 1996, Yale Isochrones 1996, at http://achee.srl.caltech.edu/
- Evans et al. (2000) Evans N.W., Wilkinson M.I., Guhathakurta P., Grebel E.K., Vogt S.S., 2000, ApJ, 540, L9
- Gould (1994) Gould A., 1994, ApJ, 421, L71
- Gould (1996) Gould A., 1996, ApJ, 470, 201
- GBF (1997) Gould A., Bahcall, J.N., & Flynn, C. 1997, ApJ, 482, 913
- Haiman et al. (1994) Haiman Z., Magnier E.A., Lewin W.H.G., Lester R.R., van Paradijs J., Hasinger G., Pietsch W., Supper R., Trümper J., 1994, A&A, 286, 725
- Johnson (1966) Johnson H.K., 1966, ARA&A,4, 193
- Kent (1989) Kent S.M., 1989, AJ, 97, 1614
- Kerins et al. (2001) Kerins E.J., Carr B.J., Evans N.W., Hewett P.C., Lastennet E., Le Du Y., Melchior A., Smartt S., Valls-Gabaud D., 2001, MNRAS, in press (astro-ph/0002256)
- Lasserre et al (2000) Lasserre T. et al., 2000, A&A, 355, L39
- Le Du (2000) Le Du Y., 2000, Ph.D thesis, University Paris VI, Collège de France
- Magnier et al. (1992) Magnier E.A., Lewin W.H.G., van Paradijs J., Hasinger G., Jain A., Pietsch W., Trümper J., 1992, A&AS, 96, 379
- Magnier et al. (1993) Magnier E.A., Lewin W.H.G., van Paradijs J., Hasinger G., Pietsch W., Trümper J., 1993, A&A, 272, 695
- Manduca et al. (1977) Manduca A., Bell R.A., Gustafsson B., 1977, A&A, 61, 809
- (25) Paczyński B., 1986, AJ, 304, 1
- Stetson (1987) Stetson P. B., 1987, PASP, 99, 191
- Strauman et al. (1998) Strauman N., Jetzer Ph., Kaplan J., 1998, “Topics on gravitational lensing”, Napoli Series in Physics and Astrophysics, 1, 102.
- (28) van Belle G., 1999, PASP, 111, 1515
- (29) Walterbos R.A.M., Kennicutt R.C., 1987, A&AS, 69, 311
- (30) Yi, S., Demarque, O., & Oemler, A., Jr. 1997, ApJ, 486, 201
- (31) Zheng, Z., Flynn, C., Gould, A., Bahcall, J.N., & Salim, S. 2000, ApJ, submitted
- Zoccali et al. (2000) Zoccali M., Cassisi S., Frogel J.A., Gould A., Ortolani S., Renzini A., Rich R.M., Stephens A.W., 2000, ApJ, 530, 418