Photometric detection of high proper motions in dense stellar fields using Difference Image Analysis
Abstract
The Difference Image Analysis (DIA) of the images obtained by the Optical Gravitational Lensing Experiment (OGLE-II) revealed a peculiar artifact in the sample of stars proposed as variable by Woźniak (2000) in one of the Galactic bulge fields: the occurrence of pairs of candidate variables showing anti-correlated light curves monotonic over a period of 3 years. This effect can be understood, quantified and related to the stellar proper motions. DIA photometry supplemented with a simple model offers an effective and easy way to detect high proper motion stars (HPM stars) in very dense stellar fields, where conventional astrometric searches are extremely inefficient.
Subject headings:
astrometry – methods: data analysis – techniques: photometric – stars: variables: other1. Introduction
The Optical Gravitational Lensing Experiment (OGLE) is a long term massive photometric search for microlensing events (Udalski et al. 1992). Due to intrinsically low probability of this phenomenon microlensing searches focus on monitoring the densest stellar fields of the sky, the Galactic bulge region and the brightest galaxies of the Local Group (e.g. Paczyński 1996a). In 1997 the OGLE project entered its second phase (OGLE-II) when the new, dedicated 1.3m Warsaw Telescope at the Las Campanas Observatory***The Las Campanas Observatory is operated by the Carnegie Institution of Washington, Chile, started operation (Udalski, Kubiak & Szymański 1997). The temporal and spatial coverage were significantly expanded, currently reaching a total of 11 square degrees in 49 bulge fields, and also including almost entire bar regions of LMC and SMC. The data is gradually being released on the Internet.
Woźniak (2000) started Difference Image Analysis (DIA) of the OGLE-II images. Using a new technique invented by Alard & Lupton (1998) and further developed by Alard (2000) it is possible to match seeings and intensity scales of two images of the same stellar field and obtain a meaningful difference image. For variable objects in crowded environments the photometry on difference frames is superior to conventional PSF fitting. Three seasons of data for the first OGLE-II bulge field, BUL_SC1, are now in public domain (Woźniak 2000).
The field BUL_SC1 contains about 850,000 stars detectable with DoPhot software (Schechter, Mateo & Saha 1995) on the pixel reference image (a stack of 20 best frames). It covers deg2 and is centered at , . Corresponding galactic coordinates are , . The median FWHM seeing is in the full set of 197 images obtained during 3 observing seasons between 1997 and 1999. The frames are taken in drift-scan mode using a pixel SITe3 chip with the approximate pixel scale of (Udalski, Kubiak & Szymański 1997).
The observed stars have apparent magnitudes between 11.5 and 20.5 with rapidly decreasing completeness below . They can be highly blended. The list of candidate variable stars in that field contains 4597 objects. The DIA analysis of these data revealed a peculiar effect, which was first interpreted as a potential problem, and later turned out to be a discovery. Some candidate variables seemed to come in pairs separated roughly by 1 FWHM of the seeing disk. Upon visual inspection of selected cases, we noticed that light curves of stars in such couples showed approximately linear and anti-correlated trends over the entire 3 year period. This kind of long term correlated behavior would be very unlikely an instrumental artifact. Because the centroid of each candidate variable is determined once for the entire series of images, we hypothesized that a star having a detectable proper motion may produce two ”variable stars” in difference frames, even if the star has a constant magnitude during the observed period. After we confirmed this interpretation, we learned that Drake et al. (2001) have been working on the same problem with the MACHO database of conventional PSF photometry, although they proceeded in the opposite direction. Following the theoretical suggestion of Andrew Drake they found that some constant stars had the same type of temporal trend in observations: parabolic fall-off with increasing scatter, as predicted for stars with detectable motions. Both searches are compared in Section 3.2. Similar possibilities must be hiding in the OGLE database of standard PSF photometry.
In this paper we discuss this effect and present a list of selected stars with detectable proper motions. We propose a method for selecting high proper motion stars (hereafter HPM stars) in dense stellar fields using difference imaging and briefly discuss possible applications.
2. The signature of high proper motions
in the DIA photometry
As we mentioned before among candidate variables detected using DIA pipeline by Woźniak (2000) there is a noticeable number of close pairs separated in the frame by the distance comparable to the FWHM of the PSF. Light curves of both members of the pair are anti-correlated and approximately linear in time for 3 years covered by observations. In Figure 1 we show a clear example of this effect.
2.1. Simple model
In the DIA method, a reference image is subtracted from each individual image in a series of observations for a given field. This can be done after all images are resampled to the common pixel grid. Coordinate system is fixed with respect to the positions of stars in the dominant stellar population in one of the images called the coordinate template, in this case the red clump stars at mag. Therefore for imaging towards the Galactic bar, the reference coordinate system is strongly weighted towards stars at about 8.5 kpc away. Proper motion of the Galactic Center at mas yr-1 is common to all stars in the Galactic bar region. The majority of stars in the image should have totally negligible relative motions. The presence of the foreground disk stars with magnitudes around complicates slightly this definition, but the main assumption certainly holds to the level needed in this preliminary analysis. A better defined reference system can be used in the future, however it involves major changes in the software.
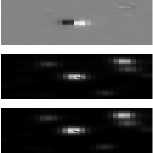
Let us suppose that one of the stars in the field (most likely a nearby one) has a detectable proper motion. Its centroid will be generally shifted with respect to the reference image. When the reference image is then subtracted from a given program image a wavy pattern will appear near the position of the moving star. Figure 2 illustrates this phenomenon in one dimensional space using a Gaussian approximation to the PSF. In the top panel we schematically show the PSF of the moving star in three different images taken at three different epochs. The difference flux after subtraction of the reference PSF from the two remaining images is shown in the bottom panel. Clearly the amplitude of the residual increases as the star moves away from its template position. The residual left in difference frames by stars with proper motions in a certain range has a characteristic dipole shape, approximately antisymmetric with respect to the middle point between the extrema of the two, positive and negative, components. For moderate proper motions the separation of the poles in this dipole is larger than the positional shift of the star between epochs in question and both poles have characteristic width of the PSF, but their shape is not strictly that of the PSF. When the shift is already comparable to, or larger than the FWHM, the residual simply consists of two separate PSF components. This issue will be discussed further in the context of sensitivities (Section 3.2). In all cases the axis of the dipole is aligned with the apparent direction of the star velocity vector in the sky. An example of this type of residual is shown in Figure 3 for a star with proper motion of 83 mas yr-1.
The residual in the form similar to the PSF and detectable in several consecutive frames will be included in the list of candidate variables by the DIA pipeline (Woźniak 2000). It is clear from Figure 3 that numerous cases of HPM stars can be found this way because both components of the dipole have a good chance to make it as suspected variables.
The total flux in the dipole will be zero within the errors as long as the HPM star does not vary itself, and therefore at any given time the sum of the differences flux in both components of the pair will also stay near zero. The zero flux difference for an individual light curve will occur at the mean time of the template frames. In case of the BUL_SC1 field most template frames were taken during the third season, which perfectly agrees with the flux difference crossing zero around JD=2451249 (Figure 1).
The trend in flux can be related to the proper motion in a straightforward way. The photometric detection of two objects in the difference frame for a pair of two individual frames at times separated by can be approximated as coming from the subtraction of two Gaussians:
| (1) |
where is the total flux, and is centroid the shift. In order to imitate photometric measurements of Woźniak (2000) we expand the right side of Equation 1 for small , take the time derivative and integrate over spatial dimension between to to obtain the slope of the light curve . We find that the proper motion in this linear approximation is related to by:
| (2) |
The result remains valid in a two dimensional case. For each HPM star we can choose the coordinate system such that the displacement and the dipole axis of symmetry will be along the axis. The equation in two dimensions integrated between and is then given, again, by Equation 1.
2.2. Parallax and differential refraction
In Figure 1 it can be seen that the individual slopes in each season are different from the general slope over all three seasons. There are at least two additional effects which change the relative position of the star with respect to the remaining stars in the field. One of them, the parallactic motion, is of great interest because it gives a distance estimate for relatively nearby stars, and HPM stars are likely to be sufficiently close. The other is differential refraction, the wavelength dependent centroid shift, which must be considered in fine astrometric work (e.g. Binnendijk 1960).
An order of magnitude estimate of the parallax can be made for a typical thick disk star with the transverse velocity km/s. We have , and then . This effect is therefore rather small, nevertheless it could be seen in some of our cases and is worth considering. In a general field a close star will revolve around the ellipse in the reference frame of distant stars, for which the parallax is negligible. The ellipse is determined by the ecliptic coordinates of the star and the motion should obviously have a one year period. Interestingly, the Galactic bulge (Sagittarius: , ) lies almost on the ecliptic at , in the ecliptic system. In this case the parallactic ellipse is strongly flattened and the ecliptic longitude component dominates (Binnendijk 1960). Furthermore because the ecliptic is nearly parallel to the celestial equator there and the CCD chip is aligned with the axes of the equatorial system, the expected centroid shifts in our data are much stronger in direction than in ( vs. ). Also, the best time of the year to observe the bulge is near its opposition with respect to the Sun, which means that the extrema of the parallactic displacement will be poorly covered by observations, in particular by observations under good seeing conditions and at low zenith angles .
Differential refraction decreases the apparent zenith angle of the observed object by the amount which depends on the color of the object. Because of the wavelength dependence of the atmospheric refractive index, the images of stars are in fact short spectra with the dispersion axis directed towards the zenith, and therefore blue objects are affected more. For general theory see e.g. Kovalevsky (1995). Alcock et al. (1999) discussed the effect in the context of the DIA photometry on MACHO images. The MACHO blue filter is sufficiently broad that the refraction alone is capable of producing wavy residuals in difference frames and substantially increasing the photometric scatter. In case of the MACHO data a statistical correction was applied using color maps of each field. However it should be stressed that for individual cases with locally atypical colors this correction cannot work, and may even have wrong sign. The only way around this problem is the use of narrow filters. In MACHO red band data the situation is dramatically better (Alcock et al. 1999) and in our band data with the standard Johnson-Kron-Cousins filter the effect is very small. Nevertheless the quality of the centroid for =11–13 mag stars in OGLE images is sufficiently good to reveal the influence of the color on the apparent position, and we include in the model the color dependent term linear in . The projected shift in equatorial coordinates , changes with the zenith angle and hour angle. Somewhat unexpectedly, an asymmetry arises here. In relatively large part of the sky around the meridian the shift in has null time derivative, while the shift in is proportional to hour angle and dominates. Also the sign of the shift in depends on whether we look east or west, which results in unfavorable correlation with time of the year, despite the fact that the zenith angle is uncorrelated with date in the observing strategy adopted by OGLE. This explains a cumbersome coupling between refraction and parallax (Section 3.2).
3. Results
3.1. Selection criteria
We start by selecting all close couples in the database of candidate variables of Woźniak (2000). We only select couples in which the two components have light curve slopes of the opposite sign. It is also required that the absolute value of the ratio of the two slopes is between 0.1 and 10.0. The significance of the slope is assessed using the Student test. There were 99 couples separated by less than 4.5 pixels with less than 0.01 probability of insignificant slope in any of the components. There is a small gap in the distribution of separations around 4–5 pixels, and there are no interesting cases at higher separations. The next step is an attempt to detect the HPM star near the middle position between both (spurious) stars of the pair. After measuring positions with respect to the neighboring stars at all possible epochs, we perform the Fisher test comparing models with and without the proper motion. Parallax and refraction are not considered at this point. In the final sample we admit 74 stars with less than 1 per thousand probability that the fit improvement with the addition of proper motion is not significant. For these candidates we fit the full model including parallactic motion and refraction. Table Photometric detection of high proper motions in dense stellar fields using Difference Image Analysis contains magnitudes and fitted proper motions of stars which passed all criteria. In Figure 4 we show the two dimensional distribution of fitted proper motions. Total proper motions typically range from 4 mas yr-1 to 60 mas yr-1.
3.2. Model fits and sensitivity
Figure 5 presents the data and the model for a star with clearly detected proper motion. We made sure that most stars do not show similar trends; 4 examples can be found in Figure 6. For the purpose of this preliminary announcement we neglect the fact that the mapping between the template frame coordinates and the equatorial system may be locally warped. This hardly affects any of our conclusions. Typical scatter around the fit to the coordinate transformation between OGLE-II frames is about 0.06 pixels () in each coordinate (Woźniak 2000). Stars in our HPM sample are on average brighter than stars used to match pixel grids in the DIA pipeline and have r.m.s. position uncertainty of about 0.03 pixels (). In principle we should be able to detect some stars with measurable parallaxes. However, as discussed in Section 2.2, the influence of differential refraction is correlated with the date of observation and results in the fitting degeneracy between the parallax and the refraction. Additionally, we observe systematic residuals in our fits at 1 level, suggesting changes in the state of the atmosphere in the observed direction between the beginning and the end of the season. This could be due to either seasonal effects or differing air conditions towards the land and towards the ocean. Because refraction dominates the residuals after the effects of proper motion are taken out, we cannot report convincing parallax values. Nevertheless, the measured proper motion agrees quite well with the predictions of Equation 2, as demonstrated in Figure 7. Keeping in mind that the photometric estimate for in Equation 2 depends on seeing, (FWHM), we get surprisingly good information about the direction and magnitude of from fixed centroids and light curves of both components of the dipole residual, without a single actual positional measurement. Figure 8 confirms that the fitted amplitude of the refractive displacement is, indeed, well correlated with the (uncallibrated) color of the star. This relation could be used in the future for calculating rather than fitting the displacement due to refraction.
In our search almost all discovered HPM stars have magnitudes between 12 and 14, which suggests that the present method is not sensitive to faint objects, although the full range of colors is covered. Drake et al. (2001) report discoveries all the way to using a different method based on regular PSF photometry, but they also mention that in five years of data the lower limit on detectable proper motion was about 30 mas yr-1. They find 154 stars in the area of 50 square degrees. We see numerous good detections below 30 mas yr-1 in 3 years of observations of square deg, suggesting that the two approaches cover different parts of the parameter space. It should be also pointed out that the reference image composed of frames from a broad range of epochs is not optimal for this kind of work. It tends to wash out the signal by stretching the reference PSF of the moving star. Without modifications our method will not be capable of discovering stars with very high proper motions, which quickly move 2FWHM away from the location on the reference image and produce entirely different ”light curves”.
4. Discussion and future perspectives
The effects of the centroid shift in difference image photometry for BUL_SC1 OGLE field appeared as a serendipity phenomenon. We propose to use this clear signature to detect HPM stars in very crowded fields. In its present version described here, the method is insensitive to very high proper motions, however the potential for improvement is great. With the suitable selection of difference images obtained from a series of observations covering sufficiently long base line, it should be possible to achieve much better efficiency and expand the range of detectable . Perhaps the use of light curves in the detection process can be eliminated altogether, and one should concentrate on preparation of good combined reference frames around a number of epochs along the whole observing sequence. Difference frames between epochs separated by various time intervals will reveal the same type of dipole-like residual near stars with broad range of velocities.
The OGLE survey, and other photometric surveys, offer thus promising astrometric results. Methods like ours, or the one used by Drake et al. (2001) for the MACHO data, make it possible to filter out HPM stars out of millions of constant stars in crowded fields with very little extra effort. Crowding practically prevented conventional astrometric surveys like NLTT (New Luyten Two Tenths catalogue) from detecting stars in the Galactic bulge. It is generally depleted around . NLTT goes down to the photographic magnitude , but has a detection limit of about 180 mas yr-1. In a small area we found 37 stars with proper motions between 10 and 80 mas yr-1. Tentative predictions for OGLE-II as a whole can be made. There are 4 observing seasons and 49 Bulge fields. All these fields will be reduced by the DIA pipeline (Woźniak 2000), and we could therefore expect the determination of more than 1500 proper motions from the OGLE-II bulge data alone without any software modifications. It is likely that after fine tuning the technique will return significantly larger sample of HPM stars.
The possibility that large numbers of HPM stars in crowded fields may be known within 1–2 years has interesting implications for some proposed experiments to detect astrometric microlensing. The cross section for astrometric displacement falls off as the impact parameter to power, much slower than power in case of the photometric disturbance (Miralda-Escudé 1996 and references therein). Paczyński (1996b) showed that high proper motion stars should within a reasonable time cause predictable microlensing events. In case of closest moving lenses and much fainter than the source (contrast can be increased with the proper filter), the astrometric shift could be measured with the HST and would provide a direct determination of the lens mass. Some of the local lenses could be white or brown dwarfs. Of course with the 1 as accuracy of the Space Interferometry Mission (SIM) a lot more is possible. The described experiment using SIM would provide up to 1% accuracy in the mass determination (Paczyński 1998). Another possibility discussed by Paczyński (1998) is the determination of stellar radii (or equivalently effective temperatures) from microlensing events which are astrometric and have resolved sources due to very low impact parameter. According to SIM specification, the degeneracy between physical microlensing parameters can be broken for events out to the distance of the Galactic bulge and even LMC and SMC, provided that they are both astrometric and photometric (e.g. Paczyński 1998). Gould (2000a) proposed to measure the mass function of stellar remnants in the Galactic bulge. Samir & Gould (2000) and Gould (2000b) discuss the selection of candidate objects for SIM. The method proposed here would greatly extend the list of possible targets.
References
- (1) Alard, C., & Lupton, R.H., 1998, ApJ 503, 325
- (2) Alard, C., 2000, A&AS, 144, 363
- (3) Alcock, C. et al. (MACHO collaboration), 1999, ApJ 521, 602
- (4) Binnendijk, L., 1960, Properties of Double Stars (Philadelphia, PA: University of Pennsylvania Press)
- (5) Drake, A. et al. (MACHO collaboration), 2001, BAAS, 32, 1391
- (6) Gould, A., 2000a, ApJ, 532, 936
- (7) Gould, A., 2000b, ApJ, 535, 928
- (8) Kovalevsky, J., 1995, Modern Astrometry (Berlin, Heilderberg, Germany: Springer-Verlag)
- (9) Luyten, W. J., 1979, 1980, New Luyten Catalogue of Stars with Proper Motions Larger than Two Tenths of an Arcsecond (Minneapolis: University of Minnesota)
- (10) Miralda-Escudé, J., 1996, ApJ, 470, L113
- (11) Paczyński, B., 1996a, ARA&A, 34, 419
- (12) Paczyński, B., 1996b, Acta Astron., 46, 291
- (13) Paczyński, B., 1998, ApJ, 494, L23
- (14) Samir, S., & Gould, A., 2000, ApJ, 539, 241
- (15) Schechter, P. L., Mateo, M. L., & Saha, A., 1995, PASP, 105, 1342
- (16) Udalski, A., Kubiak, M., & Szymański, M., 1997, Acta Astron., 47, 319
- (17) Udalski, A., Żebruń, K., Szymański, M., Kubiak, M., Pietrzyński, G. Soszyński, I., Woźniak, P. R., 2000, Acta Astron., 50, 1
- (18) Woźniak, P.R., 2000, Acta Astron., in press, astro-ph/0012143


| Star | †† | ||||||||
|---|---|---|---|---|---|---|---|---|---|
| ID | mag | mas yr-1 | |||||||
| 21 - 22 | 14.13 | 18:02:25.23 | 30:25:09.1 | 7.0 | 2.0 | 2.2 | 1.9 | 7.3 | 2.7 |
| 95 - 110 | 14.17 | 18:02:25.70 | 30:24:25.1 | 5.3 | 2.7 | 15.0 | 2.6 | 15.9 | 3.8 |
| 121 - 133 | 13.94 | 18:02:38.63 | 30:24:40.3 | 3.5 | 1.3 | 5.6 | 1.3 | 6.6 | 1.9 |
| 171 - 172 | 14.24 | 18:02:24.59 | 30:23:22.4 | 10.2 | 1.9 | 2.7 | 1.9 | 10.6 | 2.7 |
| 187 - 198 | 14.24 | 18:02:34.98 | 30:23:49.6 | 4.3 | 2.5 | 15.1 | 2.5 | 15.7 | 3.6 |
| 290 - 291 | 13.13 | 18:02:05.40 | 30:22:11.9 | 5.1 | 1.4 | 6.6 | 1.4 | 8.3 | 1.9 |
| 348 - 357 | 13.79 | 18:02:54.88 | 30:22:00.1 | 7.7 | 0.8 | 1.2 | 0.8 | 7.8 | 1.2 |
| 360 - 384 | 13.63 | 18:02:00.94 | 30:21:12.6 | 5.4 | 1.9 | 5.1 | 1.9 | 7.5 | 2.7 |
| 371 - 372 | 13.39 | 18:02:11.32 | 30:20:53.6 | 4.0 | 1.0 | 0.5 | 1.0 | 4.0 | 1.4 |
| 376 - 377 | 13.46 | 18:02:12.99 | 30:20:55.5 | 0.4 | 1.5 | 10.2 | 1.5 | 10.2 | 2.1 |
| 382 - 450 | 12.87 | 18:02:15.31 | 30:20:37.7 | 17.8 | 1.5 | 9.7 | 1.5 | 20.3 | 2.1 |
| 458 - 459 | 15.08 | 18:02:19.86 | 30:19:54.2 | 2.9 | 1.2 | 64.8 | 1.2 | 64.8 | 1.7 |
| 513 - 514 | 13.81 | 18:02:06.58 | 30:19:21.3 | 8.4 | 1.6 | 2.4 | 1.6 | 8.7 | 2.2 |
| 519 - 520 | 13.93 | 18:02:14.07 | 30:19:39.9 | 9.1 | 1.5 | 1.0 | 1.5 | 9.2 | 2.1 |
| 624 - 625 | 13.93 | 18:02:51.27 | 30:18:28.1 | 4.8 | 6.5 | 25.8 | 6.4 | 26.2 | 9.1 |
| 628 - 637 | 12.44 | 18:02:52.52 | 30:18:24.0 | 11.3 | 1.8 | 5.3 | 1.7 | 12.5 | 2.5 |
| 630 - 631 | 11.67 | 18:02:53.84 | 30:18:01.5 | 9.4 | 1.0 | 18.7 | 1.0 | 21.0 | 1.4 |
| 664 - 665 | 14.06 | 18:02:21.70 | 30:17:18.1 | 0.8 | 1.7 | 0.1 | 1.7 | 0.8 | 2.4 |
| 670 - 677 | 12.88 | 18:02:40.40 | 30:17:57.9 | 2.9 | 1.2 | 4.5 | 1.2 | 5.3 | 1.7 |
| 749 - 750 | 13.30 | 18:02:47.71 | 30:16:42.1 | 2.5 | 1.6 | 3.4 | 1.5 | 4.2 | 2.2 |
| 804 - 805 | 14.60 | 18:02:19.13 | 30:15:25.0 | 1.2 | 1.4 | 13.6 | 1.3 | 13.6 | 1.9 |
| 809 - 824 | 13.49 | 18:02:34.47 | 30:15:36.9 | 33.2 | 5.1 | 4.9 | 5.0 | 33.5 | 7.2 |
| 820 - 821 | 13.91 | 18:02:44.46 | 30:16:04.6 | 4.1 | 1.0 | 17.9 | 0.9 | 18.3 | 1.3 |
| 840 - 841 | 13.01 | 18:03:02.38 | 30:16:11.3 | 0.8 | 1.4 | 6.2 | 1.3 | 6.2 | 1.9 |
| 896 - 906 | 12.86 | 18:02:59.46 | 30:14:58.0 | 10.9 | 1.3 | 2.4 | 1.3 | 11.2 | 1.9 |
| 977 - 978 | 14.42 | 18:02:02.96 | 30:13:31.3 | 2.3 | 1.3 | 7.4 | 1.3 | 7.7 | 1.8 |
| 1012 - 1013 | 12.91 | 18:02:35.04 | 30:13:11.4 | 8.4 | 2.1 | 8.6 | 2.0 | 12.0 | 2.9 |
| 1065 - 1071 | 13.92 | 18:02:12.81 | 30:12:14.0 | 9.5 | 1.2 | 5.2 | 1.2 | 10.9 | 1.7 |
| 1107 - 1108 | 14.03 | 18:02:45.14 | 30:12:02.4 | 3.0 | 1.7 | 11.4 | 1.7 | 11.8 | 2.4 |
| 1203 - 1204 | 13.71 | 18:02:58.57 | 30:11:32.3 | 25.6 | 1.3 | 78.4 | 1.3 | 82.5 | 1.8 |
| 1351 - 1359 | 13.37 | 18:02:25.10 | 30:08:30.7 | 2.2 | 1.0 | 6.8 | 1.0 | 7.2 | 1.4 |
| 1379 - 1380 | 13.55 | 18:02:55.46 | 30:08:51.2 | 4.1 | 1.3 | 41.0 | 1.3 | 41.2 | 1.9 |
| 1410 - 1411 | 14.51 | 18:02:18.69 | 30:07:24.1 | 5.4 | 1.0 | 2.4 | 1.0 | 5.9 | 1.4 |
| 1538 - 1539 | 13.00 | 18:02:25.94 | 30:06:01.5 | 4.1 | 1.0 | 5.8 | 1.0 | 7.1 | 1.4 |
| 1592 - 1593 | 14.19 | 18:02:08.53 | 30:05:23.1 | 2.9 | 0.9 | 2.3 | 0.9 | 3.7 | 1.3 |
| 1690 - 1697 | 12.55 | 18:02:31.27 | 30:04:36.2 | 0.7 | 1.5 | 2.2 | 1.5 | 2.3 | 2.1 |
| 1751 - 1752 | 14.06 | 18:02:09.44 | 30:03:34.0 | 6.6 | 1.1 | 1.5 | 1.1 | 6.7 | 1.5 |
| 1773 - 1787 | 12.80 | 18:02:41.77 | 30:03:04.0 | 11.1 | 1.8 | 5.8 | 1.8 | 12.6 | 2.6 |
| 1858 - 1859 | 14.02 | 18:02:39.34 | 30:02:16.8 | 3.1 | 1.8 | 4.8 | 1.8 | 5.7 | 2.5 |
| 1873 - 1874 | 13.55 | 18:02:59.58 | 30:02:48.0 | 10.9 | 1.1 | 25.2 | 1.1 | 27.5 | 1.6 |
| 1880 - 1887 | 14.56 | 18:03:04.10 | 30:02:58.6 | 6.6 | 2.2 | 27.8 | 2.1 | 28.6 | 3.0 |
| 1901 - 1910 | 13.54 | 18:02:21.52 | 30:01:26.9 | 8.2 | 1.0 | 0.9 | 1.0 | 8.2 | 1.4 |
| 1986 - 1998 | 13.39 | 18:02:49.91 | 30:01:06.4 | 1.9 | 1.4 | 1.9 | 1.4 | 2.7 | 1.9 |
| 2064 - 2065 | 13.58 | 18:02:04.65 | 29:59:15.7 | 4.3 | 1.2 | 10.9 | 1.2 | 11.7 | 1.6 |
| 2071 - 2077 | 14.02 | 18:02:14.85 | 29:58:52.9 | 7.9 | 1.4 | 12.2 | 1.3 | 14.5 | 1.9 |
| 2157 - 2158 | 13.70 | 18:02:28.13 | 29:58:01.5 | 0.4 | 1.2 | 8.6 | 1.2 | 8.6 | 1.7 |
| 2247 - 2257 | 13.41 | 18:02:33.95 | 29:57:07.3 | 2.6 | 1.1 | 7.4 | 1.0 | 7.8 | 1.5 |
| 2255 - 2256 | 12.49 | 18:02:46.23 | 29:57:27.2 | 6.0 | 0.9 | 0.4 | 0.8 | 6.1 | 1.2 |
| 2391 - 2397 | 14.24 | 18:02:31.45 | 29:55:26.6 | 9.3 | 1.8 | 8.2 | 1.8 | 12.4 | 2.5 |
| 2525 - 2526 | 13.50 | 18:02:22.84 | 29:54:06.9 | 4.5 | 0.9 | 2.7 | 0.9 | 5.3 | 1.3 |
| 2606 - 2607 | 13.95 | 18:02:34.76 | 29:52:38.3 | 3.1 | 1.2 | 13.4 | 1.2 | 13.7 | 1.7 |
| 2638 - 2639 | 14.12 | 18:03:04.01 | 29:52:42.7 | 20.5 | 2.3 | 16.2 | 2.1 | 26.2 | 3.1 |
| 2677 - 2678 | 14.90 | 18:02:20.02 | 29:51:37.3 | 13.0 | 1.4 | 4.9 | 1.4 | 13.9 | 2.0 |
| 2806 - 2816 | 13.51 | 18:02:37.58 | 29:49:51.2 | 7.6 | 1.0 | 6.0 | 1.0 | 9.7 | 1.4 |
| 2988 - 2989 | 13.96 | 18:02:38.11 | 29:48:42.7 | 8.8 | 1.5 | 3.7 | 1.4 | 9.5 | 2.1 |
| 3287 - 3300 | 15.09 | 18:02:23.29 | 29:44:30.6 | 17.2 | 1.8 | 24.5 | 1.7 | 29.9 | 2.5 |
| 3378 - 3383 | 13.88 | 18:02:29.35 | 29:44:11.4 | 3.9 | 1.2 | 1.9 | 1.2 | 4.3 | 1.7 |
| 3387 - 3388 | 13.12 | 18:02:34.95 | 29:43:46.8 | 16.8 | 1.4 | 8.8 | 1.4 | 18.9 | 2.0 |
| 3454 - 3455 | 13.28 | 18:02:41.66 | 29:43:13.5 | 7.7 | 1.3 | 1.0 | 1.3 | 7.8 | 1.8 |
| 3501 - 3507 | 12.92 | 18:02:13.76 | 29:42:04.6 | 2.4 | 1.4 | 3.2 | 1.4 | 4.0 | 2.0 |
| 3667 - 3668 | 14.22 | 18:02:11.55 | 29:40:42.5 | 7.3 | 1.1 | 12.3 | 1.1 | 14.3 | 1.6 |
| 3670 - 3678 | 14.94 | 18:02:13.00 | 29:40:11.9 | 16.5 | 1.9 | 5.0 | 1.8 | 17.2 | 2.6 |
| 3742 - 3750 | 13.93 | 18:02:11.69 | 29:40:00.8 | 5.6 | 1.4 | 7.1 | 1.4 | 9.0 | 2.0 |
| 3743 - 3744 | 12.74 | 18:02:13.61 | 29:39:18.2 | 62.6 | 1.2 | 23.6 | 1.2 | 66.9 | 1.7 |
| 3812 - 3813 | 11.80 | 18:02:19.07 | 29:38:32.9 | 22.1 | 2.0 | 16.2 | 1.9 | 27.4 | 2.8 |
| 3855 - 3866 | 13.06 | 18:02:59.69 | 29:38:30.8 | 5.9 | 1.3 | 3.7 | 1.3 | 6.9 | 1.8 |
| 3893 - 3903 | 14.31 | 18:02:22.18 | 29:37:38.0 | 4.2 | 1.4 | 8.3 | 1.4 | 9.3 | 2.0 |
| 3950 - 3951 | 14.16 | 18:02:07.51 | 29:36:34.4 | 1.9 | 1.1 | 6.6 | 1.1 | 6.8 | 1.6 |
| 3961 - 3970 | 13.75 | 18:02:31.02 | 29:36:31.7 | 3.6 | 1.4 | 7.8 | 1.4 | 8.6 | 1.9 |
| 4003 - 4009 | 13.63 | 18:03:04.18 | 29:37:18.4 | 11.8 | 1.9 | 5.2 | 1.8 | 12.8 | 2.6 |
| 4066 - 4067 | 13.96 | 18:02:53.60 | 29:35:51.6 | 1.2 | 1.4 | 24.7 | 1.4 | 24.7 | 1.9 |
| 4262 - 4263 | 13.80 | 18:02:23.86 | 29:33:35.0 | 13.3 | 1.4 | 3.5 | 1.4 | 13.8 | 2.0 |
| 4304 - 4306 | 13.09 | 18:02:47.36 | 29:33:02.5 | 6.7 | 1.4 | 0.2 | 1.4 | 6.7 | 2.0 |
| 4479 - 4480 | 14.52 | 18:03:01.24 | 29:31:53.3 | 3.6 | 1.6 | 9.7 | 1.6 | 10.3 | 2.2 |