Galactosynthesis Predictions at High Redshift
Abstract
We predict the Tully-Fisher (TF) and surface-brightness–magnitude relation for disk galaxies at and discuss the origin of these scaling relations and their scatter. We show that the variation of the TF relation with redshift can be a potentially powerful discriminator of galaxy-formation models. In particular, the TF relation at high redshift might be used to break parameter degeneracies among galactosynthesis models at , as well as to constrain the redshift distribution of collapsing dark-matter halos, the star-formation history and baryon fraction in the disk, and the distribution of halo spins.
keywords:
cosmology: theory — galaxies: formation — galaxies: spiral — galaxies: kinematics and dynamics1 Introduction
With the advent of numerous 10m-class telescopes, adaptive optics, and high- galaxy surveys, it is becoming possible to learn about the detailed properties of galaxies at high . In the future, we may expect improved IR sensitivity with NGST and 30m or even 100m telescopes, and this should usher in an era of high-precision kinematic and photometric studies of high- galaxies. Disk galaxies are particularly important to our understanding of galaxy formation and evolution, as they are believed to undergo a relatively smooth formation process, and possibly serve as building blocks in the formation of other galactic systems through mergers.
Many authors have investigated galactosynthesis models (e.g., ?; ?; ?; ?; ?; ?; ?; ?) in which the properties of disk galaxies are determined primarily by the mass, size, and angular momenta of the halos in which they form, and which may contain the effects of supernova feedback, adiabatic disk contraction, cooling, merging, and a variety of star-formation (SF) recipes. In an earlier paper, we (?; hereafter BJK), investigated a variety of galactosynthesis models with realistic stellar populations and made multi-wavelength predictions for the Tully-Fisher (TF) relation. With reasonable values for various cosmological parameters, spin () distributions, formation-redshift () distributions, and no supernova feedback, we could produce an excellent fit to the local TF relation at all investigated wavelengths (, , , and ), as well as to -band TF data at , and to the surface-brightness–magnitude (-) relation locally and at . These successes suggest that our simplified approach captures the essential phenomenology, even if it leaves out some of the details of more sophisticated models.
In this paper, we investigate the high- TF predictions for our model. We examine the key factors impacting the TF relation at high , and demonstrate that degeneracies among parameters in galactosynthesis models at can be disentangled at high . Specifically, information about the and distributions, as well as the SF history and baryon fraction in the disk, can be gleaned from the high- TF relation.
2 The Models
Here, we briefly review the main ingredients of our model and refer the interested reader to BJK for a comprehensive description. We use the spherical-collapse model for halos, the distribution of halo-formation times from the merger-tree formalism (?; ?), and a joint distribution in and , the peak height (?; ?). Halos are treated as isothermal spheres with a fixed baryon fraction and specific angular momentum, and their embedded gaseous disks, assumed to form at virialization, have an exponential density profile. We implicitly assume that the halos of spiral galaxies form smoothly, rather than from major mergers (BJK; ?). An empirical Schmidt law relates the star-formation rate (SFR) to the disk surface density (?). A Salpeter initial mass function, a prescription for chemical evolution, and a synthetic stellar-population code (?) provide the photometric properties of disks at any .
The model is defined by cosmological parameters and by the time when the most massive progenitor contains a fraction of the present-day mass, when a halo is defined to form. We found that excellent agreement with current data was obtained by our ’Model A’, a COBE-normalized CDM cosmogony (, , ) with . The TF relation in this model relied on both halo properties and SF in the disk. The local TF scatter arose primarily from the distribution, and secondarily from chemical evolution and the - anticorrelation. In this model, disk formation occurs primarily at and the TF slope steepens and the zero points get fainter from to . Moreover, the amount of gas expelled from or poured into a disk galaxy in this model is relatively small and the disk and halo specific angular momenta are equal.
A suite of other models that give good fits to the observations at low , can also be found. To illustrate, we examine two alternatives that yield comparably good fits to the slope, zero-point, and scatter of the TF relation at in , , , and . The first is a CDM model with , , constant metallicity given by the solar value, for all disks, a power-spectrum amplitude , an empirical shape parameter , and . High- models generally produce disk galaxies too faint to lie on the local TF relation. To compensate for this, we assume , and thus term this the ’high-’ model.
Our second alternative is a CDM cosmogony like Model A, but with metallicity held constant at the solar value, for all disks, and . This results in a narrow distribution of formation times peaked around (for -type disks), with appreciable ongoing formation today and almost no halos forming earlier than (cf., Figure 1 of BJK). We thus denote this the ’low-’ model. This model will produce extremely young and bright disks (cf., Figure 5 of BJK)111We note that bulges, however, may be present at high .. To compensate for this, we reduce the efficiency of SF in our Schmidt-law prescription by 50% [see equations (2)–(4) in BJK]. This lower SF efficiency is plausible given a possible inconsistency between the Model-A predictions for the absolute disk gas fractions and those observed (see BJK for details).
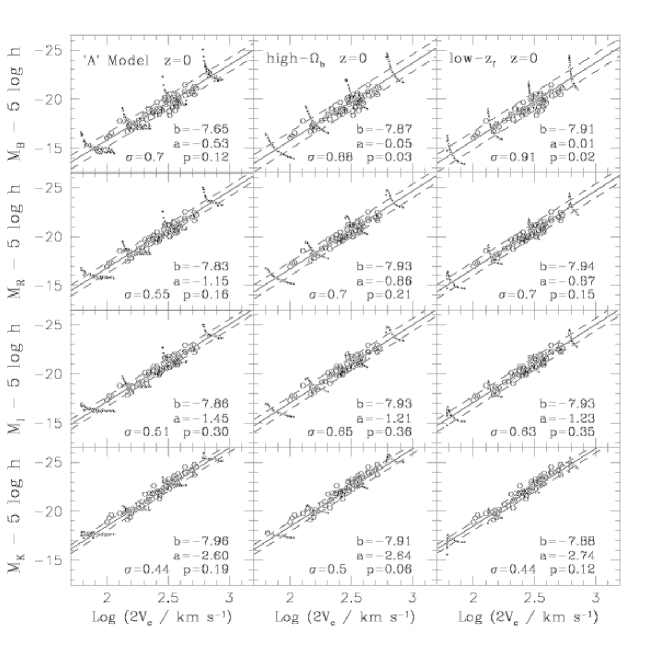
Figure 1 depicts the predictions for the A, high-, and low- models, in the , , , and bands. The open symbols represent extinction-corrected data from ?. In each plot, the data are fit to the corresponding model, and gives the probability for the data given the model. Since the data have excluded spirals that show evidence of merger activity or disruption, we exclude from our predictions those galaxies with .
Each of the three models yields a reasonable fit to the slope and normalization of the TF relation in all wavebands. Moreover, the predicted scatter in the , , , and bands roughly agrees with the observed values of 0.50, 0.41, 0.40, and 0.41, respectively, with the largest discrepancies occurring in the bluer bands, for reasons discussed in BJK.
3 The TF Relation at High
3.1 TF Scatter for a Fixed Mass

Figure 2 shows predictions for our A and high- models at . At this , the low- model fails to form disks. In the left-hand panels, the points for a given mass scatter in a nearly vertical direction in contrast to the more horizontal scatter in the results (see BJK Figure 13), particularly in redder bands. For , the TF scatter arises primarily from the spread in , with the earliest-forming objects of a fixed mass having higher circular velocities. This is because for an evolved galaxy that has converted most of its gas to stars, the light from giants serves as a faithful tracer of the total mass, regardless of the precise age of the galaxy. As one goes either to higher masses in a given waveband, or to bluer bands at a fixed mass, the scatter in the local TF relation for a fixed mass does begin to curve upward (i.e., later-forming disks appear brighter) to form a ’magnitude peak,’ since in both cases one becomes increasingly biased towards younger, brighter systems.
At , the scatter still owes mainly to the spread in , and Figure 2 still indicates that at , the very earliest-forming objects do possess somewhat higher circular velocities for a given mass. (Note in the left panels the ’peak’ of points formed at the high- end of the four scatter plots for the different masses.) The galaxies that populate the TF relation at , however, are the small minority that constitute the exponentially decaying high- tail of the adopted distribution (BJK Figure 1). Thus, the formation of these halos spans a very short epoch, so that halos of a given mass will have roughly the same , resulting in the tight horizontal scatter for each mass. The large vertical scatter arises from the fact that, though these galaxies will eventually form the lower envelope of the present-day TF relation, comprising the oldest and (in bluer bands) faintest objects of a given mass, at even the least massive of these galaxies are typically no older than a few hundred million years, and the more massive systems younger still. Thus, systems on the ’young’ side of the peak have formed so close to the epoch of observation that they simply have not had sufficient time to build up appreciable stellar populations; given their high gas fractions and SFRs, even a small increase in their age results in a substantial increase in their stellar luminosity.
At high , disks with circular velocities 200–500 km s-1 (masses ) correspond to rare fluctuations. Still, at these , one does expect to find several such objects within the horizon in a CDM cosmogony, and since these will be the brightest objects in the sample, we include them in the discussion here. We also reiterate that the disks that form at are not the dominant population of disks at , as most disks at probably formed at (see, e.g., BJK). Disks forming at higher will delineate the lower envelope of the TF relation at ; for a given mass, these older, higher- systems will be fainter since they will be the first to run out of fuel.
3.1.1 Overall TF Relation
The trend of steeper TF slopes and fainter zero-points in going from to is seen to continue here out to . Specifically, in the band, the TF relation goes from mag brighter than its local counterpart at to less than 1 mag brighter at . In , the high- prediction is about 1 mag fainter at and comparable to the local prediction at . This is because for fixed , halos at high will be younger, smaller, and have lower than halos today. In massive systems most of the SF activity takes place at early times. Thus, younger systems will be significantly brighter, particularly in bluer bands, even though much of their gas remains unprocessed. Smaller, low- systems, on the other hand, do not convert gas to stars as rapidly and are thus fainter than their local counterparts.
The overall A-model -band scatter in the high- TF relation is comparable to that at . In , however, the scatter at has increased by a factor of two. Moreover, the variation in the TF scatter among different wavebands is not as great at high as was seen in the local case. This is because (a) disks at are likely to be in a starburst-dominated phase since there is very little cosmological time for even single stellar populations to decay; (b) at such early times the spread in mass of gas turned into stars is very large for different and [see eq. (7) of ?]. Therefore, it seems natural that all bands reflect the maximum possible spread. By contrast, there is little change in TF scatter from to , as the majority of galaxies are sufficiently evolved by (Figures 13 and 14 in BJK). Furthermore, the scatter obtained here should be considered as an upper limit since, in practice, -limited surveys may not detect arbitrarily young, and therefore faint, objects, particularly at lower masses.222Our models employ a minimum time step of yr—corresponding to the timescale for giant-molecular cloud destruction (e.g., ?)—that effectively dictates the faintest objects at a given mass, and therefore the maximum possible scatter. However, different realizations of a given model can generally produce results that vary by mag in the TF scatter. Given the simplifying assumptions of the model, attention should be paid to the overall magnitudes of and relative differences between the slopes, normalizations, and scatters, rather than their precise values.
3.1.2 Spin–Peak-Height (-) Anticorrelation
In BJK, we also noted the slight reduction in TF scatter at in Model A arising from the existence of a weak anticorrelation of with , and thus with . This reduction in TF scatter was only about 0.15 mag in and mag in for Model A, and lesser or no effect was seen in some other possibly viable models. To investigate the effect of the joint - distribution, we re-ran the models in Figure 2 with for all halos. This produces TF predictions with shallower slopes and brighter zero-points. This is due to the fact that the value is higher (lower) than the full model would typically assign to high-mass (lower-mass) galaxies, which thus become correspondingly fainter (brighter) in the fixed- model. More interestingly, using a fixed at high reduced the overall TF scatter by about 0.2 mag in all bands at , as compared with using the joint distribution in and . This is in direct contrast to the case, where a fixed produced a comparable or larger scatter, as described above. This is due to the vertical nature of the scatter in the TF for a fixed mass at high . In this case, higher- systems are still fainter, but their lower (already confined to only a narrow range) can only further scatter them to lower luminosities, not to lower as is in the local case, thereby increasing the scatter. This suggests that the scatter in the TF relation at high could be used to gauge the strength of the actual - anticorrelation.
3.2 The Surface-Brightness–Magnitude Relation
Figure 3 shows the surface-brightness–magnitude relation at and for the A and high- models, The dots are from 2dF (?), and the open triangles from the HDF (?); the latter have . Since our model does not include a bulge component, the predicted may underestimate observed values if the disk and bulge components cannot be resolved.
For Model A, the slope of the relation at is slightly shallower than the local relation, with nearly identical to the low- case for and fainter by about 1 mag for . Thus, at these scales, the trend towards higher luminosities and smaller disk scale lengths is offset by cosmological dimming. A more drastic contrast is seen in the high- model, where the predicted at the bright end varies by almost 4 magnitudes. This owes largely to substantial brightening that occurs at late times as the high baryon fraction is converted into starlight.
For both models, we find that the scatter at is much tighter than for the local case because the spread in the radii of disks at is smaller than at low . For example, at , disk sizes span a range roughly between 1 and 100 kpc, while at they range only from about 0.5 to 15 kpc in size. On the other hand, the respective spreads in differ by no more than a factor of two. The small spread in the relation then reflects the small spread in disk sizes predicted in our adopted structure-formation scenario. Thus, it will be interesting to learn whether this narrow spread is in fact observed at high . If a much wider spread is observed, this might indicate that either disks at are more substantially affected by merger activity or that they are simply larger; i.e., the spread in sizes predicted by our simple isothermal spherical-collapse model with angular-momentum conservation is simply too narrow. Note that the predictions in general are more sensitive to assumptions regarding than are TF predictions, thus providing a strong complementary constraint on this aspect of the model.

3.3 Addressing Possible Degeneracies
We now address how high- predictions can be used to distinguish among galactosynthesis models that are degenerate at . The right panels of Figure 2 show TF predictions for the high- model. At these mass scales, the low- model predicts essentially no disks (and thus no TF relation) to be present at , certainly a drastically different prediction than that of the other models, despite their close agreement at .
The precise slopes and zero-points for the A and high- models differ more appreciably than in the case, with the latter model yielding predictions that are significantly fainter at these scales. This owes both to the different normalizations of the fluctuation spectrum in the two models, and to the fact that the lower SF efficiency in the high- model results in fainter disks at early times. More importantly, the predicted TF scatter in the high- model is substantially less than that of the A model. This is because (a) a higher value of implies a narrower age range for disks forming at ; and (b) the scatter due to a spread in is excluded in this model.
Alternatively, one could envision a high- model in which disks were somehow brightened at later times, perhaps through late infall of fresh gas. In this case, there might be galaxies that are reasonably evolved, even at these high , so that many galaxies would be found on the old side of the peak. Thus, the TF scatter for a fixed mass for such objects would more closely resemble that of Figure 1, rather than the more vertically-oriented scatter of Figure 2, and presumably also lead to a smaller overall TF scatter. The differences among the high- predictions explored here for the TF relation and its scatter amount to about 1–2 mag, and 0.2–0.4 mag, respectively, so these models should be distinguishable with high significance given data of the type in Figure 1. The model predictions for the - relation can also be used to address the degeneracy. In Figure 3, we see that, owing to the large scatter, the two models are difficult to distinguish on the basis of low- predictions, but the tightness of the predicted relation at higher , if in fact observed, would make this test a much more powerful discriminator.
4 Discussion
We have presented high- predictions for the TF relation, which may help to discriminate among different scenarios for galaxy formation. The evolution of the spread in the TF relation can probe the spread in halo , as well as SF processes in the disk. Specifically, for observations of evolved systems at redder wavelengths, the scatter essentially decouples from the luminosity axis, while observations at high and/or in bluer bands are more sensitive to the disk’s age, resulting in a scatter that couples more closely to the luminosity axis of the TF relation. The predicted for a given are fainter and tighter at high than at low .
Our models assume that galaxies in the high- universe are those in the high- tail of the present-day distribution. The circular speeds we predict are those for the disk, and so far it has proven difficult to extract these reliably from general SF population at . Recent data seem to suggest that beyond the local universe, “normal” galaxies actively form stars primarily in their small cores (see, e.g., ?; ?). Linewidth measurements of SF galaxies at and are found to effectively sample only the core dispersion, yielding typical values of roughly 80 km s-1 with a scatter of about 20–30 km s-1 over a range of several magnitudes. Unless improved measurements can succeed in sampling the disk at larger radii (or at some other means of tracing the potential), a proper TF relation may not be easily defined.
Progress might be made by focusing on the lower, red envelope of the TF relation, rather than attempting to fill in the TF plane. The locus of the oldest and reddest points in the TF plane generally lie themselves on a well-defined line that serves as the high- envelope to the relation. Samples of these old, red objects might be easier to construct than complete TF samples, which include young, starbursting objects that may have arbitrarily low luminosities falling off on the younger side of the peak. SIRTF and NGST will have the sensitivity to detect some of the reddest objects in the sky, even out to high . If so, a comparison of the red envelope formed by these old objects with predictions, could suffice to constrain many of the key aspects of galactosynthesis models without needing to populate the entire TF plane. Of course, the effects of dust will need to be taken into account to so that young, dusty systems are distinguished from old galaxies.
We wish to acknowledge C. C. Steidel and K. A. Adelberger for helpful discussions. This work was supported by grants NSF-AST-0096023, NSF-AST-9900866, NSF-AST-9618537, NASA NAG5-8506, and DoE DE-FG03-92-ER40701.
References
- [Avila-Reese & Firmani¡2000¿] Avila-Reese V., Firmani C., 2000. Revista Mexicana de Astronomia y Astrofisica, 36, 23.
- [Buchalter, Jimenez & Kamionkowski¡2000¿] Buchalter A., Jimenez R., Kamionkowski M., 2000. astro-ph, 0006032.
- [Catelan & Theuns¡1996¿] Catelan P., Theuns T., 1996. MNRAS, 282, 455.
- [Dalcanton, Spergel & Summers¡1997¿] Dalcanton J. J., Spergel D. N., Summers F. J., 1997. ApJ, 482, 659.
- [Driver & Cross¡2000¿] Driver S. P., Cross N., 2000. astro-ph, 0004201.
- [Driver¡1999¿] Driver S. P., 1999. ApJL, 526, L69.
- [Eisenstein & Loeb¡1996¿] Eisenstein D. J., Loeb A., 1996. ApJ, 459, 432.
- [Firmani & Avila-Reese¡2000¿] Firmani C., Avila-Reese V., 2000. MNRAS, 315, 457.
- [Heavens & Jimenez¡1999¿] Heavens A. F., Jimenez R., 1999. MNRAS, 305, 770.
- [Heavens & Peacock¡1988¿] Heavens A. F., Peacock J. A., 1988. MNRAS, 232, 339.
- [Jimenez et al.¡1998¿] Jimenez R., Padoan P., Matteucci F., Heavens A. F., 1998. MNRAS, 299, 123.
- [Jimenez et al.¡2000¿] Jimenez R., Padoan P., Dunlop J. S., Bowen D. V., Juvela M., Matteucci F., 2000. ApJ, 532, 152.
- [Kennicutt¡1998¿] Kennicutt R. C., 1998. ApJ, 498, 541.
- [Lacey & Cole¡1993¿] Lacey C., Cole S., 1993. MNRAS, 262, 627.
- [Lacey & Cole¡1994¿] Lacey C., Cole S., 1994. MNRAS, 271, 676.
- [Mo, Mao & White¡1997¿] Mo H. J., Mao S., White S. D. M., 1997. MNRAS, 295, 319.
- [Navarro & Steinmetz¡2000¿] Navarro J. F., Steinmetz M., 2000. astro-ph, 0001003.
- [Rix et al.¡1997¿] Rix H., Guhathakurta P., Colless M., Ing K., 1997. MNRAS, 285, 779.
- [Simard & Pritchet¡1998¿] Simard L., Pritchet C. J., 1998. ApJ, 505, 96.
- [Somerville & Primack¡1999¿] Somerville R. S., Primack J. R., 1999. MNRAS, 310, 1087.
- [Tully et al.¡1998¿] Tully R. B., Pierce M. J., Huang J. S., Saunders W., Verheijen M. A. W., Witchalls P. L., 1998. AJ, 115, 2264.
- [van den Bosch¡2000¿] van den Bosch F. C., 2000. ApJ, 530, 177.