00 \SetFirstPage1 \SetYear2001 \ReceivedDate2000 May 26 \AcceptedDate2001 May 26
Romano’s star in M 33 - LBV candidate or LBV?
Presentamos la curva de luz de la estrella GR 290 (la estrella de Romano) candidata de LBV en la galaxia M 33. La fotometría se hizo con 22 placas fotográficas en banda de la galaxia M 33 obtenidas en el periodo 1982 – 1990. Presentamos tambien CCD fotometría. El análisis de nuestros datos junto con las magnitutes publicadas por Romano (1978) muestran erupciones ”normales” con amplituda de magnidude con escala de tiempo de años. Tambien se observa una variabilidad con amplituda de magnitudes y período de dias aproximadamente cual es el comportamiento tipico de los LBVs.
Abstract
We present the light curve of Luminous Blue Variable candidate star GR 290 (Romano’s star) in M 33. The photographic photometry was made in photographic plates taken in band of the M 33 galaxy and cover an eight year period, 1982 – 1990. Twenty five plates, separated in seven groups, have been used. CCD magnitude of the star is also presented. The analysis of our data together with the Romano’s magnitudes (1978) shows ”normal” eruptions with amplitude of more than mag and timescale of about years and smaller oscillations with amplitude mag and a period of about 320 days. This is a typical photometrical behavior for LBVs.
keywords:
stars: Luminous Blue Variables – photometric history – galaxies: individual: M33 – galaxies: Local Group – galaxies: stellar content0.1 Introduction
Luminous Blue Variables (LBVs) form a group of irregular variables characterized by their high intrinsic luminosities. LBVs are very short-lived phase of massive star evolution between core hydrogen burning O-type stars and helium-burning WR stars. LBV is a term coined by Conti (1984) that covers the S Dor variables, the Hubble-Sandage variables and the P Cygni variable stars. The distinctive characteristics of LBVs are the outbursts, circumstellar nebulae and typical spectral features. There are only 33 ”confirmed” and approx. 35 ”candidate” LBVs located in 10 galaxies. Reviews of LBVs can be found in Humphreys & Davidson (1994) and in Nota & Lamers, eds. (1997). The variabilities shown by the LBVs are of different amplitudes and time scales. There are giant eruptions with amplitudes greater than 2 mag but they are very rare, normal outbursts have amplitudes of 1 or 2 mag in the optical bands and time scales of years or tens of years. There are also smaller quasi-periodic oscillations (cyclicities) with amplitudes of about half a magnitude and microvariations of less than mag.
The original paper of Hubble & Sandage (1953) included four stars in M 33 (Vars. A, B, C and 2). All of them were distinguished by ”blue” color and irregular variability. Later, van den Bergh et al. (1975) added to this list Var 83. Romano (1978) discovered a variable star of Hubble-Sandage type close to the external spiral arm of M 33 designated as GR 290 (”Romano’s star” is more popular). This star is classified as LBV-candidate in Humphreys & Davidson (1994) due only to reason of variability.
| JD | JD | JD | JD | ||||||||
|---|---|---|---|---|---|---|---|---|---|---|---|
| 45286 | 17.16 | 0.15 | 45591 | 17.40 | 0.16 | 46707 | 17.46 | 0.16 | 48177 | 16.88 | 0.18 |
| 45295 | 17.25 | 0.15 | 45623 | 17.51 | 0.23 | 46707 | 17.51 | 0.16 | 48180 | 16.96 | 0.17 |
| 45296 | 17.19 | 0.23 | 45625 | 17.61 | 0.16 | 46708 | 17.30 | 0.07 | 48180 | 16.99 | 0.13 |
| 45297 | 17.24 | 0.25 | 45702 | 17.11 | 0.08 | 46708 | 17.52 | 0.10 | 48180 | 16.89 | 0.12 |
| 45588 | 17.35 | 0.23 | 45929 | 17.30 | 0.08 | 46709 | 17.49 | 0.08 | 51341⋆ | 17.35 | 0.03 |
| 45588 | 17.34 | 0.26 | 45968 | 17.38 | 0.09 | 46738 | 17.45 | 0.11 | |||
| 45590 | 17.55 | 0.20 | 46435 | 17.55 | 0.08 | 46738 | 17.32 | 0.17 |
⋆ – CCD magnitude (SAO 0.6-m telescope)
As an additional step in the process of confirmation or rejection of its LBV status, we follow the observational sequence of Romano (1978) and to see whether the star has shown any later outbursts and whether there is a periodicity in the light changes.
This photometric search is based on plates of M 33 from the collection of the Bulgarian National Astronomical Observatory (BNAO).
The observational material and the photometric measurement techniques are presented in section 2. In section 3 we present the light curve of Romano’s star, photometric behavior of residuals after removing the basic trend of magnitude, and a short discussion.
0.2 Observations and reductions
The analysis of light changes of Romano’s star is based on Romano’s observations, photographic observations with the 2 m Rozhen telescope and CCD observation with the 0.6-m telescope of SAO (Russia).
0.2.1 Photographic observations
A sample of photographic plates of M 33 from the collection of the Bulgarian National Astronomical Observatory – Rozhen was used. All plates have been taken with the 2 m RCC f/8 Rozhen reflector.
We used twenty five 30 30 cm -plates, (103aO, IIaO and ORWO ZU 21 emulsions, GG 385 glass filter). The plates were taken from November, 1982 to October, 1990. Julian days of observations and magnitudes of Romano’s star are presented in Table 1. The plate scale is 12.8 arcsec mm-1 and the area covered is 1∘ 1∘. The whole image of M 33 fits in each plate.
The measurements have been made with a MF-4 densitometer with a constant diaphragm at the Astronomical Observatory of the Sofia University. At least four estimations of sky background for each star were obtained and then an averaged value was used. The calibration curves have been constructed using the photoelectric sequence of Sandage & Johnson (1974). A variety of functions have been used to obtain the best fit of the data. For each plate standard deviations of measurements are presented in Table 1.
0.2.2 CCD observations
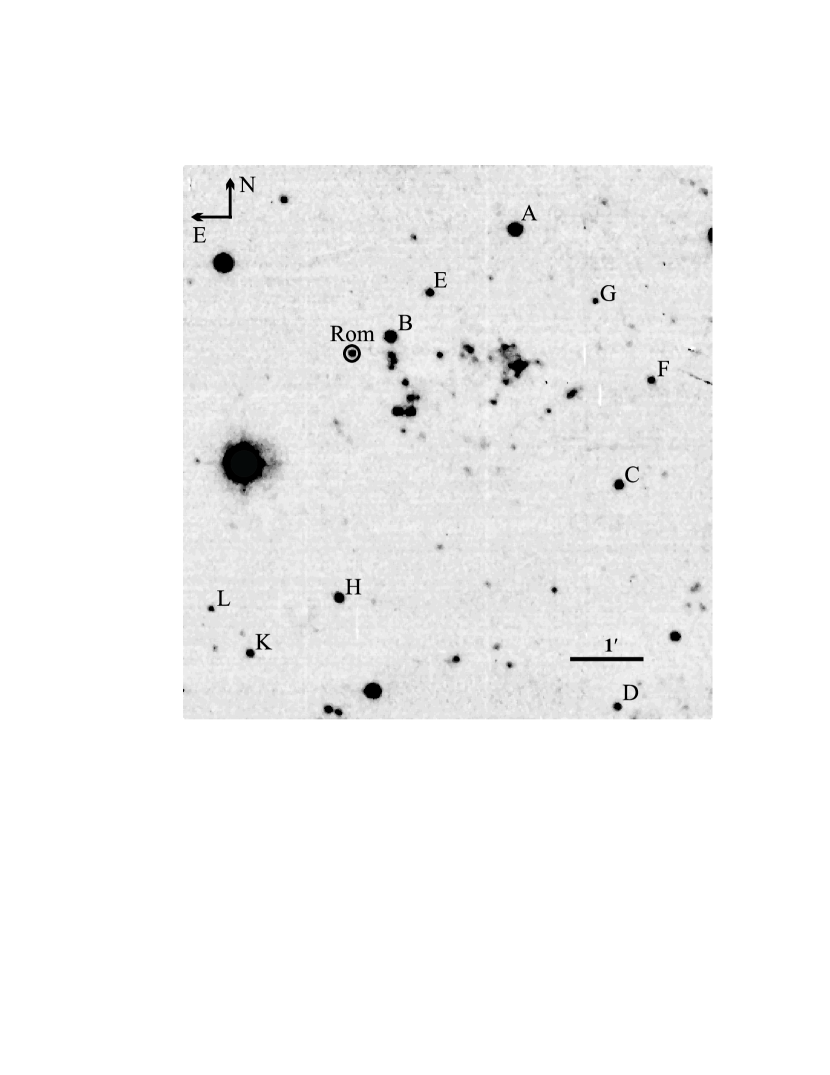
In Table 1 we present also CCD magnitude of Romano’s star. The data were obtained on June 21, 1999 with 525 600 CCD camera on the 0.6-m Zeiss telescope (Vlasiuk 1997) of the Special Astrophysical Observatory – SAO (Russia). A standard filter was used. The seeing during the observations was 2 – 3 arcsec. The scale was 0.84 arcsec/pixel, resulting in a field size of about 8 arcmin. The photometry of the program frame was carried out by PSF-fitting using IRAF/DAOPHOT. Transformation to the standard system is based on average photographic magnitudes of reference stars (A – L in Fig. 1) from the five best Rozhen plates. The average magnitudes and root mean squares (r.m.s.) for these stars are given in Table 2.
| St | R.M.S.(B) | St | R.M.S.(B) | ||
|---|---|---|---|---|---|
| A | 15.49 | 0.18 | F | 17.33 | 0.06 |
| B | 15.79 | 0.07 | G | 17.86 | 0.03 |
| C | 16.48 | 0.13 | H | 16.33 | 0.16 |
| D | 16.35 | 0.10 | K | 17.10 | 0.19 |
| E | 17.22 | 0.13 | L | 17.91 | 0.07 |
0.2.3 Reductions of the original Romano’s data to the Johnson system
The magnitudes of the variable star by Romano (1978) are obtained by visual comparison with the stars from the Hubble & Sandage (1953) sequence and are in the old system. In order to compare them with our data, Romano’s observations were transformed to the Johnson system. This transformation was based on the twelve common sequence stars of Hubble & Sandage (1953) and Sandage & Johnson (1974) – 15, 16, 19, A2, A4, A7, A10, A11, A12, A14, A16, and A17. The least squares fit gives:
with the fit standard error .

0.3 Periodogram analysis and results
The results of our photometry are given in Table 1. The light curve of Romano’s star is presented in Fig. 2. The observations of Romano (1978) transferred in are given by open circles, photographic -magnitudes from Rozhen 2-m RCC telescope – by open diamonds, and the CCD -magnitude from 0.6-m telescope – an open triangle. It is seen that Romano’s star presents two maxima in the last years. The first one is around 1970 and the second one is around 1990. There is a local increase of brightness () around 1967, formed from three separate observations. It does not change the common appearance of the light curve. The modified CLEAN algorithm for deconvolution of ”dirty” Fourier spectrum of unequally spaced data (Roberts et al. 1987) was applied in the search for multi-periodic variability of the star. The derived mean period for the whole data set (Romano’s ours) by three methods is days.

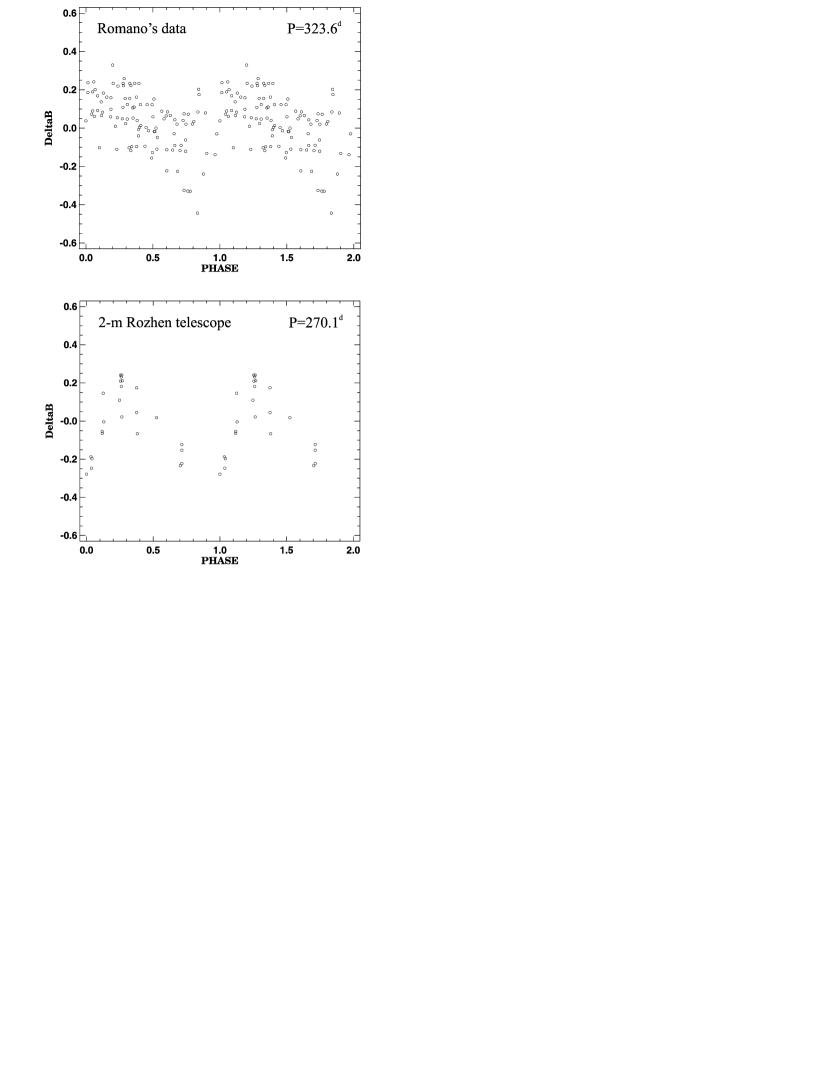
Romano characterized the photometric behavior of the star as ”irregular variations between and pg”. Looking on the light curve of Romano (1978) however (open circles in Fig. 2), one can find hints of oscillations in brightness with smaller amplitude. The CLEAN algorithm allows detection of multiple periodicity in the data set. Along with the mean period there is a clear presence of another much shorter period of days. CLEAN’ed power spectrum of Romano’s data (see Roberts et al. 1987 for details) is given in Fig. 3. The pseudo-periods of () and days () in Fig. 3 do not lead to a reasonable light curve. The basic trend of Romano’s data (open circles) was fitted with cubic spline. Removing the magnitude trend we found the secondary periodicity of the residuals, using a least-squares periodogram analysis by means of the phase dispersion minimization (PDM) task available in IRAF, as well as a period-finding program based on Lafler-Kinman’s (1965) ”theta” statistics (LK). The obtained periods are and days respectively and the average amplitude is about mag. The mean light curve of the residuals is given in Fig. 4 (upper panel).
The period used for this mean curve is days – obtained by CLEAN algorithm. The amplitude is comparable with the scatter of the data ( mag – typical for photographic photometry) but the presence of the period is obvious.
It is difficult to fit and remove the basic trend of our subset of the data, because of their relatively small number and unequal spacing. Despite of this, attempt to find secondary periodicity of the residuals was made. The obtained period from CLEAN is days. LK gives the period of days. The mean light curve of the residuals obtained with the last period is presented in Fig. 4 (lower panel). These periods are more or less speculative. More precise and much more equally distributed observations are needed for reliable analysis, but in any case, in our subset of the data there is presence of periodicity too.
Light curve of Romano’s star is typical for LBVs and shows ”normal” eruptions with amplitude of more than mag and timescale of about years, and smaller periodic oscillations. The presence of smaller oscillations of about half a magnitude and timescales of months and years on top of the longer-term ”normal” eruptions is one of the ”trade-marks” of many LBVs. Probably the closest case is the star AG Carinae (Sterken et al. 1996).
The photometric behavior of Romano’s star in the last 40 years suggests that the star should be considered an LBV. Additional spectroscopic investigation and detection (or not) of a circumstellar nebula are necessary to finally confirm its status.
Acknowledgements.
It is a pleasure to thank Prof. G. Ivanov, Dr. P. Kunchev and Dr. Ts. Georgiev for letting us use their plates of M 33. This research was supported in part by the Bulgarian National Science Foundation grant under contract No. F-812/1998 with the Bulgarian Ministry of Education and Sciences and CONACyT contract E130.1243/2000. O. Sholukhova is thankful for support RFBR grant No 00-02-16588.References
- [1] Conti, P. S., 1984 in IAU Symp 105, ”Observational\adjustfinalcolsTests of the Stellar Evolution Theory”. Eds., Andre Maeder, Alvio Renzini, Reidel, Dordrecht, p 233
- [2] Hubble, E., & Sandage, A. 1953, ApJ, 118, 353
- [3] Humphreys, R., & Davidson. K. 1994, PASP, 106, 1025
- [4] Lafler, J., & Kinman, T. D. 1965, ApJ, Suppl., 1, 216.
- [5] Nota, A., & Lamers, H.J.G.L.M. eds., 1997, Luminous Blue Variables: Massive Stars in Transition, ASP Conf. Series, Vol. 120
- [6] Roberts, D., Lehár, J., Dreher, J. 1987, AJ, 93, 968
- [7] Romano, G. 1978, A&A, 67, 291
- [8] Sandage, A., & Johnson, H. 1974, ApJ, 191, 63
- [9] Sterken, C., Jones, A., Vos, B., Zegelaar, I., van Genderen, A. M., de Groot, M. 1996, I.B.V.S., 4401, 1.
- [10] van den Bergh, S., Herbst, E., Kowal, Ch. 1975, ApJS, 29, 303
- [11] Vlasiuk, V. 1997, Report SAO, 33