A One-sided, Highly Relativistic Jet from Cygnus X-3
Abstract
Very Long Baseline Array images of the X-ray binary, Cygnus X-3 were obtained 2, 4 and 7 days after the peak of a 10 Jy flare on 4 February 1997. The first two images show a curved one-sided jet, the third a scatter-broadened disc, presumably at the position of the core. The jet curvature changes from the first to the second epoch, which strongly suggests a precessing jet. The ratio of the flux density in the approaching to that in the (undetected) receding jet is ; if this asymmetry is due to Doppler boosting, the implied jet speed is . Precessing jet model fits, together with the assumptions that the jet is intrinsically symmetric and was ejected during or after the major flare, yield the following constraints: the jet inclination to the line of sight must be ; the cone opening angle must be ; and the precession period must be .
1 Introduction
Cygnus X-3 is one of the few X-ray binaries that is consistently strong in both radio and X-ray emission. In fact, in both quiescent and flare states, Cygnus X-3 is the most luminous X-ray binary at radio wavelengths (Waltman et al., 1995). Its companion is thought to be a Wolf-Rayet star (van Kerkwijk et al., 1992), and a 4.8 h period has been seen at X-ray (e.g., Mason & Sanford (1979)) and infrared (Mason, Córdova, & White, 1986) energies. This period is generally interpreted as the orbital period of the binary system. Schmutz, Geballe, & Schild (1996) used the velocity shifts of lines in the infrared to estimate, assuming the orbital system is seen edge-on, that the compact object is a black hole with mass .
Giant radio outbursts have been known in Cygnus X-3 since 1972 (Gregory et al., 1972). Large radio flares are always preceded by a quenching of the radio emission (Waltman et al., 1994). The hard X-ray is usually anti-correlated with the radio except during quench-flare periods, although the quench period in hard X-ray is generally longer than in the radio (McCollough et al., 1999). Similarly, the soft thermal X-ray and radio emission is usually correlated except during quench-flare periods (Watanabe et al., 1994). In other words, before a large radio/hard X-ray flare the soft X-ray is more luminous than usual, and during a flare the soft X-ray intensity briefly drops. Observations with the VLA (Geldzahler et al., 1983), MERLIN (Spencer et al., 1986), and VLBI (Schalinski et al., 1995; Molnar, Reid, & Grindley, 1988; Schalinski et al., 1999), during or shortly after large radio flares, suggest ejection of radio-emitting plasma in the north-south direction. Spencer et al. (1986), Schalinski et al. (1995), and Molnar, Reid, & Grindley (1988), assuming a two-sided jet, estimated an expansion rate of 5 . This corresponds to an apparent transverse speed of for a distance of 10 kpc, which we adopt for the remainder of the paper (based on H I absorption; see Dickey 1983). However note a recent H I absorption observation by S. J. Bell Burnell & W. M. Goss (priv. comm) which implies a distance of based on ; and, a Chandra observation of Cygnus X-3’s X-ray scattering halo from which a geometric distance of was calculated (Predehl et al., 2000).
Here we present high resolution images of Cygnus X-3 taken with the Very Long Baseline Array (VLBA)111The VLBA is a facility of the National Radio Astronomy Observatory which is operated by Associated Universities, Inc. under cooperative agreement with the National Science Foundation, following a large radio flare in February 1997, showing a one-sided radio jet directed south from a highly-variable core. §2 details the observations and data reduction, while §3 describes the images and model fits, and §4 the conclusions.

2 Observations and Data Reduction
Cygnus X-3 was observed with all 10 antennas of the VLBA in three 13 hour sessions, two, four, and seven days after the source flared to above 10 Jy at 15 GHz on 4 February 1997. Figure 1 shows the epochs of the VLBA observations in the context of the radio light-curves, taken from the Green Bank Interferometer (GBI) and the Ryle Telescope (to be discussed in a later paper). During most of the first epoch (6 February) observations the source as a whole was optically thin (, ) and rapidly decaying, from to at 8.4 GHz. Unfortunately there were no total flux density measurements during the second epoch (8 February); by the third (11 February) Cygnus X-3 had begun a series of smaller flares with quite rapid declines, the flux density at 15 GHz varying by a factor three or more during the VLBA observations.
A third and potentially more serious complication is the motion of the jet during the observations. As discussed below, the proper motion of the jet is , corresponding to moving by two beams or more during our observations.
The VLBA observations were carried out with a 16 MHz bandwidth centered on 15.365 GHz, using dual polarization and two-bit sampling. The data were correlated using the VLBA correlator in Socorro, NM, USA, and amplitude calibration and fringe fitting were performed using NRAO’s Astronomical Image Processing System (AIPS). Scans on Cygnus X-3 were “sandwiched” between scans on the calibrator J2025+334, away, with a three-minute cycle time, allowing the use of antenna amplitude and phase gain solutions from that source as a first estimate for those on Cygnus X-3.
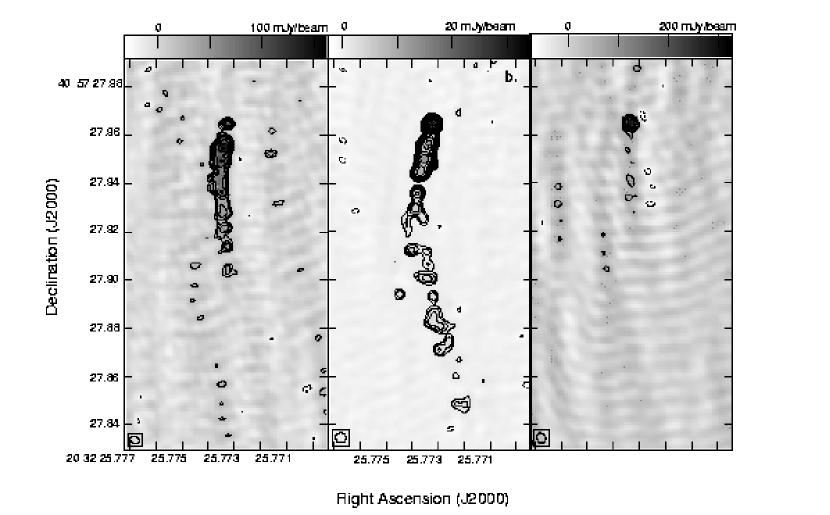
There were several additional complications to the data reduction. First, J2025+334 was too far away from Cygnus X-3 to track the latter’s phase variations accurately; although the position of the northern-most component (presumably the core) was stable to within a few milliarcseconds, self-calibration was required to bring out the full structure of the jet. Second, both Cygnus X-3 and J2025+334 are scatter-broadened, as indicated by the fall-off in the interferometric amplitudes on the longest baselines even when the core completely dominates the image (as in the third epoch). This may of course be intrinsic source structure, but is consistent with the scattering sizes previously measured (see §3.1). In general we concentrate on the more extended jet emission, and the images of all three epochs, shown in Figure 2, are made with a full-width at half-maximum (FWHM) Gaussian taper. The corresponding synthesized beams are roughly 3–5 mas FWHM.
Simulations showed that proper motions of this order would have only minor effects on the images, and would not affect any of our major conclusions. In particular, we modeled the source as a stationary core with a straight jet 60 mas in length beginning 10 mas away, oriented along a position angle of . The total flux density in the jet was taken to be about 10 times that of the core, and fell off as , where is the distance along the jet; this roughly matches the image from the first epoch (Figure 2a). The simulated jet was taken to move outward as a whole along the same position angle at 20 mas/day. The core, and the jet perpendicular to the ejection axis, were modeled as unresolved, but convolved with a Gaussian of 2 mas FWHM to simulate the effect of interstellar scattering. The Fourier transform of this model was then projected onto the observed baselines in the uv-plane, and the entire 13 hour data set imaged and deconvolved following the same procedure as used for the observed data. The resulting image showed a slightly elongated version of the model as it appeared at the mid-point of the observations, with the elongation corresponding to the proper motion of the jet over 13 hours; this seems intuitively reasonable, and shows that proper motion does not significantly affect our conclusions. Following individual radio components between epochs is not advisable, but the apparent curvature and rough extent are real.
The February 6 data were further compromised by poor a priori amplitude calibration of several antennae due to snow over most of the southwestern United States. This epoch required correspondingly more drastic self-calibration and careful imaging, and the resulting map (Figure 2a) is still not nearly as good as those from the second epoch.
The 8 and 11 February data were taken in much better weather, and for these epochs the major complication is the intrinsic variability of the source. This produces artifacts which dominate the noise in the maps, and makes imaging even the core itself quite difficult. During the second epoch (8 February) most of the variability, as well as the total flux, was concentrated in the core. We therefore created a core-only data set by subtracting a first (crude) model of the jet, self-calibrated that data set in hour-long segments, transferred the antenna gains thus derived to the original data, and subtracted CLEAN-component models (Högbom, 1974) of the time-variable core. This produced a jet-only data set phase-referenced to the core. Figure 2b shows the image produced from this data set with one round of phase self-calibration applied and a Gaussian model of the core with an average flux added. The improved calibration reduced the rms noise in the image by a factor of 5, showing that the jet extends an additional 90 mas beyond what could be seen in the maps which were phase-referenced solely to J2025+334.
Unfortunately this method did not improve the 6 and 11 February data sets. For 6 February this could be because of the poor initial amplitude calibration, or because the flux variability was primarily in the jet rather than in the core; most likely, both effects contribute. The 11 February map (Figure 2c) by contrast is entirely dominated by the core, but the above procedure while reducing the noise level did not reveal any convincing jet, to a limit of 10–20 mJy/beam in a 5 mas beam. This noise level is far higher than that in the 8 February map (Figure 2b), presumably because the core is much stronger and its flux variations far greater (a factor 3–4 during these observations; see Figure 1). With this noise level one could not expect to see any emission corresponding to the 8 February jet, even if that emission had not faded at all.
3 Discussion
3.1 Is the Northern Component the Core?
One of the primary conclusions of this work is that the jet in Cygnus X-3 is one-sided, making this the first severely asymmetric Galactic relativistic source. This conclusion rests on the premise that the northernmost component is associated with the core. The evidence for this is quite compelling. Although phase-referencing was not entirely successful, the maps before self-calibration did show that the brightest (northernmost) component is stationary to within 3 mas. Further, the strong variations seen with the Ryle telescope on 11 February are mirrored exactly in the amplitudes measured on the shortest VLBA baselines, consistent with the corresponding image (Figure 3), which shows no evidence for any but the compact northern component. This variability, on timescales of minutes to hours, is most easily explained by assuming this component is indeed the central core, with the variations caused by short-timescale ejection and decay of unresolved jet segments. Finally, simultaneous measurements with the GBI towards the end of the VLBA observations show that the source was optically thick (), a characteristic of emission on very small scales; the fact that the emission at this time came solely from the northern component is another argument that that component is indeed the core.

One possible counter-argument is that the northern component is clearly resolved, as seen both in images and more directly in the uv-plane, where the visibility amplitude drops off rapidly with radius. This might be either intrinsic structure or broadening due to interstellar scattering; Cygnus X-3 is one of the most scatter-broadened sources known (e.g., Wilkinson, Narayan, & Spencer 1994; hereafter WNS), and so might be affected even at these high frequencies. To check this quantitatively, we used K. Desai’s private AIPS task OMFIT to fit half-hour segments of the 11 February uv-data directly, both with and without simultaneous short time-scale (10–120s) phase self-calibration. Segmenting the data was required to disentangle the source size from the extreme flux variability; fitting in the uv-plane is preferable to more normal image-plane fitting, both because those data are the observed quantities, and because the poor uv-coverage in such short periods makes mapping and deconvolution difficult. In any case the results from OMFIT were consistent with more standard fitting in the map plane, and the residuals were reasonable both in the map and in the uv plane. The best-fit Gaussian has a FWHM (geometric mean of major and minor axes) of , an axis ratio of , and is elongated along a position angle of (the error bars reflect both statistical errors in the individual fits, and the full scatter between the fits for the half-hour segments). This and previously published size determinations are shown in Figure 4. Our measurement, as well as the 22 GHz observation of Molnar, Reid, & Grindley (1988), is consistent with a extrapolation from earlier low-frequency () measurements of the scatter broadening, but disagrees both with 8.4 GHz observations by Geldzahler, Kellermann, & Shaffer (1979; hereafter, GKS) and with 15 GHz observations by Newell, Garrett, & Spencer (1998; hereafter, NGS). The disagreement with GKS (who obtain a size of ) might be dismissed on the grounds that their result was based on a single short observation with poor sensitivity and only four useful baselines; their measurement also falls well below any reasonable extrapolation of the lower frequency data. NGS on the other hand observed for 9 hours with the full VLBA, producing a data set quite comparable to ours, and obtained mean FWHMs of between 1 and 1.8 mas at roughly the same frequency (15.3 GHz); they also found that the FWHM was strongly correlated with the flux density on short VLBA baselines. (At the current stage of analysis our data do not demand that the source change size, and in any case show with high confidence that the size at all times lies within the bounds noted above.)

It is difficult to reconcile NGS’ lower bound on the size (1 mas) with the previous measurements and any reasonable scattering model, since it lies significantly below a extrapolation of those data. On the other hand, the size (1.8 mas) and orientation (position angle –, based on their images) NGS found when the source was brighter matches our own. Further, both the ellipticity and position angle derived from our data are within the errors identical with those derived at 1692 MHz by WNS (1.32 and , respectively) and at 1665 MHz by Molnar et al. (1995, and ). Admittedly most of the observations, as well as our own, were taken during or shortly after flares, and NGS found their larger sizes during short-lived ‘mini-flares’ to 200–300 mJy. But while NGS find a much smaller size () during quiescence (– at 15 GHz), Fender et al.’s (1995) three-day MERLIN observations at 1658 MHz during another quiescent period (40-50 mJy at both 18 and 2cm) gave a size which was only slightly smaller than earlier flaring measurements (, vs. 150–160 mas from Spencer et al. 1986, WNS, and Molnar et al. 1995 at 1660–1692 MHz) but with a virtually identical axis ratio () and position angle (). The Fender et al. (1995) result seems fairly solid, given the large amount of data (three full tracks, yielding an rms noise of ) and high resolution (0.15 arcsec). If the NGS result is correct their observations must have coincided with a very unusual period of lower and much more isotropic scattering.
So we are left with two possibilities: either the NGS result for some reason is spurious, and the northern component is an unresolved source broadened by interstellar scattering; or the NGS result is correct, and the northern component we see has roughly the same size and orientation as they observe during mini-flares. Either way it is difficult to imagine that the northern component is not closely associated with the central object, and it seems most reasonable to assume that it is the origin of the extensive jet ejected during the February radio flare. All the evidence therefore indicates that our images of Cygnus X-3 indeed show a one-sided jet source.
3.2 The Jet
Accepting the northern component as the core, the jet, shown in Figure 2, is at least 50 mas long on 6 February, and 120 mas long by 8 February. These are lower limits on the true length of the jet, as it fades into the noise towards the south. In both maps the jet is curved, and that curvature changes between the two epochs.
What can we learn from these images? Most obviously, the ejection must be fairly continuous, a stream rather than one or a few ‘blobs.’ This is reminiscent of the jets seen in SS433 (Vermeulen et al., 1987) and GRO J1655-40 (Hjellming & Rupen, 1995), but unlike the easily-separable components seen in GRS 1915+105 (Mirabel & Rodríguez, 1994; Fender et al., 1999a). Unfortunately this, combined with the poor quality of the 6 February image, makes it impossible to measure the proper motions of individual components directly.
Based on the radio light curves (Figure 1) it seems likely that the jet was ejected at the time of the large radio flare, beginning roughly at MJD 50482.10.1 (MJD – Modified Julian Date: JD2400000.5). This is not absolutely conclusive — the amount of flux in the most extended structures is not so great that it would necessarily have dominated the light curve even a week or more before the flare, if it did not decay over time. But the jet emission has clearly declined significantly from the first to the second VLBA images (Figures 2a and 2b), and this together with the quite sharp decline seen in most of the smaller radio flares strongly suggests that the emission we see originated in the main radio flare on MJD 50482.1.
| Epoch | time since start of flare | proper motion | ||
|---|---|---|---|---|
| MJD | date | (days) | (mas/day) | |
| 50485.46–50486.00 | (6 Feb.) | |||
| 50487.46–50488.05 | (8 Feb.) | |||
| 50490.46–50491.04 | (11 Feb.) | |||
Note. — The proper motions are based on lengths of 50 mas and 120 mas for 6 and 8 February, respectively. The apparent velocity is based on a distance of 10 kpc.
Table 1 lists the epochs of observation, inferred ages, proper motions and apparent jet speeds. These proper motions () are significantly higher than those previously cited for this source, which range from 8.4 (Schalinski et al., 1995, corrected for a one-sided jet) to (Geldzahler et al., 1983) to 4.6–18 mas/day (Spencer et al., 1986, with the range corresponding to the uncertainty in the ejection date). Given the limitations of those earlier observations, which could easily have missed the sort of low-level extended structure on which we base our higher estimate, there is no evidence that the proper motion has changed with time. To the contrary, the agreement between the position angles measured in those earlier observations (in all cases almost directly north-south) and our own suggests that the ejection axis at least has remained remarkably stable since at least 1982.
One possible inconsistency is that the uv-plane fits to the data from the third epoch do not suggest such large source motions. Probably the explanation is that the emission associated with short timescale flares is intrinsically different from the longer-lived emission characteristic of larger flares like that of 4 February; for instance, it might be that the emission associated with the short flares decays too rapidly to be seen outside the scattering disk. For the remainder of this section we assume that the third epoch provides no relevant information on the motions of the jet seen in the first two epochs.
3.2.1 Physical Parameters
Our images give three basic observables useful for deriving the intrinsic properties of the jet: the apparent proper motion; a limit on the ratio of the brightness of the approaching to that of the receding jet, if the system is intrinsically symmetric; and the appearance of the jet itself, in particular its curvature and evolution with time. The first two are susceptible to direct mathematical analysis; the last requires more heuristic modeling, which is deferred to the next subsection. Note that we implicitly assume that the observed proper motion is related to a physical velocity, rather than a group speed or some optical illusion involving e.g. scattering screens or the simultaneous ‘lighting up’ of well-separated hot spots.
Under this assumption, according to special relativity (e.g., Hughes & Miller 1991), a jet moving at an intrinsic speed at an angle to the line-of-sight will be observed to have an apparent transverse motion , where
The minimum for the approching component, for a given is
corresponding to an inclination of . As discussed above, for our observations , implying . Since , the inclination lies between and
For Cygnus X-3 this implies an inclination between and . The corresponding Doppler boosting (see below) is unconstrained; for inclinations above , the source could actually be de-boosted, i.e. appear fainter than it would without relativistic effects, as has been seen in GRS 1915+105 (Mirabel & Rodríguez, 1994; Fender et al., 1999a).
If the source were intrinsically symmetric, the ratio of the flux in the approaching to that in the receding jet would provide an additional constraint. Since we do not detect a jet on the opposite side, we have only an upper limit on this ratio: , determined by integrating the flux in the southern jet and comparing that to the noise to the north, integrated over a somewhat smaller region to account for the slower (apparent) motion of the receding jet. The Doppler factor for a relativistic jet is
The corresponding Doppler boosting of the observed flux density is (Pearson & Zensus, 1987)
where is the frequency, the flux density, is a constant ( for a continuous jet, for an unresolved blob), and is the spectral index (). The primed quantities refer to the rest frame of the object. The predicted flux ratio (between the approaching and receding jets) is then
where is now taken as the inclination of the approaching jet. Solving for the intrinsic as a function of the observed quantities, we have
Since both and can be at most 1.0, , and for synchrotron emission at these frequencies, an observed lower limit on corresponds to a lower limit on and an upper limit on . The GBI radio light curves during the period when these observations showed a jet suggest , typical for optically-thin synchrotron emission; since the jet appears fairly continuous, we take . , as discussed above. We have then that
implying and . These limits are consistent with, and more stringent than, those based on the proper motion.
Clearly it would be useful to place limits on the maximum as well as the minimum proper motion. Each epoch’s observations took place over 13 hours; one could therefore hope to check for changes in source structure within a given observing run. Unfortunately the limited uv-coverage within a small segment makes it virtually impossible to image such a complex structure as the curved jet; further, the corresponding point spread function changes drastically as the earth rotates, making even an unchanging source appear quite differently when imaged with short segments of data separated by even a half hour.
3.2.2 Jet Curvature and Precessing Jet Models
The simplest explanation for the curvature of the jet, and the change in that curvature between the first and the second image, is that the jet is precessing (cf. Hjellming & Johnston 1988). The fact that the jet curves out to the west, then back to the east, with no sign of another westward bend, implies that the ejection occured over at most one full precession period. Given the length of the jet this implies a joint limit on the speed and the period:
with being the length of the jet, light-days on 8 February, assuming a distance of 10 kpc. The precession period must therefore be
Since , .
To proceed further requires more detailed modeling. Given the complex radio light curve and the various imaging problems mentioned above, and to avoid the additional assumptions involved in physically modeling the ejecta, we attempt to fit only the shape of the jet and its evolution between the two epochs, not the jet’s brightness distribution. That is, we only require that the models trace the jet geometry in both the first and the second epoch. We further assume, as in the last paragraph, that the observed jet was produced within a single precession period.
The precessing jet model as described by Hjellming & Johnston (1988) has eight important parameters: the distance, ; the precession period, ; the intrinsic velocity, ; the inclination angle of the jet axis to the observer, ; the cone opening angle, ; the position angle of the jet on the sky, ; the phase of the precession at some fiducial time, ; and the sense of rotation of the jet (clockwise or counter-clockwise, as seen from the jet origin). The distance of the source is kept fixed at 10 kpc; the other parameters are to be found by fitting the observed VLBI images. In order to find the full range of allowed parameters, we searched for the best alignment between the images and the model, based on minimization (Press et al., 1986), using several million randomly-chosen sets of input parameters. The initial guesses uniformly covered the full range of physically meaningful model parameters (see Table 2, with the maximum period (600 days) chosen as an approximation of ‘very long’. The agreement between the model and the data was measured by the weighted sum of the squares of the distances between the closest points in the model, and positions measured along the ‘spine’ of the jet in each of the first and second epoch images (see Figure 5a). The weights were taken from rough error bars based on the believability of a feature and the approximate accuracy of its position, taking into account uncertainties due to noise in the images, deconvolution artifacts, the local width of the jet, etc. While the absolute value of the resulting is not very meaningful, models with lower do match the images better, which is all that is necessary for the minimization.
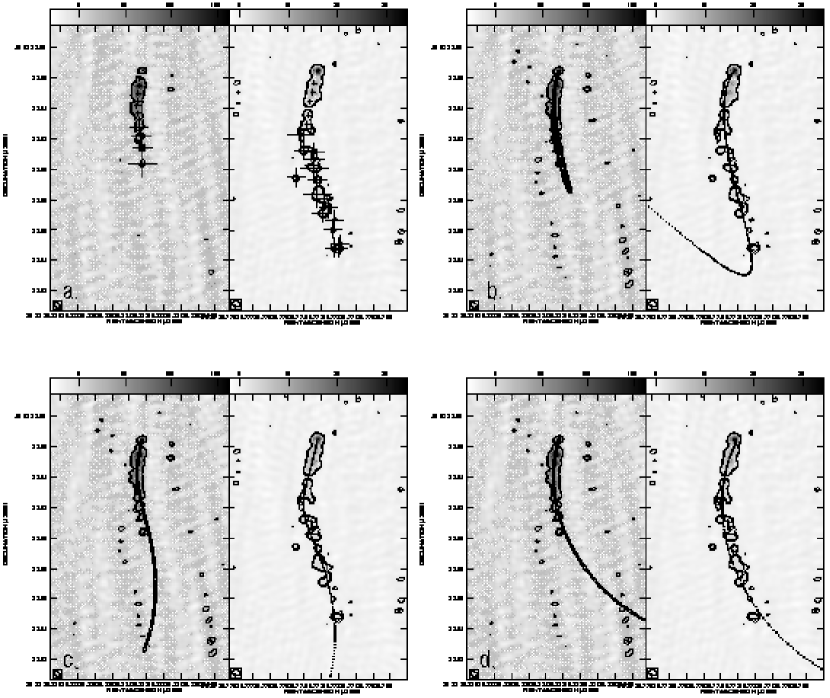
The initial parameters, and the positions and error bars measured off the two images, were passed to a -minimization routine based on the downhill simplex method (Press et al., 1986), producing about a million converged solutions. Based on those results several hundred thousand more models were run, using a more restricted set of inputs chosen to maximize the number of ‘good’ solutions (defined below), in order to flesh out the range of acceptable model parameters. We have three constraints on these solutions. First, they must match the observed jet morphology. Empirically corresponds to a good chi-by-eye fit. Second, if the extended jet did indeed originate at MJD 50482.10.1, the jet as seen in the first image can be at most 4.0 days old (as seen by us), while the jet seen in the second image can be at most 6.0 days old. Finally, if the jet is intrinsically two-sided, the jet/counter-jet ratio on 8 February is (see §3.2.1). Without a model for the jet brightness distribution and its evolution, this last constraint is impossible to apply fully to these models. We take a conservative approach, requiring that at least one observed point along the jet have a boosting factor, relative to the corresponding component in the purported counter-jet, of at least (see §3.2.1). Figure 5b-c shows the images with examples of the major families of solutions superimposed.
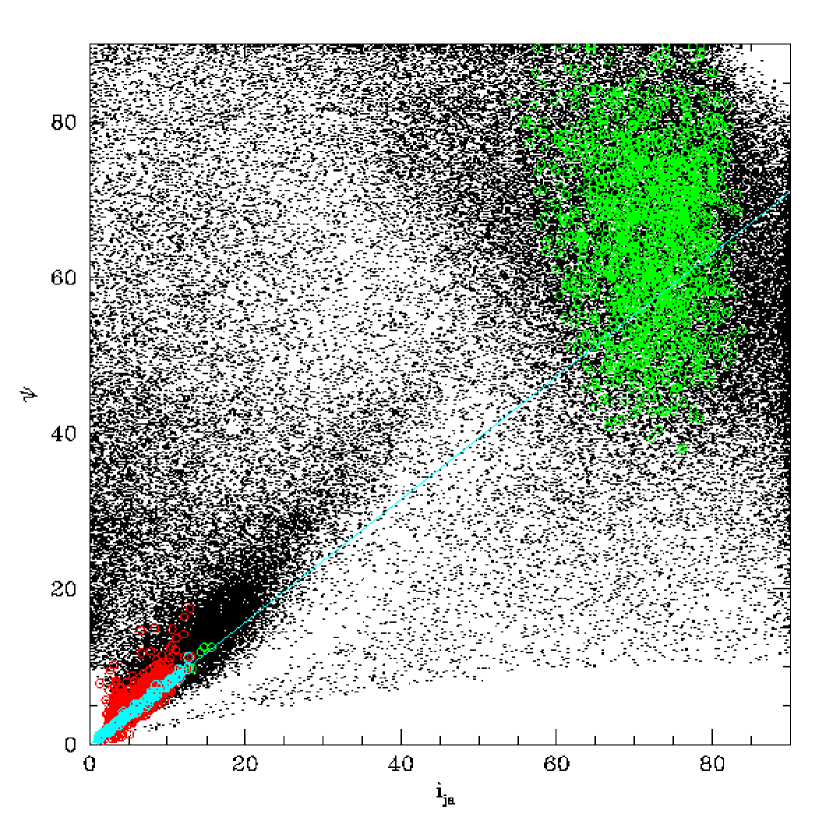
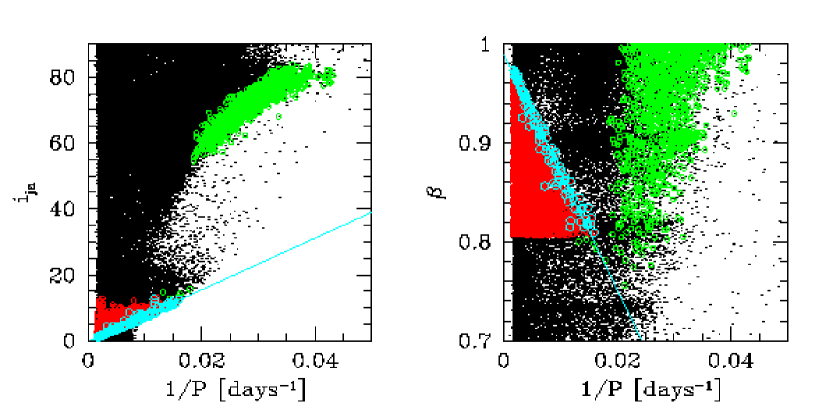
The results are given in Table 2. Good fits, as measured by , may be obtained for a wide range of parameters (see Figures 6 & 7). In particular, jets pointing away from the observer can match the observed morphologies in both images. There is a lower limit on the period of about 15 days, analogous to the analytic limit discussed above. More surprisingly, there is also a lower limit on the age of the ejecta: they must have been expelled at least 2.5 days before the first image, and at least 3.5 days before the second. Note that this is derived simply by fitting the morphology, without any additional constraints from the radio light curves, and results from the requirement that both images be fit simultaneously within one period, which limits the proper motion and therefore the age. Interestingly, this lower bound on the age corresponds to the peak in the radio light curves around MJD 50483.5.
| Period | |||||||
|---|---|---|---|---|---|---|---|
| Rotation | (days) | aaInclinations larger than correspond to one-sided jets pointing away from the observer. | |||||
| Initial guessbbInitial guesses were taken as uniform random deviates over the listed range, with each parameter chosen independently. | CW, CCWccBoth clockwise (as seen for the jet origin) and counter-clockwise jet rotation were allowed. | ddThe maximum period (600 days) was chosen as an approximation of “very long.” | |||||
| & ee is the date at which jet ejection began. | CCW | ||||||
| CCW | |||||||
| & | CCW | ||||||
| CW | |||||||
| , ee is the date at which jet ejection began., | |||||||
| & | CCW |
Requiring in addition that the jet in the first image be no more than 4.0 (and the second no more than 6.0) days old, restricts the possible solutions enormously. Jets pointing away from the observer are entirely eliminated, because they cannot produce a long enough jet in the required time. Solutions with clockwise rotation (as seen from the jet origin) are also excluded, as they give poor fits to the observed morphology (minimum ). The solutions in which the jet rotates counter-clockwise are themselves split into two basic families: low-inclination jets () with a linear relationship between inclination and cone opening angle, and relatively long periods (); and high-inclination jets () with large cone opening angles () and relatively short periods. The latter branch is eliminated if sufficient boosting is required to conceal the counter-jet in an intrinsically symmetric system. The solutions obtained using all three constraints then form a one-parameter family, with
With these additional constraints, the minimum age for the first image is , corresponding to ejection on MJD 50482.7–50483.2. The limit on arises directly from the jet/counter-jet ratio; the maximum ages for the two images constrain , which is a combination of and ; those in turn constrain the period, assuming the jet seen in the image was formed within a single precession period. The requirement to match the observed curvatures reduces this two-dimensional space of solutions to a single dimension, and further requires the above restrictions on the cone opening angle and the other geometric properties (, ).
In sum, the simple precessing-jet model of Hjellming & Johnston (1988) can fit the observed jet quite well, for either a one- or a two-sided jet. To conceal the counter-jet requires substantial Doppler boosting — in these models the intrinsic (as compared to the differential jet/counter-jet) Doppler boosting of the flux is at least a factor 13, and could be much higher. Also, for these low-inclination models, temporal variations in the jet’s frame are significantly compressed in ours because of time dilation (e.g., in one model 6 months of jet evolution looks like only 6 days to the observer of the jet). This might help explain both the unusual strength and the rapid variability of Cygnus X-3 as a radio source, although it should be noted that this time dilation would not affect variability that originates in the accretion disk or any other part of the system that is not moving towards us at relativistic speeds. The small range of position angles observed over the years is also consistent with the small range of ejection angles in these models – jet models more nearly in the plane of the sky require much larger cone angles to fit our images, giving correspondingly wider position angle swings over the full precession period.
One argument against the low-inclination models is that the periodic dips in the X-ray and infrared light-curves are usually modeled as opacity effects in a reasonably edge-on disk (e.g., Mason, Córdova, & White 1986). If the radio jet were perpendicular to the disk this would suggest the jet must be in the plane of the sky. However, Ghosh et al. (1981) showed that the X-ray light curves could be matched in detail even for disks with inclinations up to , and observations at other wavelengths are also consistent with a wide range of inclinations (Schmutz, Geballe, & Schild, 1996; Hanson, Still, & Fender, 2000). Also, we clearly see precession in the jet, which implies that the jet is not perpendicular to the binary system’s plane of orbital motion. So our solutions do not put a tight constraint on the inclination of the binary system.
It is also possible that the system is edge-on and the jet in Cygnus X-3 is in the plane of the sky. The one-sided jet could then be explained either as intrinsic or, as suggested by Fender et al. (1999b), by obscuration. Obscuration seems very unlikely, since it would require not only an odd geometry, blocking out one side of the jet but not the core or the other side of the jet, but also material opaque at 15 GHz out to .
4 Conclusions and Implications
The main result of these observations is to show that the radio emission from Cygnus X-3 during flares is dominated by a one-sided relativistic jet with an intrinsic speed of at least . Assuming the jet to be intrinsically symmetric, precessing jet models give a maximum inclination to the line-of-sight of . Cygnus X-3 is the most luminous X-ray binary at radio wavelengths, and the observed asymmetry and high proper motion make it tempting to speculate, as mentioned in the previous section, that this high luminosity is due to significant Doppler boosting of a jet pointed almost directly towards us. This might also help explain the rapid and extreme radio variability of this and other known relativistic jet sources. However, since no counterjet is seen, the VLBA observations do not require such boosting, and, unless the X-rays are also associated with the jet (contrary to most current models), boosting of the jet would not explain why Cygnus X-3 is also one of the brightest X-ray sources in the Galaxy (, Bonnet-Bidaud & van der Klis 1981).
There are three other relativistic jet sources in the Galaxy which have been studied in some detail: SS433, GRS 1915+105 and GRO J1655-40. Cygnus X-3 is the only one-sided jet among the four, presumably because at the time of the flare it was aligned more nearly along the line-of-sight, although the jet GRO J1655-40 is sometimes intrinsically asymmetric (Hjellming & Rupen, 1995). Like GRO J1655-40, Cygnus X-3 is a strong black hole candidate based on its mass function, a conclusion strengthened by the limit derived here on the inclination of the jet, which is probably roughly aligned with the angular momentum axis of the orbit. Cygnus X-3 is however the first consistently strong X-ray source to exhibit such highly relativistic jets; GRS 1915+105 and GRO J1655-40 are both X-ray transients, often undetectable but occasionally among the brightest sources in the sky, while SS433 is at best an undistinguished X-ray source. Similarly, only Cygnus X-3 and SS433 are detectable in the radio even when they are not flaring, though GRS 1915+105 can remain in a plateau state for months or longer (Foster et al., 1996). The radio and X-ray states are closely coupled for all three of the highly relativistic jets, while for SS433 the lack of an obvious connection may simply be due to the relatively poor X-ray coverage. Intriguingly, both GRO J1655-40 and GRS 1915+105 have a very unusual, hard power-law X-ray tail to energies of several hundred keV, while Cygnus X-3 has become famous as an occasional source of these (Matz et al., 1996) and even higher energy photons (certainly up to 100 MeV; see Lamb et al. 1977 and Fichtel, Thompson, & Lamb 1987).
The clear implication is that changes in the accretion disk produce changes in the radio jet, and that an excess of high-energy photons may indicate a source capable of producing highly relativistic radio jets. It is not particularly surprising that the high-energy photons and the high-energy electrons should be fairly closely coupled. What is new here is that an X-ray binary, with consistent and reasonably strong X-ray and radio emission — and hence, a relatively stable accretion rate, and accretion disk — can give rise to the highly relativistic jets previously associated only with very unusual X-ray transients.
An obvious question is whether the quiescent radio emission is also in the form of a relativistic jet. In SS433, it clearly is, and neither the intrinsic speed nor the orientation of the jet depend on the strength of the X-ray or radio emission. Neither of the highly relativistic X-ray transients has been detected in radio quiescence, although observations during the smaller flares of GRS 1915+105 are broadly consistent with the long-lived flare imaged by Mirabel & Rodríguez (1994). Unfortunately the current data on Cygnus X-3 are still too fragmentary to convince one way or the other. Our 11 February observations suggest at most a much slower expansion rate than during giant flares, while NGS find something much faster. Despite this confusion Cygnus X-3 offers the unique opportunity to check the behavior of a highly relativistic jet source over its whole range of X-ray and radio states; we and doubtless others will be observing this source for some time to come.
Finally, with a convincing jet found in an X-ray binary like Cygnus X-3, it is beginning to seem that every Galactic X-ray source with radio emission turns out, when imaged, to be a relativistic jet. While the four discussed so far are the only truly compelling examples, there are hints that several others are jets as well (possible polarization in 4U 1630-47, Buxton et al. 1998; elongated structure in GX 339-4, Fender et al. (1997); suggestions of elongation and high-speed expansion in LSI+, Peracaula, Gabuzda, & Taylor 1998; VLA images of one-sided jet in V4641 Sgr, Hjellming et al. 2000). On the other hand, all the relativistic sources currently known are very peculiar in some ways, although few of those peculiarities are the same for all four sources. The next challenge is to image some of the fainter, more common radio X-ray binaries, to see whether more ‘normal’ systems also give rise to relativistic jets.
References
- Anderson et al. (1972) Anderson, D., Conway, R. G., Davis, R. J., Peckham, R. J., Richards, P. J., Spencer, R. E., & Wilkinson P. N. 1972, Nat. Phys. Sci., 239, 117
- Bonnet-Bidaud & van der Klis (1981) Bonnet-Bidaud, J. M., & van der Klis, M. 1981, A&A, 101, 299
- Buxton et al. (1998) Buxton, M., Sood, R., Rayner, D., Tzioumis, T., Kuulkers, E., Dieters, S., & Durouchoux, P. 1998, IAU Circ., 6827
- Dickey (1983) Dickey, J. M. 1983, ApJ, 273, L71
- Fender et al. (1995) Fender, R. P., Bell Burnell, S. J., Garrington, S. T., Spencer, R. E., & Pooley, G. G. 1995, MNRAS, 274, 633
- Fender et al. (1997) Fender, R. P., Bell Burnell, S. J., Waltman, E. B., Pooley, G. G., Ghigo, F. D., & Foster, R. S. 1997, MNRAS, 288, 849
- Fender et al. (1999a) Fender, R. P., Garrington, S. T., McKay, D. J., Muxlow, T. W. B., Pooley, G. G., Spencer, R. E., Stirling, A. M. & Waltman, E. B. 1999a, MNRAS, 304, 865
- Fender et al. (1999b) Fender, R. P., Hanson, M. M., & Pooley, G. G. 1999b, MNRAS, 308, 473
- Fichtel, Thompson, & Lamb (1987) Fichtel, C. E., Thompson, D. J., & Lamb, R. C. 1987, ApJ, 319, 362
- Foster et al. (1996) Foster, R. S., Waltman, E. B., Tavani, M., Harmon, B. A., Zhang S. N., Paciesas, W. S., & Ghigo, F. D, 1996, ApJ, 467, L81
- Geldzahler et al. (1983) Geldzahler, B. J., Johnston, K. J., Spencer, J. H., Klepczynski, W. J., Josties, F. J., Angerhofer, P. E., Florkowski, D. R., McCarthy, D. D., Matsakis, D. N., & Hjellming, R. M. 1983, ApJ, 273, L65
- Geldzahler, Kellerman, & Shaffer (1979) Geldzahler, B. J., Kellermann, K. I., & Shaffer, D. B. 1979, AJ, 84, 186 (GKS)
- Ghosh et al. (1981) Ghosh, P., Elsner, R. F., Weisskopf, M. C., & Sutherland, P. G. 1981, ApJ, 251, 230
- Gregory et al. (1972) Gregory, P. C., Kronberg, P. P., Seaquist, E. R., Hughes, V. A., Woodsworth, A., Viner, M. R., & Retallak, D. 1972, Nature, 239, 440
- Hanson, Still, & Fender (2000) Hanson, M. M., Still, M. D., & Fender, R. P. 2000, ApJ, 541, 308
- Hjellming & Johnston (1988) Hjellming, R. M., & Johnston, K. J. 1988, ApJ, 328, 600
- Hjellming & Rupen (1995) Hjellming, R. M., & Rupen, M. P. 1995, Nature, 375, 464
- Hjellming et al. (2000) Hjellming, R. M., Rupen, M. P., Hunstead, R. W., Campbell-Wilson, D., Mioduszewski, A. J., Gaensler, B. M., Smith, D. A., Sault, R. J., Fender, R. P., Spencer, R. E., de la Force, C. J., Richards, A. M. S., Garrington, S., T., Trushkin, S. A., Ghigo, F. D., Waltman, E. B. & McCollough, M. 2000, ApJ, 544, 977
- Högbom (1974) Högbom, J. A. 1974, A&AS, 15, 417
- Hughes & Miller (1991) Hughes, P. A. & Miller, L. 1991, in Beams and Jets in Astrophysics, ed. Hughes, P. A. (Cambridge University Press), p. 1
- Lamb et al. (1977) Lamb, R.C., et al. 1977, ApJ, 212, L63
- Margon, Grandi, & Downes (1980) Margon, B., Grandi, S. A., & Downes, R. A. 1980, ApJ, 241, 306
- Mason, Córdova, & White (1986) Mason, K. O., Córdova, F. A., & White, N. E. 1986, ApJ, 309, 700
- Mason & Sanford (1979) Mason, K. O., & Sanford, P. W. 1979, MNRAS, 189, 9P
- Matz et al. (1996) Matz, S. M., Fender, R. P., Bell Burnell, S. J., Grove, J. E., & Strickman, M. S. 1996, A&AS, 120, 235
- McCollough et al. (1999) McCollough, M. L., Robinson, C. R., Zhang, S., N., Harmon, B. A., Hjellming, R. M., Waltman, E. B., Foster, R. S., Ghigo, F. D., Briggs, M. S., Pendleton, G. N., & Johnston, K. J. 1999, ApJ, 517, 951
- Mirabel & Rodríguez (1994) Mirabel, I. F., & Rodríguez, L. F. 1994, Nature, 371, 46
- Molnar, Reid, & Grindley (1984) Molnar, L. A., Reid, M. J., & Grindlay, J. E. 1984, Nature, 310, 662
- Molnar, Reid, & Grindley (1988) Molnar, L. A., Reid, M. J., & Grindlay, J. E. 1988, ApJ, 331, 494
- Molnar et al. (1995) Molnar, L. A., Mutel, R. L., Reid, M. J., & Johnston, K. J. 1995, ApJ, 438, 708
- Newell, Garrett, & Spencer (1998) Newell, S. J., Garrett, M. A., & Spencer, R. E. 1998, MNRAS, 293, L17 (NGS)
- Orosz & Bailyn (1997) Orosz, J. A. & Bailyn, C. D. 1997, ApJ, 477, 876
- Pearson & Zensus (1987) Pearson, T. J. & Zensus, J. A. 1987, in Superluminal Radio Sources, eds. Zensus, J. A. & Pearson, T. J., Cambridge Univ. Press, 1
- Peracaula, Gabuzda, & Taylor (1998) Peracaula, M., Gabuzda, d. C., Taylor, A. R., 1998, A&A, 330, 612 Martí, J., Rius, A., & Estalella, R. 1994, A&A, 285, 547
- Predehl et al. (2000) Predehl, P., Burwitz, V., Paerels, F., & Trümper, J. 2000 A&A357, L25
- Press et al. (1986) Press, W. H., Flannery, B. P., Teukolsky, S. A. & Vertterling, W. T., 1986, Cambridge Univ. Press
- Schalinski et al. (1995) Schalinski, C. J., Johnston, K. J., Witzel, A., Spencer, R. E., Fiedler, R., Waltman, E., Pooley, G. G., Hjellming, R. M., & Molnar, L. A. 1995, ApJ, 447, 752
- Schalinski et al. (1999) Schalinski, C. J., Johnston, K. J., Witzel, A., Waltman, E. B., Umana, G., Pavelin, P. E., Ghigo, F. D., Ventuti, T., Mantovani, F., Foley, A. R., Spencer, R. E., & Davis, R. J. 1999, A&A, 329, 504
- Schmutz, Geballe, & Schild (1996) Schmutz, W., Geballe, T. R., & Schild, H. 1996, A&A, 311, L25
- Spencer et al. (1986) Spencer, R. E., Swinney, R. W., Johnston, K. J., & Hjellming, R. M. 1986, ApJ, 309, 694
- van Kerkwijk et al. (1992) van Kerkwijk, M. H., Charles, P. A., Geballe, T. R., King, D. L., Miley, G. K., Molnar, L. A., van den Heuvel, E. P. J., van der Klis, M., & van Paradijs, J. 1992, Nature, 355, 703
- Vermeulen et al. (1987) Vermeulen, R.C., Schilizzi, R.T., Icke, V., Fejes, I., & Spencer, R.E. 1987, Nature, 328, 309
- Waltman et al. (1994) Waltman, E. B., Fiedler, R. L., Johnston, K. J., & Ghigo, F. D. 1994, AJ, 108, 179
- Waltman et al. (1995) Waltman, E. B., Ghigo, F. D., Johnston, K. J., Foster, R. S., Fiedler, R. L., & Spencer, J. H. 1995, AJ, 110, 290
- Watanabe et al. (1994) Watanabe, H., Kitamoto, S., Miyamoto, S., Fiedler, R. L., Waltman, E. B., Johnston, K. J., & Ghigo, F. D. 1994, ApJ, 433, 350
- Wilkinson, Narayan, & Spencer (1994) Wilkinson, P. N., Narayan, R., & Spencer, R. E. 1994, MNRAS, 269, 67 (WNS)