Multi-Epoch VLBA Observations of EGRET-Detected Quasars and BL Lac Objects: Connection between Superluminal Ejections and Gamma-Ray Flares in Blazars
Abstract
We examine the coincidence of times of high -ray flux and ejections of superluminal components from the core in EGRET blazars based on a VLBA monitoring program at 22 and 43 GHz from November 1993 to July 1997. In 23 cases of -ray flares for which sufficient VLBA data exist, 10 of the flares (in 8 objects) fall within 1 uncertainties of the extrapolated epoch of zero separation from the core of a superluminal radio component. In each of two sources (0528134 and 1730130) two successive -ray flares were followed by the appearance of new superluminal components. We carried out statistical simulations which show that if the number of coincidences 10 the radio and -ray events are associated with each other at 99.999% confidence. Our analysis of the observed behavior, including variability of the polarized radio flux, of the sources before, during, and after the -ray flares suggests that the -ray events occur in the superluminal radio knots. This implies that the -ray flares are caused by inverse Compton scattering by relativistic electrons in the parsec-scale regions of the jet rather than closer to the central engine.
1 Introduction
We have completed a monitoring program of the milliarcsecond-scale structure of -ray bright blazars (42 sources) with the VLBA at 22 and 43 GHz during the period November 1993 to July 1997. The images, model fits, and basic statistical analysis of this study are presented in Jorstad et al. (2001). Based on proper motions in 33 sources, we have found that the apparent superluminal motions in -ray sources are much faster than for the general population of bright compact radio sources. The results strongly support the thesis that the -ray emission originates in a highly relativistic jet. A positive correlation (coefficient of correlation 0.45) between VLBI core flux and -ray flux suggests that the production of the -ray emission takes place in the most compact regions of the relativistic jet (Mattox et al. 1997a; Jorstad et al. 2001). Comparison of Metsähovi radio (22 and 37 GHz) total flux density variations and EGRET -ray observations led Lähteenmäki, Valtaoja, & Tornikoski (1999) to suggest that the radio and -ray emission originates within the same shocked area of the relativistic jet and that the -rays are most likely produced by the synchrotron self-Compton mechanism. If this is the case, then VLBI component ejections should correspond to outbursts in the -ray light curves. The first case in which the ejection of a jet component was contemporaneous with enhanced level of -ray flux was reported in the quasar 3C 279 by Wehrle, Zoock, & Unwin (1994). Several other cases were found during the EGRET mission: 3C 454.3 (Krichbaum et al. 1995), 3C 273 (Krichbaum et al. 1996), 0836710 (Otterbein et al. 1998), 1611343 (Piner & Kingham 1998), and 0528134 (Britzen et al. 1999). On the other hand, no components associated with the -ray flares of CTA 26, 1156295, and 1606106 (Piner & Kingham 1998), or BL Lac (Denn, Mutel, & Marscher 1999) were detected to emerge.
The third catalog of high-energy (E100 MeV) -ray sources detected by the EGRET telescope on the Compton Gamma Ray Observatory includes 66 high-confidence identifications of blazars and presents -ray light curves from April 1991 to October 1995 (Hartman et al. 1999). Our sample of blazars observed with the VLBA contains 64% of these -ray sources. We have detected more than 80 superluminal components ejected during the period from 1980 to 1996.5. The majority of (extrapolated) epochs of zero separation of components from the VLBI core fall into the interval from 1993 to 1996, since the best sampling of our observations covers the period from October 1994 to November 1996. The components generally have high apparent speeds (the distribution of apparent velocities peaks at 8-9 , where km s-1 Mpc-1, ) with a lifetime of visibility of a typical component in the 22/43 GHz images of 1.50.5 yr. Therefore, if every -ray flare is associated with the ejection of a superluminal component, then -ray flares detected during the period from 1993 to 1996 should correspond to VLBI components in our images. However, we are not able to test the inverse relationship — whether every ejected superluminal component is associated with a -ray flare — owing to the sparseness of the -ray light curves and uncertainties of the extrapolated epochs of zero separation of the superluminal components from the core. Typical uncertainties in the time of zero separation are 0.2 yr. The characteristic time scale of a -ray outburst in blazars ranges from a week to a month (Mattox et al. 1997b, McGlynn et al. 1997, Mattox et al. 2001), about 2 times less than the uncertainty in the time of component ejection. On average, a -ray light curve consists of 165 measurements during 4.5 yr, half of which are only upper limits, usually when the sensitivity of the observation is relatively low. Despite these difficulties, we consider that our sample suffices to determine statistically whether -ray flares are associated with major energetic disturbances that propagate down the jet.
2 Gamma-Ray Flares
The identification of -ray flares is a key aspect of our statistical analysis, since if there is a one-to-one correspondence between -ray flares and ejections of superluminal components then every -ray flare detected during the period from 1993 to 1996 should be related to the appearance of a superluminal feature in our images. From the entire database of -ray fluxes of blazars collected in the 3rd EGRET catalog (Hartman et al. 1999) we have determined the average -ray flux of every source as a weighted mean of all measurements, including upper limits, with weight equal to , where is the uncertainty of the measurement; in the case of an upper limit is equal to the value of the upper limit itself. This definition yields a large standard deviation of the mean compared with the average flux itself. The average -ray flux is considered as the base level of -ray emission, although it probably exceeds the actual quiescent -ray state (if such a quiescent -ray state exists in blazars). We specify that a -ray flare occurred when a flux measurement exceeded the mean flux by a factor of 1.5 or more and the uncertainty of the measurement at the high state was less than the deviation of the measurement from the mean. We make only one exception to these criteria: in the quasar 0528134 we classify the -ray activity in the first half of 1995 as a -ray flare (the third -ray flare for this source) despite a ratio of the maximum measured flux to the average flux equal to 1.4. In this case an increase in the -ray flux was observed over 5 successive measurements (with small uncertainties) such that the structure of the flare is well defined (see Fig. 2a). Table 1 presents the results of -ray flare detections for all blazars from our sample for which a high state of -ray emission is found. The columns of Table 1 are as follows: (1) source name, (2) average -ray flux in units of phot cm-2 s-1 () and its standard deviation, (3) the ratio of the maximum -ray flux during the flare to the average -ray flux (), (4) the epoch of the maximum -ray flux (), (5) an indication of whether the -ray flare is contemporaneous with the VLBA observations (Yes/No), and (6) the number of superluminal ejections found during contemporaneous EGRET/VLBA observations (1993–1996). All together, we have identified 23 -ray flares (in 18 sources) that are contemporaneous with our VLBA observations.
3 Comparision of Epochs of Gamma-Ray Flares with Epochs of Superluminal Ejections
A comparison of epochs of -ray flares () with epochs of zero separation of superluminal components from the core () 111The “epoch of superluminal ejection” is the time of coincidence of the position of the moving feature with the core in the VLBA images, obtained from a linear least-squares fit to a plot of component-core separation vs. time. The entire list of epochs of superluminal ejections for all components detected during our monitoring is given in Table 5 of Jorstad et al. 2001. separates the sample of -ray flares into three groups. Group includes positive detections for which , where equals the 1 uncertainty of the epoch of zero separation. The marginal detections represent group , for which . Group (negative detections) contains those -ray flares that do not appear to be related to ejections of superluminal components according to the aforementioned criteria.
3.1 Group : Positive Detections
In 10 of 23 -ray flares the epochs of zero separation coincide, to within the 1 uncertainty, with the time of the -ray flares. The list of positive detections includes the sources 0336019 (CTA 26), 0528134, 0836710, 1222216, 1226023 (3C 273), 1622253, 1611343 (DA 406), and 1730130 (NRAO 530). For four of these sources (0528134, 0836710, 1226023, and 1611343) a connection between -ray activity and ejections of superluminal components was found previously based on different VLBI data (Britzen et al. 1999; Otterbein et al. 1998; Krichbaum et al. 1996; Piner & Kingham 1998). For quasar 1222216 we have only 2 epochs of VLBA observations, and therefore cannot determine the uncertainty of the epoch of zero separation; we adopt an error of 0.2 yr. In each of the quasars 0528134 and 1730130 two detected -ray flares were accompanied by superluminal ejections (see Fig. 2a). In the case of 1730130 the creation of both components appears to have been associated with flares in radio light curves (Bower et al. 1997).
3.2 Group : Marginal Detections
The list of marginal detections includes 6 sources: 0420014, 0440003 (NRAO 190), 0458020, 1219285 (ON 231), 1253055 (3C 279), and 1622297. In 1622297 the ejection of a superluminal component occurred slighly earlier than (note that in this case is smaller than usual). However, a very high level of -ray flux was observed one week before the maximum -ray emission (Mattox et al. 1997b); this indicates that the outburst was prolonged and started before .
3.3 Group : Negative Detections
The list of negative detections consists of 7 sources: 0827243, 0917449, 1101384 (Mkn 421), 1127145, 1219285 (ON 231), 1222216, and 1622253. Since we are testing the simplest hypothesis that all -ray flares correspond to superluminal ejections, we examine whether there is a possible explanation for each negative result in terms of observational uncertainties.
The last three of these sources each belongs to groups or as well, i.e. more than one -ray flare was detected and at least one high state of -ray flux was accompanied by a superluminal ejection. In the quasar 1222216 the -ray light curve contains two flares separated by an interval of one year; in our two VLBA images we detected one component associated with the first -ray outburst (see Table 1) and found a second component with a speed significantly faster than that of the first knot. This second component has an extrapolated time of zero separation from the core that is about two years later than the time of the second -ray flare. However, the proper motions are estimates based on only two images, hence the uncertainties in the times of zero separation could be much larger than our adopted value and the second component could be related to the second -ray outburst. Two of the three VLBA images of the BL Lac object 1219285, obtained at closely spaced epochs, show a significant change in the jet, but with such limited data we can not identify components unambiguously across epochs; hence, two different interpretations of proper motions are possible (see Fig. 21b in Jorstad et al. 2001). We adopt the lower proper motions, similar to those obtained previously by Gabuzda et al. (1994). In this case we find a connection between the -ray flare and a superluminal ejection that occurred in the first half of 1994 (see Fig. 2a) but no association of a moving component with the -ray outburst that took place about one year later. However, if we consider the higher possible values of the proper motions then contemporaneous VLBA data exist only for the second -ray flare, for which a component emerged from the core at 1995.10.2, within 1 uncertainty of the epoch of the second high state of -ray emission. In 1622253 the VLBA data show one moving component while the -ray light curve suggests two flares. However, the detected maxima of the flares differ in time by less than 0.3 yr. Although there are two measurements between these maxima yielding upper limits to the -ray emission similar to the average -ray flux, the flares might be part of a single, complex, energetic event.
Three 22 GHz images of 1127145 show a weak component merging with a bright stationary feature 4 mas from the core, with the moving knot appearing to decelerate during the last two epochs. Although our estimate of the time of zero separation is within 3 uncertainty of the epoch of the -ray flare, the apparent deceleration leads to a very large (1.4 yr) uncertainty for the former. Hence, we do not classify this case as a marginal correspondence despite its meeting our formal criterion (see Fig 2b). In Mkn 421 the jet components contain only a few percent of the total flux density and the jet appears approximately the same from one epoch to the next. It is therefore very difficult to determine the apparent speed of features in the jet and it is possible only to suggest the most likely interpetation. We have identified components in the way which produces apparent speeds 1.3–2 (Marscher 1999), while Piner et al. (2000) interpret the data in terms of only subluminal motion. In the latter case our VLBA observations would have taken place too early to resolve any component ejected during the -ray flare.
In the quasars 0827243 and 0917449 we have sufficient VLBA data to reveal the motion of components present in the jet. However, in the case of 0827243 the superluminal ejection nearest to the high state of the -ray flux occurred about 0.5 yr later than the -ray flare, with an uncertainty in the time of zero separaton of less than 0.1 yr. In 0917449 one moving component is detected but appears to have been ejected significantly earlier than the time of maximum -ray flux. Therefore, in these two cases we do not find any connection between the high state of -ray emission and jet activity.
3.4 Statistical Simulations
We have carried out numerical simulations in order to determine the probability of random coincidences between epochs of -ray flares and ejection of superluminal jet components. To do this, we generated 1,000,000 samples of 18 sources (the number of objects is equal to the number of blazars with contemporaneous EGRET/VLBA data) with -ray flare/superluminal ejection features identical to our observations. This means that for every source the number and epochs of -ray flares were set according to Table 1 and random epochs of superluminal ejections of VLBI components over the period of contemporaneous VLBA and -ray observations (1993-1996) were generated in a quantity corresponding to the number of superluminal ejections found during this period of observations (see Table 1). Therefore, each sample of 1,000,000 generated ones consisted of 18 sources with 31 random superluminal ejections to compare with 23 -ray flares with fixed epochs. A coincidence was registered in the same manner as for groups and of -ray bright blazars discussed above (1 and 3 criteria). Uncertainties of generated epochs of zero-separations are equal to the uncertainties of epochs of observed superluminal ejections; in the case of multiple ejections in a source the uncertainty of the first generated epoch equals the uncertainty of the earliest superluminal ejection for the source, the uncertainty of the second generated epoch is the same as for the next observed ejection and so on.
Fig. 1 presents histograms of the probability density functions of chance coincidences for 1 (intense shade) and 3 (light shade) registration criteria. (Note that the histograms do not overlap.) In the case of the 1 criterion the number of 9 chance coincidences has a probability less than 1.5%, and in no case out of five independent runs of the 1,000,000 simulation samples did chance coincidences occur for 10 of the sources in a sample. Therefore, our finding of 10 positive detections out of 23 -ray flares leads us to conclude that high -ray states and superluminal ejections are associated at 99.999% confidence level. This does not necessarily imply that all -ray flares and superluminal ejections in group are physically associated: an average of 5–6 such pairings is expected by chance given the uncertainties, especially, for uncertainties 0.5 yr. In the case of the 3 criterion the number of expected chance coincidences falls in the range from 12 to 17 events with a probability 92%; and the number of chance coincidences 16 (the number of coincidences which we have detected for our sample of -ray bright blazars with 3 criterion) occurs with 21% probability, too high to provide any meaningful constraints.
4 Discussion
Correlations between the emergence of new VLBI components and radio flares have been noted by many authors (e.g., Mutel, Denn, & Dryer 1994; Wagner et al. 1995; Wehrle et al. 1998). Furthermore, polarized intensity VLBI images of blazars reveal that superluminal knots are substantially polarized (Gabuzda & Cawthorne 1996; Lister, Marscher, & Gear 1998; Gómez, Marscher, & Alberdi 1999). Therefore, one should expect a correlation between the emergence of new VLBI components and flares in polarized radio flux and hence between high -ray states and increases in polarized radio flux if -ray flares are associated with superluminal ejections.
The University of Michigan Radio Astronomy Observatory database allows us to test for these expected correlations. Table 2 presents the parameters of the radio polarization for the positive and marginal -ray/superluminal ejection associations (Part I) as well as for the other -ray flares from Table 1 (negative detections or VLBA data that are not contemporaneous) for which the UMRAO database contains sufficient polarization data (Part II). The columns of Table 2 are as follows: (1) the source name; (2) the epoch of the -ray flare (); (3) the time of zero separation of the superluminal component from the core with 1 uncertainty (); (4) the frequency of the polarized radio flux density data (); (5) the maximum polarized flux density nearest to the time of the -ray flare (); (6) the epoch of the local maximum of polarized flux density (); (7) the nearest minimum polarized flux density before the local maximum of polarized flux density (); (8) the epoch of the first minimum of polarized flux density (); (9) the nearest minimum polarized flux density after the local maximum of polarized flux density (); and (10) the epoch of the second minimum of polarized flux density (). Fig. 2a presents -ray light curves and total as well as polarized radio light curves, along with indications of the epochs of the maxima in -ray flux and superluminal ejections for the positive and marginal detections (Groups and ), and Fig. 2b illustrates several examples for cases in Part II of Table 2. Although many of the polarized flux density light curves are noisy, it is apparent that, shortly after a superluminal ejection and -ray flare, a local maximum in polarized radio flux is observed.
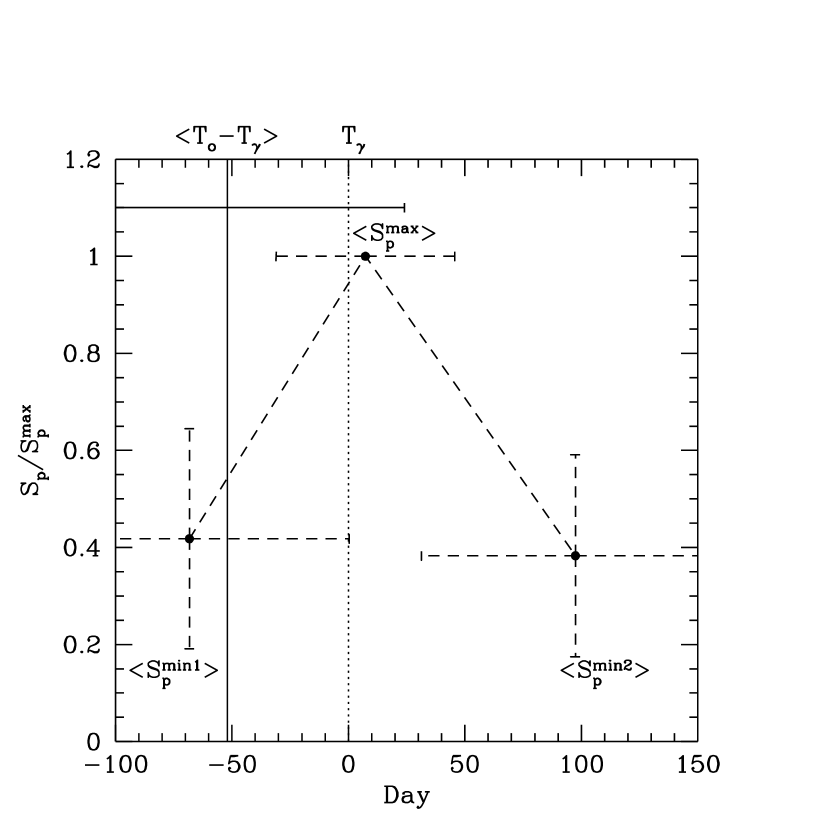
In order to relate the multifrequency data, we have calculated the differences between the epoch of each -ray flare and the time of superluminal ejection as well as maximum and minimum level of polarized flux density (, , , ). We then normalized the polarized flux densities in terms of the local maximum level for every case of positive and marginal associations of -ray flares and superluminal ejections (Groups and ). Finally, we averaged these values over the entire sample. The result is presented in Fig. 3a, which reveals the general pattern of behavior. A disturbance causes the appearance of a superluminal component near the time of minimum polarized flux density ( days). A -ray flare follows days later, occurring almost simultaneously with the local maximum of the polarized radio flux density ( days). During the outburst the polarized flux density nearly doubles () and returns to the initial quiescent state () 9866 days after the -ray flare. The entire duration of the combined event is 170135 days.
Similar calculations were performed for cases listed in Part II of Table 2, where no connection between -ray flares and superluminal ejections could be established but variability of the radio polarized flux density was observed (Fig. 3b). The scenario of the perturbation is very similar to that decribed above. The duration of the event is 172110 days, the first minimum of polarized flux density occurs 3052 days before a -ray flare, and the maximum polarized flux density occurs close to the time of the maximum -ray emission, with a delay of only 1520 days. The polarized flux density returns to the quiescent state 14257 days after the -ray flare.
The results given in Table 2 support the idea that the radio emission and the -rays originate within the same shocked region of the relativistic jet and that the -rays are most likely produced by inverse Compton scattering by the electrons in the jet far (typically parsecs) downstream of the putative accretion disk. The generalized diagrams (Fig. 3) lead us to propose a speculative model to explain the derived characteristics of such an event. An emerging jet component is cross-polarized with respect to the polarization of the VLBI core (e.g., in the quasar 3C 454.3; Gomez, Marscher, & Alberdi 1999); this results in a decrease of the total polarized flux density (the first minimum in polarized flux density) during the birth of the polarized component. Shortly after the local minimum of polarized flux density a superluminal ejection occurs. The standard model explains the VLBI component as a manifestation of a shock wave propagating through an underlying relativistic outflow (e.g., Marscher & Gear 1985). The shock front orders the magnetic field, hence the polarization increases when the front first becomes optically thin (the maximum in polarized flux density). (Evidence for this is found in the observed increase in the fractional linear polarization of four components in BL Lac as each knot separated from the core; Denn, Mutel, & Marscher 2000.) The -ray emission is caused by inverse Compton scattering in the thin forward layer of the shock, where electrons are accelerated. This high-energy emission is first detected somewhat downstream of the radio core.
The average delay of 52 days between the extrapolated time when the superluminal knot (which corresponds to the shocked plasma) is coincident with the radio core and the epoch of the -ray flare could correspond to the time required for (1) the shock to develop fully in terms of efficiency of accelerating electrons and compressing the magnetic field, (2) the bulk velocity of the shock to accelerate to its asymptotic value, (3) the Doppler factor of the shock to reach a maximum owing to the changing angle between the velocity vector and the line of sight as it travels through a bend in the jet, or (4) the synchrotron photons to travel across the shock to the scattering electrons (synchrotron self-Compton model only; see Marscher 2001). The large scatter in the difference between and indicates that there is significant variation among blazars, as one would expect to be the case at least for explanations (3) and (4) that depend sensitively on the angle between the jet axis and the line of sight. The near-coincidence between the peak in -ray flux and polarized radio flux density can most easily be accommodated by scenarios (1)–(3), since both the synchrotron and inverse Compton emissivities of the shock would vary together. The absence of a clear signature in the total radio flux density light curve could be caused by the core fading as the superluminal knot brightens, for example under the influence of a rerefaction in the wake of the shock (cf. Gómez et al. 1997).
The distance traveled by the disturbance between the zero-separation time and the peak in the -ray flux and polarized radio flux density, typically months, is given by , where and are, respectively, the bulk Lorentz factor and the Doppler factor of the disturbance. For typical values of apparent superluminal velocities of -ray blazars found by Jorstad et al. (2001) (for ), this corresponds to several parsecs. If the jet opening angle is , the transverse size of the emission region at this distance is of order 0.1 pc. The shortest timescale of variability should therefore be days, or typically days, where is a geometrical factor that allows for a line-of-sight thickness of the shock that is much less than the size in the sky plane (Marscher & Gear 1985). Under this scenario, the most rapid variations in the -ray flux observed by EGRET, on scales of day (e.g., Mattox et al. 1997b; Wehrle et al. 1998), represent extreme cases of high Doppler factors (the data of Jorstad et al. 2001 indicate values exceeding 30 in a number of sources) and/or values of that are significantly less than unity.
In the transverse shock model we should expect the magnetic field to become perpendicular to the jet axis when the front of the shock becomes optically thin (the maximum in polarized flux density). However, Lister, Marscher, & Gear (1998) found that the majority of the components in blazar jets observed at 43 GHz (sample of 8 sources) have oblique orientations of their electric vectors. Furthermore, Denn, Mutel, & Marscher (1999) reported no preferred orientation of the initial position angle of the electric vectors of superluminal components in BL Lac. Rather, they found a trend toward parallel alignment (perpendicular magnetic field) as components moved away from the core. To check whether similar behavior occurred in our sample, we list in Table 3 position angles of polarization for the sources from Table 2 for which polarization data are available with at least 1 determinations of the position angle of the electric vector. The columns of Table 3 are: (1) source name; (2) position angle (PA) of the jet on submilliarcsecond scales (); (3) frequency of the polarization data (); (4) position angle of the electric vector (EVPA) at the time of maximum polarized flux density (); (5) EVPA at the first minimum in polarized flux density (); (6) EVPA at the second minimum polarized flux density (); (7) orientation of the magnetic field with respect to the jet direction at the maximum polarized flux density (: transverse — difference between PA of the jet and EVPA 20∘; : parallel — difference between PA of the jet and EVPA 70∘; and : oblique — all other cases). No Faraday rotation measure (RM) corrections are applied to the observed EVPAs, since even the relative large RM for quasar 0458020 (170 rad m-2; Simard-Normandin, Kronberg, & Button 1981) produces a small Faraday rotation (5∘) at 15 GHz. Therefore, we take the orientation of the magnetic field to be essentially perpendicular to the observed EVPAs. Analysis of the data in Table 3 shows that in 9 out of 22 cases the magnetic field had an oblique orientation at the maximum polarized flux density; however, in the quasars 0458020 and 1510089 the magnetic field tended toward the transverse direction at the maximum compared with the first minimum of polarized flux density (when the magnetic field was also oblique). In 5 of 22 cases the magnetic field was almost perpendicular to the jet direction at the high state of polarized flux density and in the quasars 0440003 and 1611343 a significant change of EVPA between the maximum and second minimum of polarized flux density was observed. The remaining 8 cases showed parallel orientation of the magnetic field at both the minima and maximum in polarized flux density; this implies a strong underlying parallel magnetic field. These magnetic field orientations during the event are considerably more complex than one would expect from the transverse or moving oblique shock models: for the latter model Lister, Marscher, & Gear (1998) showed using numerical simulations that the distribution of EVPA misalignment angles should peak at low misalignment values. The cause of this discrepancy between theory and observation could be the overly simple nature of the transverse shock model. Numerical hydrodynamical simulations (e.g., Gómez et al. 1997) show that the structure of a relativistic shock is likely to be quite complex, including secondary shocks and trailing shocks and rarefactions.
5 Conclusion
Our study establishes a statistical association between the ejection of superluminal radio knots and high states of -ray emission in blazars. Our analysis of the delay between the time when a superluminal radio knot is coincident with the radio core and the epoch of the maximum observed -ray flux, along with an investigation of the variability of polarized radio flux density during the -ray flare, lead us to conclude that the radio and -ray events both originate within the same shocked area of the relativistic jet. This region is downstream of the core rather than between the core and the central engine, as had been supposed previously, consistent with the finding of Valtaoja & Teräsranta (1996) that -ray flares occur after the mm-wave flux starts to rise. The placing of the -ray emitting region downstream of the radio core strongly supports inverse Compton models for the origin of the -rays. The electrons accelerated in the shocks (which also correspond to superluminal radio knots) scatter photons that originate either within the shocked region or from a site external to the jet (e.g., the emission-line clouds; Sikora, Begelman, & Rees 1994). Our results, on the other hand, conflict with models in which the -rays are produced in the intense radiation environment close to the putative accretion disk.
The relations between the times of radio and -ray events presented here are rather rough owing to incomplete time coverage in both the -ray light curves and the VLBA observations. Our statistical associations therefore should be verified through better time sampling of the -ray light curves of more blazars, coupled with regular, closely spaced VLBA observations. The authors hope that a concerted effort can be carried out with the VLBA when the planned GLAST -ray mission provides well-sampled monitoring of the -ray fluxes of hundreds of blazars.
References
- (1) Bower, G. C., Backer, D. C., Wright, M., & Forster, J. R. 1997, ApJ, 484, 118
- (2) Britzen, S., et al. 1999, A&A, 341, 418
- (3) Denn, G. R., Mutel, R. L., & Marscher, A. P. 2000, ApJS, 129, 61
- (4) Gabuzda, D. C. & Cawthorne, T. V. 1996, MNRAS, 283, 759
- (5) Gabuzda, D. C., Mullan C. M., Cawthorne, T. V., Wardle, J. F. C., & Roberts, D. H. 1994, ApJ, 435, 140
- (6) Gómez, J. L., Marscher A. P., & Alberdi, A. 1999, ApJ, 522, 74
- (7) Gómez, J. L., Martí, J. M., Marscher, A. P., Ibáñez, J. M., & Alberdi, A. 1997, ApJ, 482, L33
- (8) Hartman, R. C., et al. 1999, ApJS, 123, 79
- (9) Jorstad, S. G., et al. 2001 ApJS, 134, in press
- (10) Krichbaum, T. P., et al. 1996, in Proceedings of the Heidelberg Workshop on Gamma-Ray Emmiting AGN, ed. J. G. Kirk, M. Camenzind, C. von Montigny, & S. Wagner, MPI-preprint MPI H - V37 - 1996, 96
- (11) Krichbaum, T. P., et al. 1995, in Quasars and Active Galactic Nuclei: High Resolution Radio Imaging, ed. M. H. Cohen, & K. I. Kellermann, Proc. Nat. Acad. Sci., 92, 11377
- (12) Lähteenmäki, A., Valtaoja, E., & Tornikoski, M. 1999, in The Fifth Compton Symposium, ed. M. L. McConnell & J. M. Ryan, AIP Conf. Proceedings, 510, 372
- (13) Lister, M. L., Marscher, A. P., & Gear, W. K. 1998, ApJ, 504, 702
- (14) Marscher, A. P. 2001, in Probing the Physics of Active Galactic Nuclei by Multiwavelength Monitoring, ed. B. M. Peterson, R. S. Polidan, & R. W. Pogge, ASP Conf. Ser., 224, 23
- (15) Marscher, A.P. 1999, Astroparticle Physics, 11, 19
- (16) Marscher, A. P., & Gear, W. K. 1985, ApJ, 298, 114
- (17) Mattox, J. R., et al. 2001 ApJ, in press
- (18) Mattox, J.R., Schachter, J., Molnar, L., Hartman, R.C., & Patnail, A.R. 1997a, ApJ, 481, 95
- (19) Mattox, J. R., et al. 1997b, ApJ, 476, 692
- (20) McGlynn, T. A., et al. 1997, ApJ, 481, 625
- (21) Mutel, R.L., Denn, G.R., & Dryer, M.J. 1994, in NRAO Workshop 23, Compact Extragalactic Radio Sources, ed. J. A. Zensus & K. I. Kellermann, (Green Bank: NRAO), 191
- (22) Otterbein, K., et al. 1998, A&A, 334, 489
- (23) Piner, et al. 1999, ApJ, 525, 176
- (24) Piner, B. G. & Kingham, K. A. 1998, ApJ, 507, 706
- (25) Simard-Normandin, M., Kronberg, P. P., & Button, S. 1981, ApJS, 421, 153
- (26) Sikora, M., Begelman, M. C., & Rees, M. J. 1994, ApJ, 421, 153
- (27) Valtaoja, E. & Teräsranta, H. 1996, A&AS, 120, 491
- (28) Wagner, S. J., et al. 1995, A&A, 298, 688
- (29) Wehrle, A. E., et al. 1998, ApJ, 497, 178
- (30) Wehrle, A. E., Zoock, A. C., & Unwin S. C. 1994, The Multimission Perspective (Eureka Scientific: Napa Valley, CA), 27
| Source | Contemporaneous | Number of | |||
|---|---|---|---|---|---|
| [phot cm-2 s-1] | VLBA obs.? | Ejections | |||
| 0202149 | 2120 | 2.5 | 1992.315 | No | |
| 0235164 | 3020 | 2.2 | 1992.185 | No | |
| 0336019 | 3474 | 5.3 | 1995.266 | Yes | 2 |
| 0420014 | 2723 | 1.9 | 1992.185 | No | 1 |
| 2.4 | 1995.622 | Yes | |||
| 0440003 | 2826 | 3.1 | 1994.632 | Yes | 1 |
| 0458020 | 2121 | 3.2 | 1994.212 | Yes | 1 |
| 0528134 | 8978 | 1.7 | 1991.315 | No | 4 |
| 3.9 | 1993.233 | Yes | |||
| 1.4 | 1995.373 | Yes | |||
| 0716714 | 2012 | 2.3 | 1992.197 | No | |
| 0827243 | 3736 | 3.0 | 1994.160 | Yes | 1 |
| 0836710 | 189 | 1.9 | 1992.197 | Yes | 1 |
| 0917449 | 219 | 1.9 | 1994.190 | Yes | 1 |
| 1101384 | 177 | 1.6 | 1994.367 | Yes | 2 |
| 1127145 | 2717 | 2.3 | 1993.024 | Yes | 1 |
| 1156295 | 2726 | 6.1 | 1993.024 | No | |
| 1219285 | 2117 | 1.6 | 1992.984 | No | 3 |
| 1.5 | 1994.367 | Yes | |||
| 2.6 | 1995.334 | Yes | |||
| 1222216 | 2114 | 2.3 | 1992.984 | Yes | 1 |
| 2.1 | 1993.964 | Yes | |||
| 1226023 | 2214 | 2.2 | 1993.899 | Yes | 2 |
| 1253055 | 5248 | 5.1 | 1991.474 | No | 3 |
| 2.0 | 1993.879 | Yes | |||
| 1406076 | 4036 | 3.2 | 1993.008 | No | |
| 1510089 | 3112 | 1.6 | 1992.260 | No | |
| 1606106 | 3516 | 1.8 | 1991.964 | No | |
| 1611343 | 3623 | 1.9 | 1994.841 | Yes | 1 |
| 1622253 | 4121 | 1.9 | 1995.460 | Yes | 1 |
| 2.0 | 1995.729 | Yes | |||
| 1622297 | 6899 | 4.7 | 1995.460 | Yes | 3 |
| 1633382 | 5333 | 2.0 | 1991.707 | No | |
| 1730130 | 4830 | 1.7 | 1994.553 | Yes | 2 |
| 2.2 | 1995.510 | Yes | |||
| 2230114 | 3013 | 1.7 | 1992.647 | No | |
| 2251158 | 5229 | 2.2 | 1992.647 | No |
| Part | Source | |||||||||
|---|---|---|---|---|---|---|---|---|---|---|
| [GHz] | [mJy] | [mJy] | [mJy] | |||||||
| I | 0336019 | 1995.266 | 1995.10.2 | 8.0 | 13760 | 1995.361 | 3116 | 1995.131 | 2927∗ | 1995.415 |
| 0420014 | 1995.622 | 1995.30.1 | 14.5 | 20818 | 1995.432 | 7516 | 1994.989 | 9416 | 1995.760 | |
| 0440003 | 1994.632 | 1994.20.2 | 14.5 | 202101 | 1994.740 | 913∗ | 1994.656 | 1813∗ | 1994.828 | |
| 0458020 | 1994.212 | 1994.00.1 | 14.5 | 8949 | 1994.333 | 3011 | 1994.033 | 2313 | 1994.705 | |
| 0528134 | 1993.233 | 1993.21.6 | 4.8 | 2916 | 1993.257 | 125 | 1992.721 | 57∗ | 1993.926 | |
| 1995.373 | 1995.50.1 | 4.8 | 2611 | 1995.213 | 66∗ | 1995.145 | 107 | 1995.792 | ||
| 0836710 | 1992.197 | 1992.10.3 | 14.5 | 13824 | 1992.203 | 11716 | 1992.034 | 4815 | 1992.274 | |
| 1219285 | 1994.367 | 1994.00.2 | 14.5 | 7914 | 1994.414 | 2413 | 1994.346 | 1617 | 1994.706 | |
| 1222216 | 1992.984 | 1993.10.2 | no data | |||||||
| 1226023 | 1993.899 | 1993.70.3 | 14.5 | 1810106 | 1994.031 | 1249108 | 1993.837 | 137963 | 1994.165 | |
| 1253055 | 1993.879 | 1993.50.2 | 14.5 | 38356 | 1993.995 | 13238 | 1993.837 | 27259 | 1994.031 | |
| 1611343 | 1994.801 | 1995.31.4 | 14.5 | 12321 | 1994.854 | 5312 | 1994.209 | 3421 | 1995.073 | |
| 1622253 | 1995.729 | 1996.00.3 | no data | |||||||
| 1622297 | 1995.460 | 1995.10.1 | no data | |||||||
| 1730130 | 1994.553 | 1994.60.2 | 8.0 | 29727 | 1994.575 | 14616 | 1994.382 | 16185 | 1994.605 | |
| 1995.510 | 1995.50.1 | 14.5 | 35619 | 1995.431 | 26419 | 1995.390 | 17521 | 1995.742 | ||
| II | 0202149 | 1992.315 | 8.0 | 14023 | 1992.486 | 2933∗ | 1992.399 | 1318∗ | 1992.579 | |
| 0235164 | 1992.185 | 14.5 | 5119 | 1992.200 | 2318 | 1992.104 | 2027∗ | 1992.208 | ||
| 0716714 | 1992.197 | 14.5 | 5017 | 1992.203 | 1327∗ | 1991.732 | 824∗ | 1992.492 | ||
| 1101384 | 1994.367 | 14.5 | 5117 | 1994.367 | 916∗ | 1994.345 | 419∗ | 1994.501 | ||
| 1127145 | 1993.024 | 8.0 | 13427 | 1993.056 | 8620 | 1992.913 | 8919 | 1993.160 | ||
| 1156295 | 1993.024 | 14.5 | 8316 | 1993.026 | 2417 | 1993.000 | 3714 | 1993.542 | ||
| 1510089 | 1992.260 | 14.5 | 13061 | 1992.272 | 6816 | 1992.231 | 5616 | 1992.373 | ||
| 1606106 | 1991.964 | 8.0 | 4154∗ | 1992.051 | 3619 | 1991.834 | 2423∗ | 1992.157 | ||
| 2230114 | 1992.647 | 14.5 | 7815 | 1992.666 | 2913 | 1992.573 | 4818 | 1992.745 | ||
| 2251158 | 1992.647 | 14.5 | 26679 | 1992.748 | 15120 | 1992.620 | 17036 | 1992.805 |
Note. — entries for denoted with () are the upper limits of polarized flux density detections
| Part | Source | Orientation of | |||||
|---|---|---|---|---|---|---|---|
| [∘] | [GHz] | [∘] | [∘] | [∘] | Mag.Field | ||
| I | 0336019 | 45 | 8.0 | 1497 | 14122 | ||
| 0420014 | 160 | 14.5 | 943 | 1307 | 1115 | ||
| 0440003 | 123 | 14.5 | 7212 | 4516 | |||
| 0458020 | 7 | 14.5 | 2615 | 4713 | 4214 | ||
| 0528134 | 61 | 4.8 | 11113 | 12411 | |||
| 4.8 | 1239 | 11317 | |||||
| 0836710 | 140 | 14.5 | 1114 | 1043 | 1128 | ||
| 1219285 | 102 | 14.5 | 634 | 5413 | |||
| 1226023 | 108 | 14.5 | 1501 | 1442 | 1491 | ||
| 1253055 | 115 | 14.5 | 694 | 767 | 636 | ||
| 1611343 | 173 | 14.5 | 13 | 76 | 12614 | ||
| 1730130 | 17 | 8.0 | 802 | 803 | 877 | ||
| 14.5 | 931 | 1032 | 843 | ||||
| II | 0202149 | 32 | 8.0 | 744 | |||
| 0235164 | 0 | 14.5 | 12311 | 2422 | |||
| 0716714 | 10 | 14.5 | 249 | ||||
| 1101384 | 25 | 14.5 | 1299 | ||||
| 1127145 | 86 | 8.0 | 1606 | 16710 | 1585 | ||
| 1156295 | 0 | 14.5 | 1494 | 17019 | 16110 | ||
| 1510089 | 32 | 14.5 | 11513 | 907 | 688 | ||
| 2230114 | 132 | 14.5 | 1155 | 12314 | 10710 | ||
| 2251158 | 66 | 14.5 | 318 | 243 | 176 |