Storage ring measurement of the C IV recombination rate coefficient
Abstract
The low energy C IV dielectronic recombination (DR) rate coefficient associated with 2s2p excitations of this lithiumlike ion has been measured with high energy-resolution at the heavy-ion storage-ring tsr of the Max-Planck-Institut für Kernphysik in Heidelberg, Germany. The experimental procedure and especially the experimental detection probabilities for the high Rydberg states produced by the recombination of this ion are discussed in detail. From the experimental data a Maxwellian plasma rate coefficient is derived with systematic uncertainty and parameterized for ready use in plasma modeling codes. Our experimental result especially benchmarks the plasma rate coefficient below K where DR occurs predominantly via C III(1s22p4l) intermediate states and where existing theories differ by orders of magnitude. Furthermore, we find that the total dielectronic and radiative C IV recombination can be represented by the incoherent sum of our DR rate coefficient and the RR rate coefficient of Pequignot et al. (1991, Astron. Astrophys., 251, 680).
1 Introduction
Carbon is one of the cosmically most abundant elements. Consequently, line emission from carbon ions is observed from a wide range of cosmical objects. In low density, photoionized and electron-ionized cosmic plasmas the dominant mechanisms for recombination are radiative recombination (RR) and dielectronic recombination (DR). For C IV these processes can be expressed as
| (1) |
and
| (2) |
respectively. In low energy C IV DR the ion is excited by a transition (excitation energy eV) only within the shell. At higher energies above 37.55 eV, the electron can be excited to substates (). The lowest-energy resonances of the associated DR series with configurations of C III are at energies above about 12 eV. The strengths of these resonances can be expected to be very much smaller than those associated with core transitions. The K-shell cannot be excited with energies smaller than 240 eV. In this paper we exclusively deal with DR.
The calculation of DR rate coefficients is a challenging task since an infinite number of states is involved in this process. Moreover, relativistic and many-body effects have to be accounted for in high orders even in the case of DR of a light ion such as C IV (Mannervik et al., 1998). Approximations and computational simplifications are needed in order to make DR calculations tractable. It turns out that different calculations yield rate coefficients differing by up to orders of magnitude. In this situation benchmarking experiments are vitally needed in order to guide the development of the theoretical methods and to provide reliable DR rate coefficients for plasma modelers. For C IV the available theoretical rate coefficients have recently been critically compared by Savin (2000).
In the past decade electron coolers at heavy-ion storage rings have developed into the most successful experimental tool for electron-ion recombination studies (Schuch, 1993; Müller & Wolf, 1997). Currently, corresponding research programmes are carried out at the heavy ion storage rings esr of the Gesellschaft für Schwerionenforschung (GSI) in Darmstadt (Brandau et al., 1997), tsr of the Max-Planck-Institut für Kernphysik in Heidelberg (Müller et al., 1997, 1998; Wolf et al., 2000) and cryring of the Manne-Siegbahn-Laboratory in Stockholm (Schuch et al., 1997, 1998). Extensive bibliographic compilations on DR measurements at storage rings have been published e.g. by Müller (1995) and Schippers (1999). The basic approach for deriving plasma rate coefficients from storage-ring measurements has been summarized by Müller (1999). Recent experimental work on plasma rate coefficients for astrophysical and other plasma applications has been published by Savin et al. (1997, 1999) on DR of Fe XVIII and Fe XIX, by Schippers et al. (1998) on DR of Ti V and by Schippers et al. (2000) on DR of Ni XXVI.
In this paper we present the measured C IV recombination rate coefficient. It is organized as follows. In Sec. 2 the experimental procedure is described. Particular attention is given to the field ionization of high- Rydberg states in motional electric fields that are unavoidable with the experimental arrangement at an ion storage-ring. In Sec. 3 the experimental result is presented and the impact of field ionization on the measured DR resonance strength is discussed. A theoretical estimate of the unmeasured DR rate is presented, and the C IV plasma DR rate coefficient is derived. In Sec. 4 it is compared to existing theoretical results. Finally, in Sec. 5 we derive the total DR+RR C IV rate coefficient and compare it to a unified calculation of Nahar & Pradhan (1997). A model calculation of -selective detection probabilities for recombined ions in high- Rydberg states, that takes the field ionization properties of our experimental apparatus into detailed account, is presented in appendix A.
2 Experiment
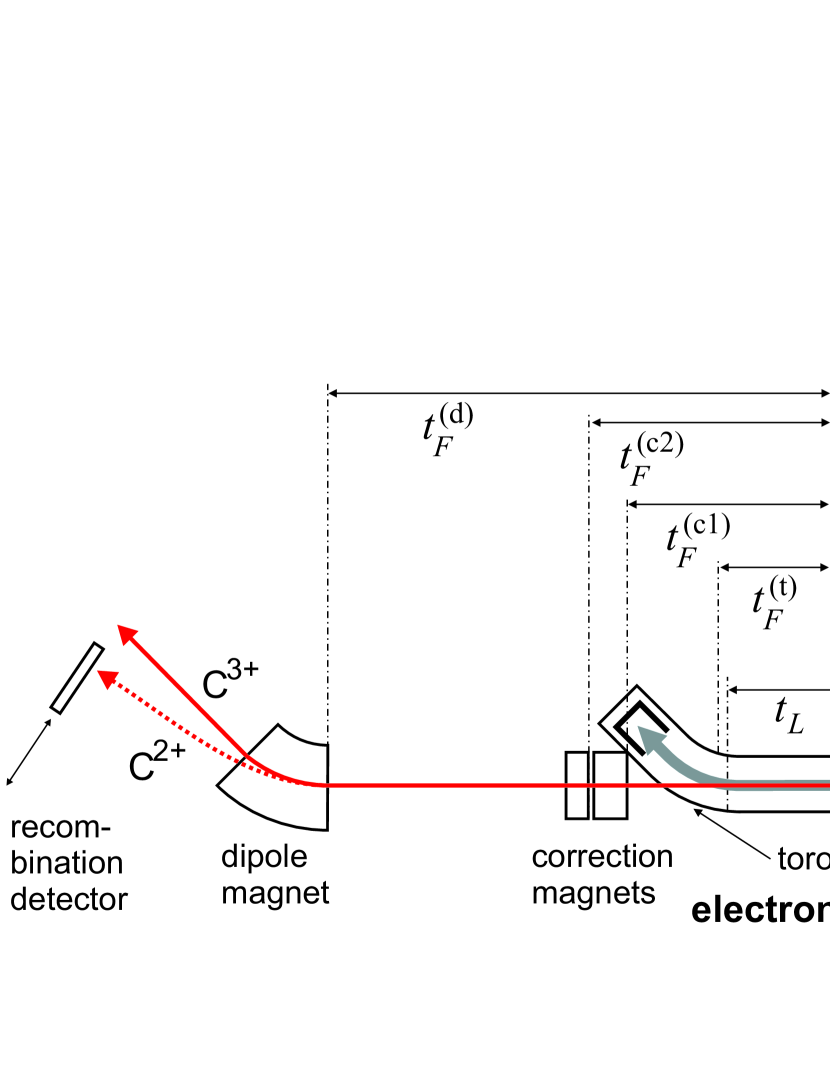
The C IV recombination measurements have been performed at the heavy-ion storage ring tsr (Jaeschke et al., 1989) of the Max-Planck-Institut für Kernphysik in Heidelberg, basically following the procedure of earlier measurements (Kilgus et al., 1992; Lampert et al., 1996). A beam of 12C3+ ions at an ion energy MeV/u was supplied by the MPI accelerator facility and injected into the tsr. In the tsr electron cooler, situated in one of the straight sections of the storage ring (cf. Fig. 1), the circulating C3+ ions were merged with a beam of electrons moving collinearly with the ions at roughly identical velocity. At matched beam velocities the electron beam had an energy eV. It was merged with the ion beam over a length of 1.5 m and was guided by a longitudinal magnetic field of 42 mT over its entire path. The electron density was cm-3 depending on the laboratory electron energy . The electron beam’s diameter was 3 cm. Electron cooling, i.e., the ion interaction with the overlapping electron beam, on a time scale of s compresses the circulating ion beam to a diameter of 1–2 mm; simultaneously the longitudinal velocity of the freely coasting ions adjusts itself to the average electron velocity. By repeated injections, while keeping the cooled beam stored, C3+ ions were accumulated (Grieser et al., 1991) on a time scale of s up to electrical currents of typically 30 A, corresponding to stored ions.
After ion accumulation, recombination rates of C3+ ions were measured by counting recombined C2+ ions on a multi-channelplate detector located behind the first dipole magnet (bending radius 115 cm) downstream of the electron cooler (see Fig. 1). The dipole magnet keeps the circulating C3+ ion beam on a closed orbit while it deflects the recombined C2+ ions less strongly so that they hit the detector. Absolute rate coefficients for the recombination of C3+ ions with electrons in the collinear overlap region were measured as a function of the average relative energy
| (3) |
between electron and ion beam. The relativistically correct expression (see e.g. Schippers et al., 2000) has been used in the data analysis. The laboratory electron energy was deduced from the cathode voltage and electron current applying a correction for the electron space-charge (Kilgus et al., 1992).
The electron motion in the transverse degrees of freedom, confined by the magnetic field, is largely decoupled from that in longitudinal direction. In a co-moving reference frame, the electron velocity spread is characterized by the longitudinal and transverse temperatures and with meV and meV ( denotes the Boltzmann constant). Both temperatures are considerably lower than the cathode temperature, the low longitudinal temperature resulting from the electron acceleration and the low transverse temperature resulting from adiabatic magnetic expansion of the electron beam (Pastuszka et al., 1996). The electron velocity distribution is represented by
| (4) |
The experimental energy resolution corresponds to the width of this distribution and amounts to (Müller, 1999)
| (5) |
As has been demonstrated by Bartsch et al. (1999, 2000) and Schippers et al. (2000), DR rate coefficients can considerably be influenced by external electric and additional crossed magnetic fields in the TSR electron-cooler. Therefore, care has been taken to minimize such fields in the interaction region. Additional to the magnetic field of 42 mT only small electric stray fields are present in the interaction region. Components of the magnetic field transverse to the ion velocity produce motional electric fields in the ion rest frame amounting to 2 V/cm for the estimated maximum field angles of about 0.3 mrad. Small stray fields are also expected from the electron space charge (Kilgus et al., 1992). By monitoring the velocity of the stored, electron-cooled ion beam, the ions are centered within the electron beam to about mm. For aligned electron and ion beams the electric space-charge field remains below 1 V/cm over the ion beam cross section of mm diameter. Altogether, electric stray fields below 3 V/cm are estimated. Considering the findings by Bartsch et al. (1999, 2000) and Schippers et al. (2000), we conclude that a reasonably ’field-free’ DR measurement can be carried out under these conditions.
Before their detection the recombined C2+ ions have to travel through the toroid magnet that guides the electron beam out of overlap, through correction dipoles, quadrupoles, and through the deflection dipole that separates them from the stored C3+ beam (Fig. 1). All these components cause transverse magnetic fields considerably higher than those in the interaction region, leading to motional electric fields that can field-ionize recombined ions in highly excited states. Since a sizable fraction of recombined ions is expected to be formed in highly excited states, the efficiency of their detection needs particular consideration. Recombined ions that reach a zone of large motional electric fields in sufficiently excited states will be field ionized and hence cannot be detected; however, ions formed in highly excited states that are able to decay radiatively to lower levels before reaching the critical field region will still be detected. At the given measuring conditions, the 1.5-m nominal length of the interaction region corresponds to a flight time of 87 ns. The motional electric field rises to 4 kV/cm in the toroid after a flight time of ns, depending on the location along the interaction path where the recombination takes place. Two correction magnets with peak fields of 6 kV/cm and kV/cm, are reached after ns and ns, respectively, and the deflection dipole with a peak field of 106 kV/cm after ns. The critical quantum number for field ionization of an ion in an electric field is estimated from (Gallagher, 1994)
| (6) |
where is the charge of the ion core and is measured in atomic units (1 au = V/cm). For C the core charge state is and thus the critical quantum number is for kV/cm. On the other hand, the radiative lifetime of the level in C2+ is 16 ns (hydrogenic value) and hence considerably shorter than the 275 ns flight time from the center of the cooler to the charge analysing dipole magnet. The detection probability for recombination events leading to high Rydberg levels will therefore depend on the competition between the radiative decay and the flight time to regions where motional electric fields are present. Reciprocally, the experimental setup offers a detection probability near unity for all recombination events leading into states with principal quantum numbers at least up to about 20.
With a cooled and accumulated beam of C3+ ions of typically 30 A freely circulating in the ring, measurements of the recombination rate were performed by stepping the acceleration voltage in the electron cooler to values different from those at cooling for short time intervals and recording the detector count rate after the acceleration voltage had settled to a stable value. In sequence, the acceleration voltage was set to the value required to obtain the desired relative energy where the recombination rate coefficient was to be measured, and then to a value producing a fixed, high relative energy where the count rate of C2+ ions was dominated by capture in the residual gas and where a background rate was measured. The corresponding time intervals will be called ‘signal’ and ‘reference’ windows, respectively. The settling time was 0.5 ms and the measuring time at a given acceleration voltage was typically 20 ms. After the signal and reference intervals the acceleration voltage was stepped back to the cooling value and kept there for 30 ms to ensure a fixed ion energy and a well-cooled ion beam for each measurement. Measurement cycles were repeated scanning the acceleration voltage level applied during the ‘signal’ window. A scan comprising 420 data points took s and during that time the stored C3+ ion current decreased only slightly; the ion current was restored by ‘stacking’ a few new injections and several such scans were repeated until the desired integral ion counts were collected for the recombination spectrum. Our experimental range of relative energies (0–10.5 eV) was covered by three overlapping scans.
The raw data consist of time correlated ‘signal’ and ‘reference’ count rates and for each value of the laboratory electron energy reached during the scans. Both rates include the background from electron capture of C3+ ions in the residual gas, and since they are measured in time windows only milliseconds apart the background is expected to cancel in the difference even in the case of variations of the residual gas pressure on a time scale as fast as seconds. After conversion to the scale of relative energies, , the energy dependent recombination rate coefficient is obtained through
| (7) |
where and denote the electron density and the number of stored ions, respectively, m is the nominal length of the interaction region, and m is the circumference of the storage-ring. At the relatively high experimental ion energy the efficiency of the channelplate recombination detector can be assumed to be . The factor accounts for the relativistic transformation between laboratory and center-of-mass frames. The second term in Eq. (7) is a small correction that re-adds the electron-ion recombination rate at the reference point. With a suitably chosen reference point — eV in the present case — this rate is due to RR only. Here it is calculated using a modified semi-classical formula for the RR cross section [see Eq. (11) below] to be cm3s-1. Since this is only a small correction to the experimental data at lower energies the insertion of a rough theory value is justified.
In the toroidal magnetic sections of the electron cooler the electron beam was guided in and out of the interaction region on two 45∘-bends with a radius of 80 cm (cf. Fig. 1). In each of these sections, the ion beam continues to interact with the electron beam at increasing angles between the two beams and thus shifted relative energies over regions of cm length each. From the known geometry, corrections for these merging regions are included in the data evaluation (Lampert et al., 1996).
The experimental collision energy () scale is known under the conditions of the present measurement within a systematic relative error of about 1%; even higher energy accuracies were reached after a precise adjustment of the energy scale to known spectroscopic Rydberg series limits (see below). The systematic uncertainty in the absolute recombination rate coefficient is estimated to be , where the dominant errors are due to the ion and electron current determination and the detection efficiency. The influence of the inaccurate knowledge of the effective overlap length is strongly reduced by the toroid correction (Lampert et al., 1996). The statistical uncertainty of the results presented below amounts to less than in the rate coefficient maximum.
3 Results
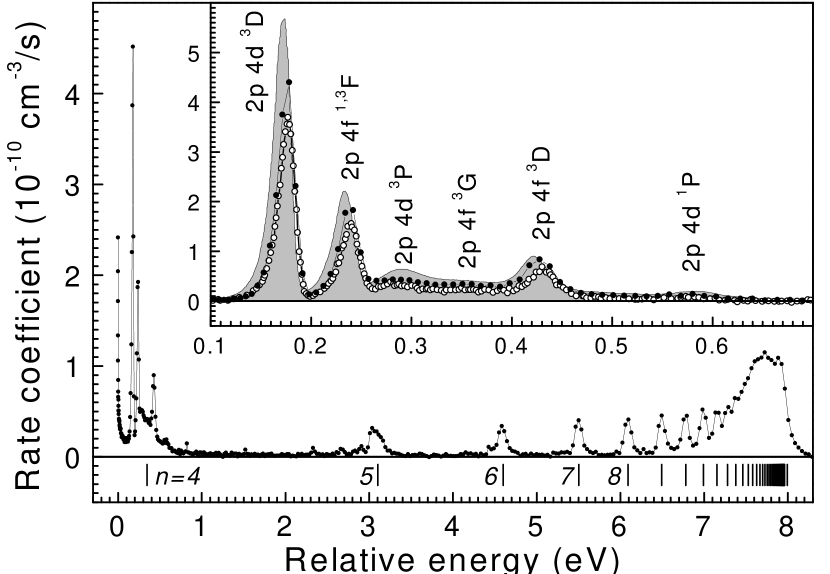
Our experimental C IV rate coefficient comprising RR and DR contributions is displayed in Fig. 2. The RR peak at eV and individual members of the Rydberg series of DR resonances are resolved for . As the splitting in C IV amounts to only 0.013 eV (Edlén, 1983), it is not possible to observe two separate Rydberg series with the given experimental resolution, in contrast to measurements on heavier lithiumlike ions (Kilgus et al., 1992; Schippers et al., 2000; Bartsch et al., 2000). The series limit corresponding to the excitation energy was determined by extrapolating the observed Rydberg resonance positions from to infinite . In Fig. 2 and throughout the paper we have adjusted the collision energy () scale by multiplying it with a constant factor differing from unity by 0.65%, which brings the extrapolated series limit in agreement with the spectroscopic value of 8.005 eV (Edlén, 1983).
In order to obtain the C IV DR rate coefficient, the RR contribution has been removed from the spectrum of Fig. 2 by subtracting an empirical function from the experimental rate coefficient with the coefficients determined by fitting to those parts of the spectrum which do not exhibit DR resonances. The corresponding energy intervals which have been used in the fit were 0.021–0.1 eV, 1.0–2.0 eV and 8.5–10.5 eV. The parameters obtained from the fit are cm3s-1, cm3s-1eV-1, cm3s-1, eV-1 and eV-2. With these parameters is defined in the range 0.0021 eV10.5 eV.
In the inset of Fig. 2 we compare the part of the DR spectrum that comprises the resonances with the measurement of Mannervik et al. (1998) carried out at the heavy-ion storage ring cryring in Stockholm. The published C IV cryring data only extend to eV. For the comparison we have removed the RR background from the present and from the cryring measurement by using the procedure described above. The comparison shows that the two measurements have a similar energy resolution. The overall shape of the spectrum and the peak positions are almost the same. However, when integrating over the 0.1–0.7 eV energy range we obtain for the manifold the resonance strength eVcm3s-1 and eVcm3s-1 from the cryring and from the present tsr measurements, respectively. This difference is just within the 30 summed uncertainty (15 for each experiment individually, assuming a similar systematic uncertainty for the cryring measurement as for the present one) for the absolute value of the measured rate coefficient. Our value is somewhat closer to the theory value eVcm3s-1 of Mannervik et al. (1998).
For the derivation of a meaningful plasma rate coefficient from our experimental data we have to estimate how much DR strength is not measured due to the cut-off of high Rydberg states in the electric fields on the recombined ions’ path from the cooler to the detector. To this end we have carried out C IV DR calculations using the atomic structure code autostructure (Badnell, 1986). In order to be able to compare the calculated DR cross section with our measured rate coefficient, we have performed the convolution
| (8) |
where we have used the electron velocity distribution of Eq. (4) with meV and meV. In Eq. (8) is the -specific detection probability of a recombined ion with the outer electron being in a Rydberg state characterized by the quantum numbers and . Correspondingly, denotes the cross section for DR via this Rydberg state. When comparing the resonance strengths of the individually resolved DR resonances with we find that the calculation yields values that are on the average a factor 1.25 higher than the experimental ones. Therefore we have scaled down the calculation by a factor 0.8. Additionally, the theoretical energy scale has been adjusted by shifting it by 0.06 eV towards higher energies such that the spectroscopic value for the series limit is reproduced.
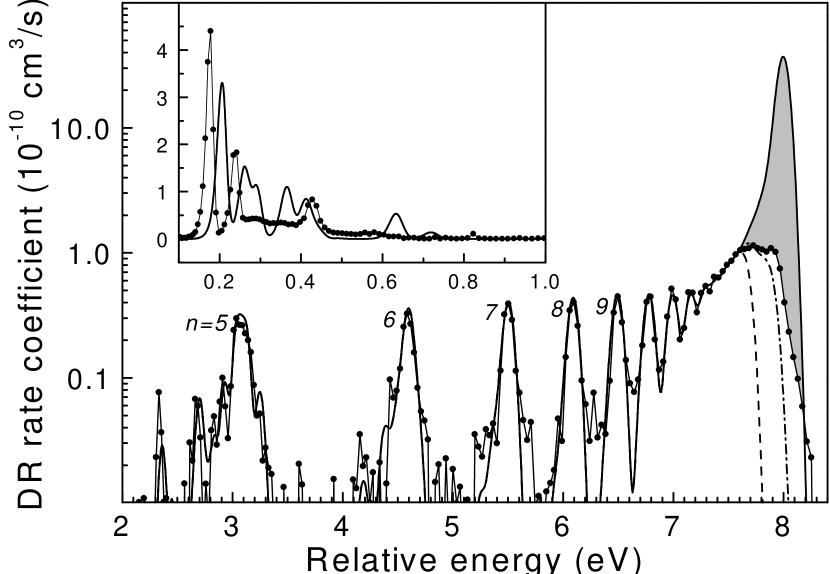
The comparison between our scaled autostructure calculation and our experimental result is shown in Fig. 3. The different curves correspond to different assumptions for the detection probabilities of high Rydberg states. The full line has been obtained by setting for all up to which is the maximum used in the calculation. By inclusion of such high- states we have made sure that the calculation has converged, i.e., calculations up to and yield rate coefficients which are undistinguishable from one another. It is obvious that the larger fraction of the resonance strength due to DR via high Rydberg states has not been measured. It should be noted that this effect becomes much less significant for DR on more highly charged ions where comparatively less DR strength is accumulated in high- DR resonances (see eg. Savin et al., 1997, 1999; Schippers et al., 1998, 2000). Moreover, Rydberg electrons are more tightly bound in highly charged ions and hence require stronger fields to become ionized in the charge analyzing field of the apparatus.
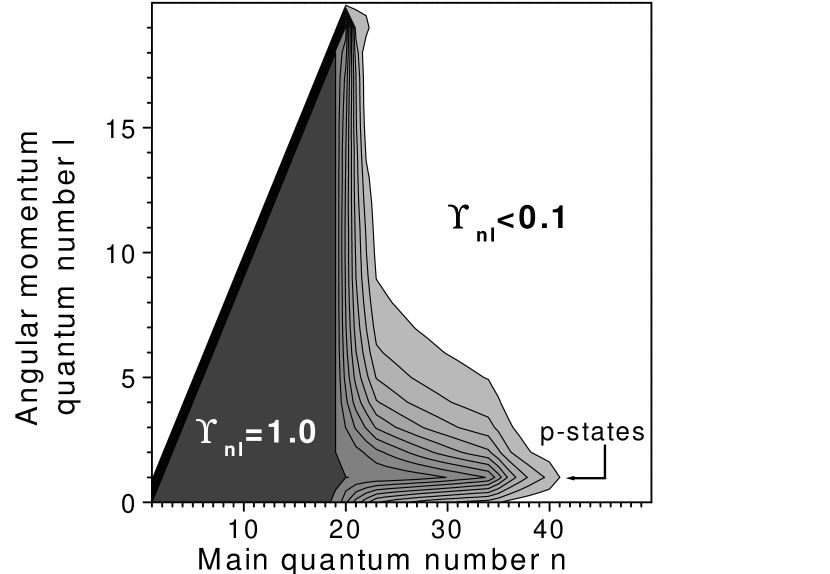
The simple picture of a hard cut-off at , as derived in Sec. 2, is not a good description of the field ionizing properties of our apparatus. This can be seen from the comparison of the experimental data with the dashed curve in Fig. 3 which has been obtained with for and for . A detailed model which takes into account radiative decay of higher Rydberg states on the way from the cooler to the field ionization magnet is described in appendix A. This model delivers the -specific detection probabilities plotted in Fig. 4. Via Eq. (8) they yield the dash-dotted curve in Fig. 3. Apparently, the contributions from Rydberg states with to the measured rate coefficient are not negligible. Fig. 4 indicates that the main contribution from these high- Rydberg manifolds is by the short-lived states. On the other hand, the cut-off of Rydberg states with in the toroid (cf. Tab. 2) has a decisive influence on the detection probabilities since the time available for the radiative decay of higher- states to below is too short (see appendix A). The remaining discrepancy between the outcome of the detailed model and the measured DR spectrum for very high Rydberg states is attributed to model inherent simplifications. For example, very high- states are easily perturbed by even small stray fields possibly leading to enhanced radiative decay rates for -states due to -mixing within -manifolds especially in the field-ionization regions. Such effects are not taken care of by the model.
Finally, we note that at low energies the autostructure calculations do not reproduce the measured DR resonance structure (inset of Fig. 3), a result which had to expected given the theoretical effort described by Mannervik et al. (1998) to be necessary for matching the experiment (inset of Fig. 2).
In view of the substantial experimental cut-off of high Rydberg states we derive our C IV DR rate coefficient in a plasma by using the experimental DR spectrum only below eV. Above that energy we substitute the experimental DR spectrum by the scaled autostructure result without cut-off (full line in Fig. 3). The thus created composite DR spectrum is converted into a cross section and convoluted with an isotropic Maxwellian electron energy distribution yielding the plasma rate coefficient
| (9a) | |||||
| (9b) | |||||
at the plasma electron temperature . This procedure is safe as long as the relative energy is larger then the experimental energy spread defined in Eq. (5), i.e., for (see discussion below).
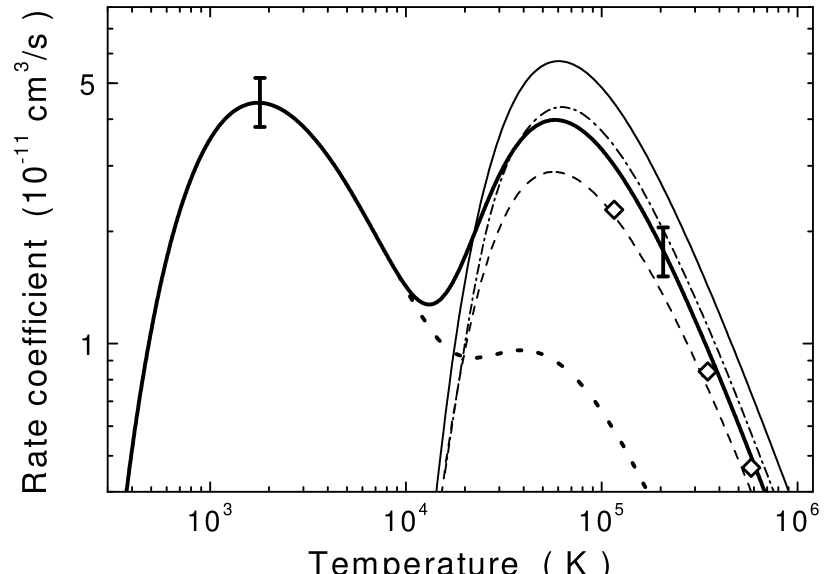
The resulting plasma C IV DR rate coefficient is displayed as the thick full line in Fig. 5. The curve displays two local maxima. The first one, which is due to the DR resonances, is especially benchmarked by our experiment. The second one is caused by DR via high Rydberg states. Here our result is dominated by the autostructure calculation that has been adjusted by a constant factor 0.8 to our experiment. For comparison, the dotted curve in Fig. 5 represents the plasma rate coefficient that has been derived directly from the measured DR spectrum (full symbols in Fig. 3) without the additional resonance strength above 7.6 eV (shaded area in Fig. 3) introduced via the autostructure calculation . At temperatures above 10000 K it is about a factor 5 lower than the composite rate coefficient. On the other hand, the calculated part of the composite DR spectrum does not influence our result at temperatures below 10000 K.
A convenient representation of the plasma DR rate coefficient is provided by the following fit formula
| (10) |
It has the same functional dependence on the plasma electron temperature as the Burgess (1965) formula, where the coefficients and are related to oscillator strengths and excitation energies, respectively. The results for the fit to the experimental C IV DR rate coefficient in a plasma are summarized in Table 1. The fit deviates from the thick full line in Fig. 5 by no more than for 650 K1500 K and by no more than for K.
4 Comparison with theoretical DR rate coefficients
Available theoretical C IV DR rate coefficients have been compiled recently by Savin (2000). For a critical assessment of the quality of the various calculations the reader is referred to that work. Here we confine ourselves to a brief comparison of our experimentally derived C IV DR plasma rate coefficient with the theoretical results, which in the following we divide into two categories.
i) The DR calculations by Burgess (1965), Shull & Steenberg (1982), Badnell (1989), and Chen (1991) have been carried out for high temperatures and do not reproduce the first local maximum of the experimental rate coefficient below 10000 K (Fig. 5). At higher temperatures, the Burgess (1965) formula yields rate coefficients up to 50 larger and at the other extreme the result of Shull & Steenberg (1982) is 30 lower than the present one. Above 25000 K the result of Badnell (1989) does not deviate more than 15 from ours. This deviation is within our experimental uncertainty. The calculation of Chen (1991) gives rate coefficients only for temperatures higher than K. They are up to 25 lower than our rate coefficient in that range.
ii) Calculations that should be valid also at low temperatures have been published by McLaughlin & Hahn (1983), Nussbaumer & Storey (1983), Romanik (1988), Safronova et al. (1997), and Mazzotta et al. (1998). They are shown in Fig. 6 together with our result. At more elevated temperatures above K the rate coefficients of Romanik (1988) and Nussbaumer & Storey (1983) deviate no more from our result than the group i) calculations discussed in the previous paragraph. In this temperature range the result of Safronova et al. (1997) is almost a factor 2 lower than ours at temperatures down to 2000 K it is up to a factor 1.5 larger. From 5000 to 5 K the result of McLaughlin & Hahn (1983) is within our error bar of 15. The rate coefficient of Mazzotta et al. (1998) agrees reasonably well with our result only above 50000 K. At temperatures below 2000 K all available calculations deviate strongly from our experimentally derived rate coefficient. This is most probably due to the neglect of relativistic and many-body effects which have been shown by Mannervik et al. (1998) to be essential for the correct description of the DR of even such a light ion as C IV. It should be mentioned again that at temperatures below K our result is completely independent of any theoretical model.
5 Total recombination rate coefficient
Instead of separate calculations of RR and DR contributions also a unified treatment of both recombination processes can be considered. Such a treatment, which in principle also accounts for interference between DR and RR, has been presented by Nahar & Pradhan (1997). Experimentally, our measurement also yields the total recombination rate coefficient with the continuous RR contribution above 0.1 eV accurately represented by the fit described in section 3. Below that energy all of the measured rate coefficient (Fig. 2) is assumed to be exclusively due to RR (see below). In principle, the total recombination rate coefficient can be derived by re-adding the continuous RR background to the composite DR spectrum including the autostructure calculation based extrapolation. However, at the low temperatures under consideration two experimental peculiarities require attention, namely the much discussed (Gao et al., 1997; Gwinner et al., 2000) recombination rate enhancement at very low energies and the finite experimental resolution.
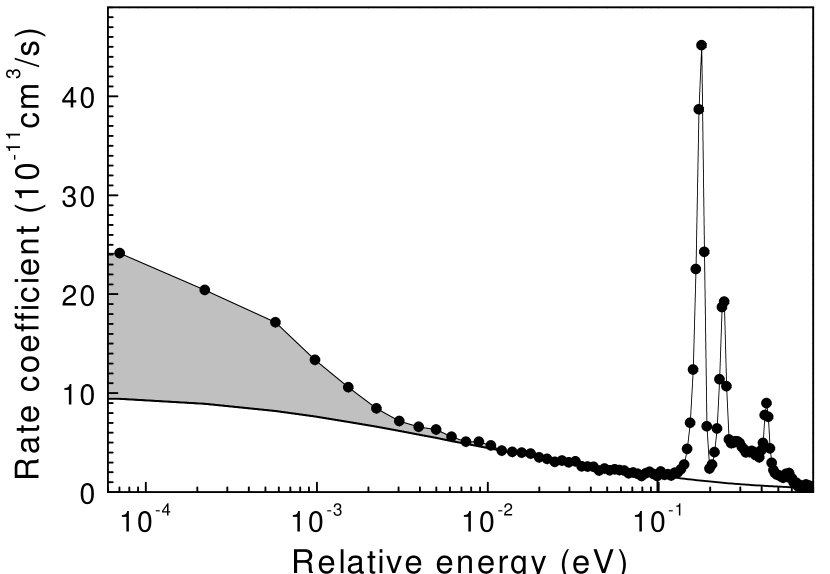
The measured enhancement of the recombination rate at very low energies is displayed in Fig. 7. At energies below 3 meV a strong enhancement of the experimental over the calculated rate coefficient sets in. At this factor reaches a value of about 2.5. This effect has been found in electron-ion recombination measurements at different storage rings and has not been explained yet. Systematic studies of this effect have been carried out by Gao et al. (1997) and Gwinner et al. (2000). The recombination rate enhancement results most probably from the specific experimental arrangement at storage-ring electron coolers where the electron beam is guided by a magnetic field.
Since we do not expected the enhancement to occur in an astrophysical environment we subtract the excess rate coefficient (shaded area in Fig. 7) from our experimental data. To this end we have extrapolated the fitted RR background (see Sec. 3) to lower energies by scaling a RR rate coefficient that has been calculated using a modified version of the semi-classical Bethe & Salpeter (1957) formula for the hydrogenic RR cross section, i.e.
| (11) |
with the Rydberg constant . For RR onto C IV and are appropriate. As discussed in Sec. 2 the maximum quantum number to be taken into account is determined by field ionization in our experimental setup. Since a rough estimate is sufficient for the present purpose we take . The factors account for partially filled shells. Here we use and for . The Gaunt factors are small corrections which account for deviations of the semi-classical formula from the quantum mechanically correct hydrogenic result. Generally the Gaunt factors are weakly energy dependent. We have taken energy independent values calculated for by Andersen & Bolko (1990).
The thus calculated RR cross section has been convoluted by the experimental electron velocity distribution [see Eqs. (4) and (8)] and the resulting rate coefficient has been multiplied by a constant factor of 1.638 such that it matches the fitted RR background at eV. The finding that a factor different from unity has to be used in order to achieve the matching, can be attributed to the fact that the hydrogenic treatment is not appropriate for RR at least into low- shells of the lithiumlike C IV ion. The total recombination rate coefficient is now calculated as the sum of the extrapolated RR background (full line in Fig. 7) and the DR rate coefficient derived in Sec. 3 (cf. Tab. 1). This ensures that the excess rate due to the recombination rate enhancement does not contribute to the total recombination rate coefficient which is displayed as the thick dash-dotted line in Fig. 8.
At low plasma temperatures we also have to consider the influence of the finite experimental resolution [cf. Eq. (5)] on our total plasma rate coefficient, which is only well defined at temperatures K as discussed before (Sec.3). In order to quantify this influence we have convoluted the theoretical RR cross section [Eq. (11) with ] with our experimental energy distribution [see Eqs. (4) and (8)] and derived from the resulting RR rate coefficient via Eq. (9b) the ”doubly convoluted” plasma RR rate coefficient. This is to be compared with the ”singly convoluted” RR rate coefficient
| (12) |
where is the exponential integral and . Eq. (12) has been derived by inserting Eq. (11) into Eq. (9a) (see also Seaton, 1959). In contrast to the ”doubly convoluted” rate coefficient the ”singly convoluted” one is not influenced by the experimental resolution. We find that at K (200 K) the ”doubly convoluted” rate coefficient is () lower than the ”singly convoluted” one. It should be noted that these numbers depend strongly on the shapes of the convoluted curves. Flatter curves than the diverging RR cross sections will yield much smaller values. In order to correct for the influence of the finite experimental resolution we have multiplied our previously derived total C IV recombination rate coefficient (dash-dotted curve in Fig. 8) with the temperature dependent ratio of the ”singly” to ”doubly convoluted” RR rate coefficient. The resulting corrected total recombination rate coefficient is displayed as the thick full line in Fig. 8. In principle the correction also influences the DR rate coefficient. However, in the relevant temperature range the correction is well within the overall systematic error and its influence on the C IV plasma DR rate coefficient has therefore been neglected.
At low temperatures our experimental total rate coefficient stays below the widely used theoretical RR rate coefficient given by Péquignot et al. (1991) (thin full line in Fig. 8). This is due to the field ionization of high Rydberg states. In their calculation Péquignot et al. (1991) account for RR into all -shells up to infinite . For they use the hydrogenic RR rate coefficient of (Martin, 1988). In order to compare our result to theoretical rate coefficients for finite values of we first subtract this hydrogenic contribution from the rate coefficient of Péquignot et al. (1991) thereby retaining their non-hydrogenic C IV RR rate coefficient with . Onto this we have then added the hydrogenic RR rate coefficient calculated by using Eq. (12) with , and , yielding the thin dashed and dash-dotted curves in Fig. 8, respectively. Extending the summation to yields — as expected — a curve which is indistinguishable from the result of Péquignot et al. (1991) on the scale of Fig. 8. At low temperatures our experimental rate coefficient approaches the theoretical curve that has been obtained with . This is roughly consistent with the prediction of the detailed model for field ionization in our experimental apparatus as discussed in Sec. 2 and in the appendix. From this observation we conclude that within our 15 % systematic uncertainty the total C IV recombination rate coefficient can be represented as the sum of the RR rate coefficient of Péquignot et al. (1991) and our DR rate coefficient parameterized by Eq. (10) with the parameters listed in Tab. 1.
In Fig. 9 this total C IV recombination rate coefficient is compared to the results of the unified RR+DR calculation of Nahar & Pradhan (1997). At temperatures above 5000 K both results agree with each other within our systematic uncertainty. At lower temperatures, however, pronounced differences occur. The theoretical result is up to a factor of 3 larger than the experimental one. It should be noted that interference between RR and DR cannot be held responsible for the observed discrepancy, since it is included both in the unified theory and in the experiment. The measured rate coefficient especially fully includes the strong DR channels. Only these can in principle be expected to give rise to noticeable interference effects at low plasma temperatures. However the lowest experimental C IV DR resonance occurs at about eV. Assuming a delta-like cross-section and using the (somewhat to large) theory value of cm2eV for its strength (Mannervik et al., 1998) we calculate its contribution to the total rate coefficient by the use of Eq. (9a). At 500 K it is cm3/s, i.e., about only. Accordingly, at lower temperatures the measured rate coefficient should be almost entirely due to RR, i.e., the low-temperature deviation of the unified theory of Nahar & Pradhan (1997) from our measured C IV rate coefficient remains to be explained.
6 Summary and conclusions
We have measured the C IV DR rate coefficient by detecting with essentially full geometric efficiency the recombination products following interaction in merged electron and ion beams. Generally, in such experiments the field ionization related to the charge analysis of the recombination products causes a large fraction of the DR resonance strength due to DR via high Rydberg states to remain unmeasured. For the present case of DR of a low-charge ion this undetected DR strength is substantial. In order to provide a remedy for this deficiency, we have performed autostructure calculations, carefully modeled the Rydberg-ion detection probabilities of our apparatus, scaled the results to our experimental low energy DR rate coefficient, and finally used the high-energy part of the calculation as a substitution for the unmeasured DR strength. From the thus extrapolated experimental DR spectrum we have derived the C IV DR rate coefficient in a plasma [cf. Eq. (10) and Tab. 1]. Furthermore the careful analysis of our experimental data leads to the conclusion that within our systematic uncertainty of 15 % the total C IV recombination rate coefficient can be represented as the sum of the DR rate coefficient and the theoretical RR rate coefficient of Péquignot et al. (1991). This implies that interference between DR and RR is insignificant for the recombination of C IV. We have compared our rate coefficients with the available theoretical results. None of them agrees with our experimental rate coefficients over the full temperature range.
The field ionization of recombined ions in high Rydberg states, which is unavoidable in ion storage-ring experiments, ultimately limits the capability of providing meaningful, pure experimental plasma DR rate coefficients. This is especially true for low charge-state ions where much DR strength is concentrated in high- resonances. Due to the much higher radiative rates (-scaling, Bethe & Salpeter, 1957) the DR resonance strength drops much faster with increasing for high charge-state ions so that a smaller fraction of the total DR strength is accumulated in high Rydberg states. Consequently, storage-ring experiments can provide reliable DR plasma rate coefficients with much more limited need of extrapolation for highly charged ions.
Appendix A Model calculation of detection probabilities for high Rydberg states
In the detailed model of the field ionization properties of our apparatus, the survival fractions are determined individually for each state populated by DR, in combination with the flight times to the field ionization zones and hydrogenic decay rates. Assuming a constant recombination probability across the length of the merging section the probability that a state characterized by quantum numbers and has decayed upon reaching the field ionization zone is given as
| (A1) |
The flight time through the electron cooler is ns in the present case and the radiative lifetime of the -state is calculated as from hydrogenic radiative dipole transition rates following Bethe & Salpeter (1957). In Eq. (A1), which is valid for , is measured from the center of the merging section inside the electron cooler up to the field ionization region (cf. Fig. 1). There the recombined ion spends a time during which field ionization may take place. The ion’s survival probability is calculated from approximate field ionization rates derived by Damburg & Kolosov (1979) to be
| (A2) |
where the expansion coefficients are the Clebsch-Gordan coefficients
| (A3) |
for the transformation to Stark states characterized by the parabolic quantum numbers , and , which satisfy the relation (Gallagher, 1994). Finally, the detection probability is calculated from the decay and survival probabilities as
| (A4) | |||||
where branching ratios for a dipole transition from state to state are defined as . The quantity
accounts for cascading, i.e. stepwise de-excitation by more than one transition. It is calculated recursively. In Eqs. (A4) and (A)
| (A6) |
is the probability for a decay along a given sequence of excited hydrogenic states (Schippers, 1995). The one-step decay probabilities are evaluated according to Eq. (A1).
Due to the high values to be considered (up to ), the explicit calculation of cascade contributions is very laborious and time consuming. In view of the fact that rates are highest for transitions to the lowest available state and decrease with (Bethe & Salpeter, 1957) it can be anticipated that except for high angular momentum states, which are only sparsely populated by DR, cascading only plays a minor role. We have verified this by comparing calculations without and with cascades via one and two intermediate states. The resulting rate coefficients are undistinguishable on the scale of Fig. 3. Therefore, we conclude that it is safe to neglect contributions from cascades with more intermediate states.
In the calculation of detection probabilities we include states up to which is far beyond the estimated hard cut-off at (cf. Sec. 2). Furthermore, we consider all field ionization regions which have been mentioned previously: the toroidal section at the exit of the electron cooler, two correction magnets and the charge analyzing dipole magnet (cf. Fig. 1). The corresponding detection probabilities , , and , respectively, are calculated individually and the overall detection probability is finally given as the product of the four individual ones, i.e.
| (A7) | |||||
with the numerical values for , and taken from Tab. 2. It should be noted, that for the calculation of , and we used the limit of Eq. (A1), namely . A contour plot of the calculated detection probabilities is shown in Fig. 4. The detection probabilities are 100 for -states up to . At higher only low states have a high detection probability owing to their short lifetimes. Higher states have increasingly higher lifetimes and are more and more effectively field ionized. Consequently, for the detection probability drops very fast to zero with increasing . Above also low states are cut-off due to field ionization in the toroid. According to Eq. (6) the hard cut-off number there is . Due to the short time of only 55 ns needed for travelling from the cooler center to the toroid almost no radiative de-excitation of higher Rydberg states is possible.
References
- Andersen & Bolko (1990) Andersen, L. H. & Bolko, J. 1990, Phys. Rev. A, 42, 1184
- Badnell (1986) Badnell, N. R. 1986, J. Phys. B, 19, 3827
- Badnell (1989) — 1989, Phys. Scr., 23, 33
- Bartsch et al. (1999) Bartsch, T., Schippers, S., Müller, A., Brandau, C., Gwinner, G., Saghiri, A. A., Beutelspacher, M., Grieser, M., Schwalm, D., Wolf, A., Danared, H., & Dunn, G. H. 1999, Phys. Rev. Lett., 82, 3779
- Bartsch et al. (2000) Bartsch, T., Schippers, S., Beutelspacher, M., Böhm, S., Grieser, M., Gwinner, G., Saghiri, A. A., Saathoff, G., Schuch, R., Schwalm, D., Wolf, A., & Müller, A. 2000, J. Phys. B, 33, L453
- Bethe & Salpeter (1957) Bethe, H. A. & Salpeter, E. E. 1957, Quantum Mechanics of One- and Two-Electron Atoms (Berlin, Heidelberg, New York: Springer)
- Brandau et al. (1997) Brandau, C., Hoffknecht, A., Knopp, H., Müller, A., Kozhuharov, C., Franzke, B., Steck, M., Winkler, T., Groening, L., Bosch, F., Mokler, P. H., Stöhlker, T., & Stachura, Z. 1997, in GSI Scientific Report 1996 (GSI 97-1), 109
- Burgess (1965) Burgess, A. 1965, Astrophys. J., 141, 1588
- Chen (1991) Chen, M. H. 1991, Phys. Rev. A, 44, 4215
- Damburg & Kolosov (1979) Damburg, R. J. & Kolosov, V. V. 1979, J. Phys. B, 12, 2637
- Edlén (1983) Edlén, B. 1983, Phys. Scr., 28, 51
- Gallagher (1994) Gallagher, T. F. 1994, Rydberg Atoms, no. 3 in Cambridge Monographs on Atomic, Molecular and Chemical Physics (Cambridge, U.K.: Cambridge University Press)
- Gao et al. (1997) Gao, H., Schuch, R., Zong, W., Justiniano, E., DeWitt, D. R., Lebius, H., & Spies, W. 1997, J. Phys. B., 30, L499
- Grieser et al. (1991) Grieser, M., Blum, M., Habs, D., Hahn, R. V., Hochadel, B., Jaeschke, E., Kleffner, C. M., Stampfer, M., Steck, M., & Noda, A. 1991, in Proceedings of the 19th International Symposium on Cooler Rings and Their Applications, Tokyo, Japan, November 5 – 8, 1990, eds. T. Katayama & A. Noda (Singapore: World Scientific), 190
- Gwinner et al. (2000) Gwinner, G., Hoffknecht, A., Bartsch, T., Beutelspacher, M., Eklöw, N., Glans, P., Grieser, M., Krohn, S., Lindroth, E., Müller, A., Saghiri, A. A., Schippers, S., Schramm, U., Schwalm, D., Tokman, M., Wissler, G., & Wolf, A. 2000, Phys. Rev. Lett., 84, 4822
- Jaeschke et al. (1989) Jaeschke, E., Krämer, D., Arnold, W., Bisoffi, G., Blum, M., Friedrich, A., Geyer, C., Grieser, M., Habs, D., Heyng, H. W., Holzer, B., Ihde, R., Jung, M., Matl, K., Neumann, R., Noda, A., Ott, W., Povh, B., Repnow, R., Schmitt, F., Steck, M., & Steffens, E. 1989, in Proceedings of the First European Particle Accelerator Conference, Rome, 1988 (Singapore: World Scientific), 365
- Kilgus et al. (1992) Kilgus, G., Habs, D., Schwalm, D., Wolf, A., Badnell, N. R., & Müller, A. 1992, Phys. Rev. A, 46, 5730
- Lampert et al. (1996) Lampert, A., Wolf, A., Habs, D., Kenntner, J., Kilgus, G., Schwalm, D., Pindzola, M. S., & Badnell, N. R. 1996, Phys. Rev. A, 53, 1413
- Mannervik et al. (1998) Mannervik, S., deWitt, D., Engström, L., Lidberg, J., Lindroth, E., Schuch, R., & Zong, W. 1998, Phys. Rev. Lett., 81, 313
- Martin (1988) Martin, P. G. 1988, Astrophys. J. Suppl., 66, 125
- Mazzotta et al. (1998) Mazzotta, P., Mazzitelli, G., Colafrancesco, S., & Vittorio, N. 1998, Astron. Astrophys., 133, 403
- McLaughlin & Hahn (1983) McLaughlin, D. J. & Hahn, Y. 1983, Phys. Rev. A, 27, 1389
- Müller (1995) Müller, A. 1995, Nuclear Fusion Suppl., 6, 59
- Müller (1999) — 1999, Int. J. Mass Spec., 9
- Müller & Wolf (1997) Müller, A. & Wolf, A. 1997, in Accelerator-based atomic physics techniques and applications, eds. J. C. Austin & S. M. Shafroth (Woodbury: AIP Press), 147
- Müller et al. (1997) Müller, A., Bartsch, T., Brandau, C., Danared, H., DeWitt, D. R., Doerfert, J., Dunn, G. H., Gao, H., Graham, W. G., Hoffknecht, A., Lebius, H., Linkemann, J., Pindzola, M. S., Savin, D. W., Schippers, S., Schmitt, M., Schuch, R., Schwalm, D., Spies, W., Uwira, O., Wolf, A., & Zong, W. 1997, in Application of Accelerators in Research and Industry, eds. J. L. Duggan & I. L. Morgan (American Institute of Physics), 31
- Müller et al. (1998) Müller, A., Bartsch, T., Brandau, C., Hoffknecht, A., Knopp, H., Schippers, S., Uwira, O., Linkemann, J., Saghiri, A. A., M. Schmitt and, D. S., Wolf, A., Bosch, F., Franzke, B., Kozhuharov, C., Mokler, P. H., Nolden, F., Steck, M., Stöhlker, T., Winkler, T., Danared, H., DeWitt, D. R., Gao, H., Lebius, H., Schuch, R., Spies, W., Zong, W., Dunn, G. H., Tanis, W. G. G. A. A., Doerfert, J., Savin, D. W., & Stachura, Z. 1998, Hyperfine Interact., 114, 229
- Nahar & Pradhan (1997) Nahar, S. N. & Pradhan, A. K. 1997, Astrophys. J. Suppl., 111, 339
- Nussbaumer & Storey (1983) Nussbaumer, H. & Storey, P. J. 1983, Astron. Astrophys., 126, 75
- Pastuszka et al. (1996) Pastuszka, S., Schramm, U., Grieser, M., Broude, C., Grimm, R., Habs, D., Kenntner, J., Miesner, H.-J., Schüßler, T., Schwalm, D., & Wolf, A. 1996, Nucl. Instrum. Methods A, 369, 11
- Péquignot et al. (1991) Péquignot, D., Petitjean, P., & Boisson, C. 1991, Astron. Astrophys., 251, 680
- Romanik (1988) Romanik, C. J. 1988, Astrophys. J., 330, 1022
- Safronova et al. (1997) Safronova, U., Kato, T., & Ohira, M. 1997, J. Quant. Spectrosc. Radiat. Transfer, 58, 193
- Savin (2000) Savin, D. W. 2000, Astrophys. J., 533, 106
- Savin et al. (1997) Savin, D. W., Bartsch, T., Chen, M. H., Kahn, S. M., Liedahl, D. A., Linkemann, J., Müller, A., Schippers, S., Schmitt, M., Schwalm, D., & Wolf, A. 1997, Astrophys. J. Lett., 489, L115
- Savin et al. (1999) Savin, D. W., Kahn, S. M., Linkemann, J., Saghiri, A. A., Schmitt, M., Grieser, M., Repnow, R., Schwalm, D., Wolf, A., Bartsch, T., Brandau, C., Hoffknecht, A., Müller, A., Schippers, S., Chen, M. H., & Badnell, N. R. 1999, Astrophys. J. Suppl., 123, 687
- Schippers (1995) Schippers, S. 1995, Internal Report KVI-195i, Kernfysisch Versneller Instituut, Groningen, The Netherlands
- Schippers (1999) — 1999, Phys. Scr., T80, 158
- Schippers et al. (1998) Schippers, S., Bartsch, T., Brandau, C., Gwinner, G., Linkemann, J., Müller, A., Saghiri, A. A., & Wolf, A. 1998, J. Phys. B, 31, 4873
- Schippers et al. (2000) Schippers, S., Bartsch, T., Brandau, C., Müller, A., Gwinner, G., Wissler, G., Beutelspacher, M., Grieser, M., Wolf, A., & Phaneuf, R. A. 2000, Phys. Rev. A, 62, 022708
- Schuch (1993) Schuch, R. 1993, in Review of Fundamental Processes and Applications of Atoms and Ions, ed. C. D. Lin (Singapore: World Scientific), 169
- Schuch et al. (1997) Schuch, R., DeWitt, D. R., Gao, H., Mannervik, S., & Zong, W. 1997, Phys. Scr., T73, 114
- Schuch et al. (1998) Schuch, R., Zong, W., Lindroth, E., DeWitt, D. R., Gao, H., Spies, W., & Danared, H. 1998, in Photonic, Electronic and Atomic Collisions, eds. F. Aumayr & H. Winter (Singapore: World Scientific), 323
- Seaton (1959) Seaton, M. J. 1959, Mon. Not. R. Astron. Soc., 119, 81
- Shull & Steenberg (1982) Shull, J. M. & Steenberg, M. V. 1982, Astrophys. J. Suppl., 48, 95
- Wolf et al. (2000) Wolf, A., Gwinner, G., Linkemann, J., Saghiri, A. A., Schmitt, M., Schwalm, D., Grieser, M., Beutelspacher, M., Bartsch, T., Brandau, C., Hoffknecht, A., Müller, A., Schippers, S., Uwira, O., & Savin, D. W. 2000, Nucl. Instrum. Methods A, 441, 183
| 1 | 2.420E-3 | 7.969 |
| 2 | 1.347E-4 | 5.386 |
| 3 | 1.094E-5 | 0.330 |
| 4 | 6.897E-6 | 1.650 |
| 5 | 6.328E-6 | 0.169 |
Note. — Units are cm3s-1K1.5 for , and eV for . The systematic error of the rate coefficient from Eq. (10) is .
| Region | ||||
|---|---|---|---|---|
| toroid | 4 | 29 | 55 | 45 |
| 1st correction magnet | 6 | 20 | 103 | 40 |
| 2nd correction magnet | 12 | 10 | 133 | 34 |
| dipole magnet | 106 | 49 | 275 | 19 |
Note. — Units are kV/cm for and ns for and . has been calculated from Eq. (6).