Extreme Starbursts
Extreme Starbursts and Molecular Clouds in Galaxies
Abstract
The extraordinary starbursts found in ultraluminous IR galaxies occur in molecular gas concentrated in compact very massive “clouds” which we call “Extreme Starbursts”. They have one thousand times the mass but are only a few times larger than GMCs. High-mass star formation in sufficiently dense and massive structures does not disrupt further star formation; it is a runaway process. Star formation remains embedded in the molecular gas and there is little or virtually no optical–UV radiation. In the early universe extreme starbursts may be more frequent and they may be the mode of star formation in high redshift submillimeter sources.
1 Introduction
All star formation takes place in molecular clouds and most star formation takes place in Giant Molecular Clouds (GMCs), the most massive objects in the Galaxy SS80 and the dominant form of the molecular interstellar medium. The distribution of GMCs in the Milky Way molecular ring SS75 , as traced by CO emission, is very different from that of atomic hydrogen and similar to that of H ii regions, demonstrating that it is not the ISM distribution as a whole that governs star formation rates but the distribution of molecular gas. An understanding of star formation rates and starbursts in galaxies requires an understanding of the physical conditions in GMCs and their relation to galactic dynamics. Due to the limited resolution of current millimeter wave arrays the Milky Way is the only galaxy in which a large number of GMCs have been identified and mapped and we must turn to Milky Way GMCs to examine star formation efficiencies on the scale of individual clouds.
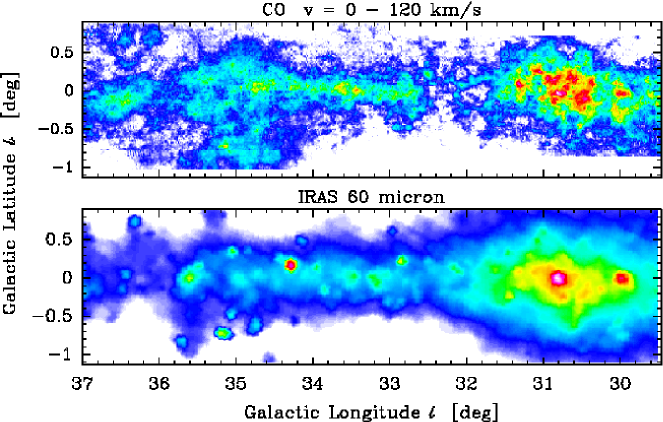
The high-mass star formation rate within and on the edge of GMCs can be estimated from the far infrared luminosity emitted by dust heated by embedded OB stars. The association of molecular clouds and FIR emission from OB star formation regions in a section of the Milky Way is shown in Figure 1. The mass of molecular gas can be determined from the CO luminosity or, more accurately for individual clouds, from the virial theorem utilizing the CO kinematics. The ratio of the FIR luminosity to the CO luminosity, /, or to the cloud mass, /, is a measure of the rate of star formation per solar mass of the cloud and is an indicator of star formation efficiency. The star formation rate is [M⊙/yr] and the gas depletion time is years GH86 . A FIR and CO survey of 60 GMCs MS88 shows that for active OB star forming clouds / is typically and typical molecular gas depletion times are years. Even in the most active individual clouds (M17A and W49), / = 100 and the gas depletion time of years is two orders of magnitude greater than the cloud dynamical timescale. By this measure star formation is clearly not very efficient in ordinary GMCs.
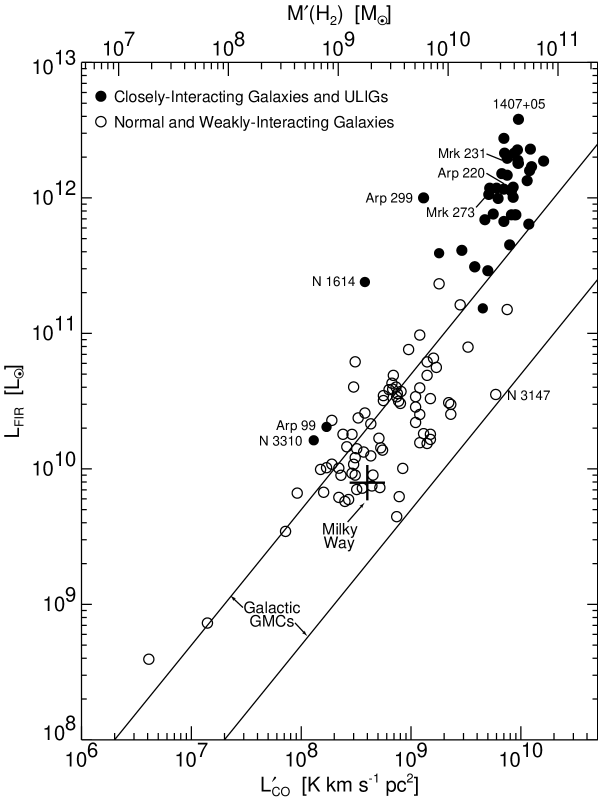
The efficiency of star formation in galaxies must be measured relative to the potential for star formation determined by the available mass of molecular gas. Normal spiral galaxies, even those with moderately high IR luminosities, have a range of / similar to GMCs, indicating star formation efficiencies similar to those of the Milky Way. In normal spirals, the rate of star formation is proportional to the mass of molecular gas. In contrast, far IR starbursts, luminous infrared galaxies (LIGS) and ultraluminous infrared galaxies (ULIGs) have / ratios 3 to 20 times higher than normal spirals. Most of these are closely interacting and merging systems SAND88 . CO observations of 30 IRAS identified ultraluminous galaxies out to z = 0.3 show that while all without exception have high CO luminosities, they also all have abnormally high star formation efficiencies SDRB97 . While their CO luminosities are at the very high end of normal galaxies, their FIR luminosities are more than an order of magnitude above normal spirals. This situation is summarized in Figure 2, which shows that the star formation efficiency of ULIGs as indicated by / is not only higher than in normal spirals, but is higher than that of any individual GMC. CO luminosity and molecular mass are not very good indicators of high-mass star formation rates. is not actually very well correlated with . When infrared luminous galaxies are included, / ranges over a factor of 100. This large dispersion is further complicated by the interpretation of CO emission from ULIGs in terms of H2 mass.
The large nuclear concentration of molecular gas in ultraluminous galaxies has been mapped in the millimeter lines of CO by several groups during the past decade. Scaling to the CO signal strengths from Milky Way molecular clouds, however, soon led to a paradox for many of the sources — the estimated gas mass was equal to or larger than the dynamical mass indicated by the linewidths and source size. For Arp 220, for example, nearly all of the mass in the central few hundred parsecs was in the form of molecular gas SC91 . To resolve this dilemma, we DSR93 ; SDRB97 showed that in the extreme environment in the central few hundred pc of ultraluminous galaxies, much of the CO luminosity must come from an inter-cloud medium that fills the whole volume, rather than from clouds bound by self gravity, and therefore the CO luminosity traces the geometric mean of the gas mass and the dynamical mass, rather than just the gas mass. This has the effect of lowering the molecular mass for a given CO luminosity and increasing the star formation efficiency.
What are the physical differences between the molecular gas in ULIGs and normal spirals which account for the extraordinary infrared starbursts? To answer this question, we have carried out comprehensive observations of the global properties of the molecular gas in ULIGs and also of the detailed morphology and kinematics.
2 Dense Molecular Gas: HCN, a Molecular Starburst Indicator
Until recently, CO has been the only molecular tracer systematically observed in a wide sample of galaxies, particularly ULIGs. CO traces molecular hydrogen, H2 at densities cm-3, typical of densities in GMCs, but far below the densities in GMC cloud cores, the actual sites of star formation. To measure the mass of dense molecular gas it is essential to use a molecular transition with a much higher density threshold. A particularly useful molecule in this respect is HCN, which has a moderate abundance but a high dipole moment, and therefore a short lifetime and requires a large H2 density n(H2) cm-3 for significant excitation and emission. Initial measurements of the HCN (1–0) line from 5 ULIGs SDR92 showed extraordinarily strong emission. Arp 220, Arp 193, Mrk 231, and NGC 6240 all showed HCN line luminosities greater than the CO luminosity of the Milky Way, and about 30 times higher than the HCN luminosity of normal spirals. The unexpected huge HCN luminosity and the high ratio of / indicate that a large fraction of the total molecular gas in ULIGs is at a high density similar to that in star forming cloud cores, rather than the envelopes, of GMCs.

Although the HCN sample contained only 10 galaxies, the results indicated that the ratio of far infrared to HCN luminosity is similar in ultraluminous galaxies and normal spirals, including the Milky Way, which suggests that the star formation rate per solar mass of dense gas is independent of the infrared luminosity. Subsequent HCN measurements (Figure 3) of the global HCN luminosity in 60 galaxies covering 3 orders of magnitude in IR luminosity G96 ; GS2001 confirm this result, demonstrating that the – correlation is substantially better than that for – , and show that / is almost independent of FIR luminosity (There is a very small effect amounting to a factor of 1.7 for the most luminous galaxies). This indicates that the star formation rate is proportional to the dense molecular gas content of a galaxy, and is also evidence that the power source in ULIGs is primarily star formation, not AGNs. Normal spiral galaxies clearly powered by star formation have the same ratio of far infrared luminosity to HCN luminosity as ultraluminous galaxies. The dense molecular gas in normal spirals and ultraluminous galaxies is the star forming material being processed into stars with equal efficiency in all galaxies. HCN luminosity is a star formation indicator.
3 Rotating Nuclear Rings and Extreme Starbursts
in
Ultraluminous Infrared Galaxies
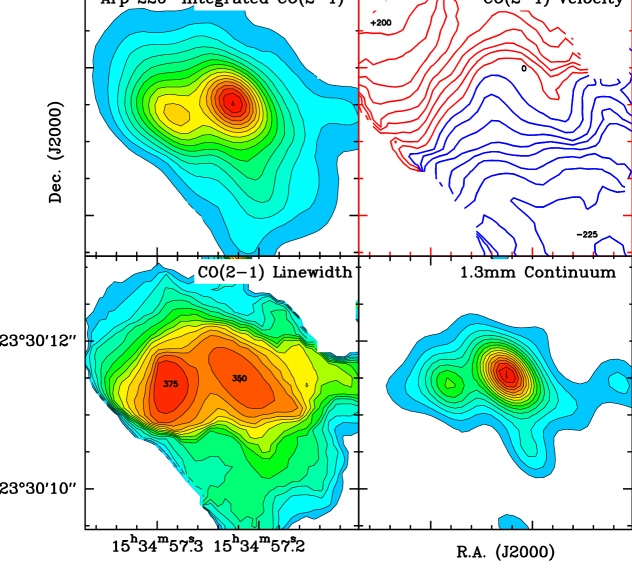
High spatial resolution CO maps of ULIGs (eg SC91 ; YS95 ; DS98 ) all show evidence of central molecular concentrations and rotation. A survey with the IRAM Array of the kinematics of 10 ULIGs included 5 galaxies mapped at the unprecedented resolution of 0.5 arc seconds DS98 . Analysis of the CO intensity distribution and kinematics utilizing models of CO excitation and radiative transfer yields a detailed kinematic picture dominated by rotating rings or discs on a scale of a few hundred parsecs (eg Mrk 231, Mrk 273, Arp 220, Arp 193) up to 2 kpc (for VII Zw31), with compact Extreme Starburst Regions embedded in the rings or disks. An example of the CO (2–1) data is shown in Figure 4 for Arp 220, the nearest ULIG, and therefore the object with the highest spatial detail. Most of the CO emission originates from a disk rotating at 330 km/s with a characteristic radius of 340 pc (1 arc second); the strongest CO emission and most of the 1.3 mm dust continuum emission, indicative of the luminosity source, originates from the two smaller sources Arp 220 East and West coincident with the extended nonthermal radio continuum peaks, usually interpreted as the “nuclei” of the merging galaxies. Each of these objects shows its own internal kinematics; the East source shares a kinematic axis with the main disk and the West source has a kinematic axis rotated by 110∘ from the East source and main disk axis. (see Figure 21 in DS98 ). A map with similar resolution obtained at OVRO SAK99 yields similar results, but with the East and West kinematic axes offset by 180∘ interpreted as counter rotating nuclei. A full interpretation of the relation between these two sources and the larger disk will have to wait for even higher resolution data.
An analysis of the molecular mass, total dynamical mass and mass of young stars required to account for the extreme starburst in the East and West sources DS98 shows that most of the mass must be in molecular gas and young stars, not in old stars from a pre-existing nuclear bulge. The characteristic radii of these extreme starburst regions are only 70 and 110 pc, with total dynamical masses determined from a virial theorem analysis of rotation of about 3 and 1.5 M⊙, yet each of these regions is producing between 3 and 5 L⊙. Two other Extreme Starburst Regions have been identified in Mrk 273 and Arp 193. The high-resolution CO (2–1) maps show a remarkable molecular-line source in the Mrk 273 nuclear disk — a bright, CO core, that resembles the West nucleus of Arp 220. This is the most luminous extreme starburst region identified in the sample of 10 galaxies. It has an infrared luminosity of about L⊙, generated from a current molecular mass of M⊙ in a region with a radius of only 120 pc (see Table 1). The extended nonthermal continuum emission CON91 coincident with a high mass of dust and gas leaves little doubt that this region is powered by star formation. To put this in perspective, the entire molecular core has a radius about 5 times that of a very IR luminous Milky Way GMC (for example W51), but with about 3,000 times the molecular mass and times the IR luminosity from OB stars.
| Arp 193 | Mrk 273 | Arp 220 | Arp 220 | |
|---|---|---|---|---|
| SE core | core | west | east | |
| Reference radius: | ||||
| R(pc) | 150 | 120 | 68 | 110 |
| Gas mass: | ||||
| (109 M⊙) | 0.6 | 1.0 | 0.6 | 1.1 |
| Mean gas density: | ||||
| (cm-3) | ||||
| Total mass: | ||||
| (109 M⊙) | 1.4 | 2.6 | 1.4 | 3.2 |
| Estimated mass in new stars: | ||||
| (109 M⊙) | 0.8 | 1.6 | 0.8 | 2.1 |
| Luminosity: | ||||
| (1012 L⊙) | 0.2 | 0.6 | 0.3-0.5 | 0.2-0.4 |
| Luminosity to mass ratio: | ||||
| (L⊙/ M⊙) | 300 | 360 | 380 | 100 |
Table 1 (adapted from Table 12 of DS98 ) lists the properties of 4 Extreme Starburst Regions identified in the 3 closest galaxies in the sample. They are the most prodigious star formation events in the local universe, each representing about 100 times as many OB stars as 30 Doradus. We are observing these objects near the peak of their star formation, when about half of the gas has been turned into stars. The duration of the starburst, limited by the molecular gas supply and the current star formation rate is about 5 to 10 yrs. This short lifetime is consistent with the even shorter dynamical timescale of these compact ( 100 pc) starbursts. These are not only extreme starbursts, they are extremely efficient starbursts. The high L/M for these starbursts also suggests that they may require a high-mass IMF.
The high average density in the Extreme Starburst Regions solves the puzzle of the origin of the extraordinary HCN emission associated with ultraluminous galaxies discussed above. In Arp 220, the HCN lines have the same velocities as the East and West “nuclei”. The East and West “extreme starbursts” alone account for most of the HCN emission. These dense, compact sources have a hydrogen column density of cm-2 and mean density of 20,000 cm-3, enough to thermalize the lower rotational levels of HCN by a combination of collisions and radiative trapping even if the average density is the local density. Within the Arp 220 East and West sources, the HCN emission may thus have the same intrinsic brightness temperature as the CO (2–1) emission. Using the observed sizes and linewidths, the HCN luminosity of these two regions alone is K km s-1 pc2, which is 3/4 of the observed total SDR92 . These two regions thus emit only 1/4 of the CO luminosity but most of the HCN luminosity. It is likely that high density, extreme starburst regions exist in almost all ultraluminous galaxies and are the source of most of the star formation and most of the HCN emission. The origin of the HCN emission in the high density gas of the Extreme Starburst Regions directly relates the HCN emission to star formation.
4 Summary
The extraordinary starbursts found in ultraluminous IR galaxies occur in molecular gas concentrated in compact very massive “clouds ” which we call “Extreme Starbursts”. They have one thousand times the mass of GMCs, but are only a few times larger. The entire structure, containing about a billion solar masses of molecular gas, has an average H2 density characteristic of molecular cloud cores which represent only a few percent of the molecular mass in ordinary GMCs. It appears that high-mass star formation in sufficiently dense and massive structures does not disrupt further star formation. Since the star formation remains embedded in the molecular gas, there is little or virtually no optical–UV radiation escaping, and extreme star formation can be traced only in the far infrared. If the density and mass are sufficiently great, star formation is a runaway process. In the local universe this occurs primarily in galaxy mergers. In the early universe extreme starbursts may be more frequent and they may be the mode of star formation in the population of high redshift submillimeter sources.
References
- (1) J.J. Condon, Z.P. Huang, Q.F. Yin, T.X. Thuan: Ap. J. 378, 65 (1991)
- (2) D. Downes, P.M. Solomon, S.J.E. Radford: Ap. J. 414, L13 (1993)
- (3) D. Downes, P.M. Solomon: Ap. J. 507, 615 (1998), astro-ph/9806377
- (4) J.S. Gallagher, D.A. Hunter: ‘Measuring Star Formation Rates in Blue Galaxies’. In: Star Formation in Galaxies, ed. by C. Lonsdale (US GPO, Washington 1987) pp. 167–177
- (5) Y. Gao: Dense Molecular Gas in Galaxies and the Evolution of Luminous Infrared Galaxies. Ph.D. Thesis, SUNY, Stony Brook (1996)
- (6) Y. Gao, P.M. Solomon: to be published in Ap. J. (2001)
- (7) T. Mooney, P.M. Solomon: Ap. J. 334, L51 (1988)
- (8) K. Sakamoto, N.Z. Scoville, M.S. Yun, M. Crosas, R. Genzel, L.J. Tacconi: Ap. J. 514, 68 (1999), astro-ph/9810325
- (9) D.B. Sanders, B.T. Soifer, J.H. Elias, B.F. Madore, K. Matthews, G. Neugebauer, N.Z. Scoville: Ap. J. 325, 74 (1988)
- (10) N.Z. Scoville, A.I. Sargent, D.B. Sanders, B.T. Soifer: Ap. J. 366, L5 (1991)
- (11) N.Z. Scoville, P.M. Solomon: Ap. J. 199, L105 (1975)
- (12) P.M. Solomon, L.J Sage: Ap. J. 334, 613 (1987)
- (13) P.M. Solomon, D. Downes, S.J.E. Radford: Ap. J. 387, L55 (1992)
- (14) P.M. Solomon, D. Downes, S.J.E. Radford, J.W. Barrett: Ap. J. 478, 144 (1997), astro-ph/9610166
- (15) P.M. Solomon, D.B. Sanders: ‘Giant Molecular Clouds as the Dominant Component of Interstellar Matter in the Galaxy’., In:Molecular Clouds in the Galaxy, ed by P. Solomon, M. Edmunds (Pergamon Press, Oxford 1980) pp. 41–74
- (16) M.S. Yun, N.Z. Scoville: Ap. J. 451, L45 (1995)