An Integrated Procedure for Tree-Nbody Simulations: FLY and AstroMD
Abstract
We present a new code allowing to evolve three-dimensional self-gravitating
collisionless systems with a large number of particles .
FLY (Fast Level-based N-bodY code) is a fully
parallel code based on a tree algorithm. It adopts periodic boundary
conditions implemented by means of the Ewald summation technique.
FLY is based on the one-side communication paradigm to share data among the
processors that access remote private data avoiding any kind of synchronism.
The code was originally developed on a CRAY T3E system
using the SHMEM library and it was ported on SGI ORIGIN 2000 and on
IBM SP (on the latter making use of the LAPI library).
FLY111http://www.ct.astro.it/fly/; version 1.1 is an open
source freely available code.
FLY data output can be analysed with AstroMD, an analysis and visualization
tool specifically designed to deal with the visualization and analysis of
astrophysical data.
AstroMD can manage different physical quantities. It can find out structures
without well defined shape or symmetries, and perform quantitative calculations
on selected regions. AstroMD222http://www.cineca.it/astromd; is a
freely available code.
Osservatorio Astrofisico di Catania, Catania - Italy
Cineca,Casalecchio di Reno (BO) - Italy
1. Introduction
FLY is the tree N-Body code we design, develop and use to run very big
simulations of the Large Scale Structure of the universe using parallel systems
MPP and SMP.
FLY uses the Leapfrog numerical integration scheme for performance reasons,
and incorporates fully periodic boundary conditions using the Ewald method.
The I/O data format is integrated with the AstroMD package.
AstroMD is an analysis and visualization tool specifically designed
to deal with the visualization and analysis of astrophysical data.
AstroMD can find structures having a not well defined shape or symmetries,
and performs quantitative calculations on a selected region or structure.
AstroMD makes use of Virtual Reality techniques which are particularly effective
for understanding the three dimensional distribution of the fields, their
geometry, topology and specific patterns. The display of
data gives the illusion of a surrounding medium into which the user is
immersed. The result is that the user has the impression of travelling through
a computer-based multi-dimensional model which could be directly
hand-manipulated.
2. FLY code
The FLY code, written in Fortran 90 and C languages, uses the one-side communication paradigm: it has been developed on the CRAY T3E using the SHMEM library. FLY is based on the following main characteristics. It adopts a simple domain decomposition, a grouping strategy and a data buffering that allows us to minimize data communication.
2.1. Domain decomposition
FLY does not split the domain with orthogonal planes, but the domain decomposition is done by assigning an equal number of particles to each processor. The input data particles is a sorted file containing the fields of position and velocity, so that particles with a near tag number are also near in the physical space, and the arrays containing the tree properties are distributed using a fine grain data distribution.
2.2. Grouping
During the tree walk procedure, FLY builds a single interaction list (IL) to be applied to all particles inside a grouping cell (). This reduces the number of the tree accesses to build the IL. We consider a hypothetical particle we call Virtual Body (VB) placed in the center of mass of the : the VB interaction list is formed by two parts:
| (1) |
where includes the elements more distant than a threshold parameter from VB and includes the elements near VB. Using the two lists it is possible to compute the force of each p particle in as the sum of two components:
| (2) |
The component is computed only once for VB, and it is applied to all the p particles, while the component is computed separately for each particle. The size of the , and the tree-level where it can be considered, is constrained by the maximum allowed value of the overall error of this method. In this sense the performance of FLY is a level-based code.
2.3. Data Buffering
The data buffer is managed with a policy of a simulated cache in the local RAM.
Every time the PE has to access a remote element, at first it looks for the
local simulated cache and, if the element is not found, the PE executes the
GET calls to down-load the remote element and stores it in the buffer.
In a simulation with 16-million-particles clustered, with 32 PEs and 256
Mbytes of local memory, without the use of the simulated cache, the PEs
execute about remote GETs. This value, using the data
buffering, decreases at remote GETs, with an enormous
advantage in terms of scalability and performance.
Fig. 1 shows the code performance on CRAY T3E system, obtained by running
simulations with 32 and 64 PEs, and FLY scalability, considering
the case of 16,777,216 particles, where a speed-up factor of 118 is reached
using 128 PEs.


The highest performance obtained in a clustered configuration is a positive effect of the grouping characteristic. The obtained results show that FLY has a very good scalability and a very high performance and it can be used to run very big simulations.
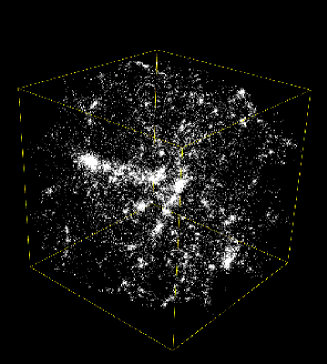
3. AstroMD package
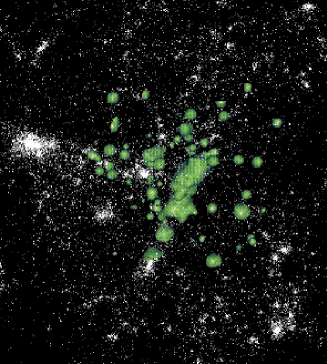
AstroMD is developed using the Visualization Toolkit (VTK) by Kitware, a freely available software portable on several platforms which range from the PC to the most powerful visualization systems, with a good scalability. Data are visualized with respect to a box which can describe the whole computational mesh or a sub-mesh. AstroMD can find structures having a not well defined shape or symmetries, and performs quantitative calculations on a selected region or structure. The user can choose the sample of the loaded particle type (i.e. stars, dark matter and gas particles), the size of the visualization box and the starting time from which he wants to show the evolution of the simulation. The Density entries control the visualization of the iso-surfaces. These are calculated on a grid whose resolution can be user-selectable. To allow the user to investigate with more accuracy a subset of the visualized system it is possible to use a cubic sampler. If the sampler is selected (Show/Hide menu), visualized in the scene and enabled (Sampler menu), all the computations are performed only inside the region of the sampler (Fig. 2).
AstroMD can also show the evolution in time of the simulated system over all the interval of time for which the data are available, performing interpolations at intermediate frames. During the evolution the updated time of evolution is displayed in the Time entry of the Cloud section. Finally snapshots of the images displayed can be created using the button Take it in the Screenshot menu. AstroMD is developed by the VISIT (Visual Information Technology) laboratory at CINECA (Casalecchio di Reno - Bologna) in collaboration with the Astrophysical Observatory of Catania.
References
Antonuccio-Delogu, V., Becciani, U., Pagliaro, A., Van Kampen, E., Colafrancesco, S., Germaná, A. and Gambera, M. 2000, submitted to MNRAS
Barnes, J.E. and Hut, P. 1986, Nature, 324, 446
Schroeder, W., Ken, M. , Lorensen, B. 1999, ”The Visualization Toolkit”, Prentice Hall
Becciani, U., Antonuccio-Delogu, V. 2000, J. Comput. Phys., 163, 118
Earnshaw, R.A., Watson, D. 1993, ”Animation and Scientific Visualization”, Academic Press ltd.
Qinn, T., Stadel, C. TIPSY http://www-hpcc.astro.washington.edu/tools/TIPSY
Salmon, J. and Warren, M.S. 1997, Proc. of the Eight Conf. on Parallel Processing for Scientific Computing, SIAM 1997