Chandra Reveals the X-ray Glint in the Cat’s Eye
Abstract
We have obtained Chandra ACIS-S observations of NGC 6543, the Cat’s Eye Nebula. The X-ray emission from NGC 6543 is clearly resolved into a point source at the central star and diffuse emission confined within the central elliptical shell and two extensions along the major axis. Spectral analysis of the diffuse component shows that the abundances of the X-ray-emitting gas are similar to those of the fast (1,750 km s-1) stellar wind but not those of the nebula. Furthermore, the temperature of this gas is 1.7106 K, which is 100 times lower than the expected post-shock temperature of the fast stellar wind. The combination of low temperature and wind abundances is puzzling. The thermal pressure of this hot gas is about twice the pressure in the cool nebular shell; thus, the hot gas plays an essential role in the ongoing evolution of the nebula.
1 Introduction
Optical emission-line images of planetary nebulae (PNs) reveal a fascinating range of morphologies (e.g., the Hubble Space Telescope gallery of PNs111URL: http://oposite.stsci.edu/pubinfo/pr/97/pn/), indicating complex internal structures in the nebulae. Among these PNs, NGC 6543, also known as the Cat’s Eye Nebula, has perhaps the most interesting morphology. As reported by Reed et al. (1999), the H and [O III] 5007 line images of NGC 6543 are similar, showing an inner shell surrounded by an envelope with multiple, interlocking, semi-circular features. The [N II] 6584 line image, on the other hand, shows bright clumps strung along arcs that appear to wrap around the envelope. In addition, the [N II] image shows two small curly features along the major axis and two linear jet-like features at 18∘ from the major axis. (See Figure 1 of Reed et al. (1999) for the [O III] and [N II] images of NGC 6543.)
What is the formation mechanism that has produced the complex nebular morphology of NGC 6543? It has been suggested that PNs are formed by the current fast stellar wind sweeping up the circumstellar material lost previously via the slow AGB wind (e.g., Kwok, 1983; Frank, Balick, & Riley, 1990). In this interacting-stellar-winds model, the physical structure of a PN is similar to that of a wind-blown bubble, as modeled by Weaver et al. (1977). The PN will comprise a central cavity filled with shocked fast wind at temperatures of 10 K, a dense shell of swept-up AGB wind at 104 K, and an outer envelope of unperturbed expanding AGB wind. This morphology is obviously too simple compared to the observed morphology of NGC 6543.
NGC 6543 is a known X-ray source and was marginally resolved by ROSAT observations (Kreysing et al., 1992; Guerrero, Chu, & Gruendl, 2000). Diffuse X-ray emission implies the existence of hot gas. It is thus important to resolve the diffuse X-ray emission and compare the distribution of hot gas to the location of the dense, cooler, nebular shell in order to understand the physical structure and formation mechanism of this nebula.
We have obtained Chandra observations of NGC 6543. Its diffuse X-ray emission is clearly resolved into several components and shows excellent correspondence with some of the optical features. In addition, a previously unknown point X-ray source is detected at the central star. We have extracted and modeled the spectra of the diffuse X-ray emission to derive the physical conditions of the hot gas. The results and their implications are reported in this Letter. The analysis of the point source will be reported in a future paper.
2 Observations
NGC 6543 was observed with the Advanced CCD Imaging Spectrometer (ACIS) on board the Chandra X-ray Observatory on 2000 May 10–11 for a total exposure time of 46.0 ks. The nebula was placed at the nominal aim point for the ACIS-S array on the back-illuminated (BI) CCD chip S3. The BI chip has a moderately higher sensitivity than the front-illuminated (FI) chips at energies below 1 keV. Furthermore, the BI chip is not affected by the inadvertent radiation damage (occurred immediately after the deployment of Chandra) as were the FI chips. The point spread function of the ACIS observation has a half power radius (the radius encircling 50% of the energy) 05 at 1 keV. The energy resolution, , of the BI chip is at 0.5 keV and at 1.0 keV.
The observations were carried out at a CCD operating temperature of C. The background count rate is consistent with the quiescent background (ACIS Background Report, 2000); therefore, no background “flares” affected the observations and no time intervals needed to be removed. A total of 1,95040 counts (background-subtracted) are detected from NGC 6543.
We received Level 1 and Level 2 processed data from the Chandra Data Center. The data reduction and analysis were performed using the Chandra X-ray Center software CIAO V1.1.5 and HEASARC FTOOLS and XSPEC V11.0.1 routines (Arnaud, 1996).
3 X-ray Emission from NGC 6543
3.1 Spatial Distribution
The X-ray emission from NGC 6543 is clearly resolved into a point source and a diffuse component, as shown in Figure 1. To describe the distribution of the X-ray emission, it is convenient to use optical features as points of reference; therefore, we plot the X-ray emission as contours over an archival HST H image. The initial overlay showed an offset of 1′′ between the point X-ray source and the central star. As this offset is within the range of combined pointing errors of HST and Chandra, we have shifted the X-ray image to register the point source at the central star. The resultant X-ray contours overlaid on the H image are presented in Figure 1d. The diffuse X-ray emission is well bounded by sharp, bright H filaments. This tight morphological correlation supports our choice of alignment between the X-ray and H images.
The X-ray-bounding H filaments outline a 10 elliptical shell with two outward extensions along the major axis (Figure 1c). The northern extension appears to be comprised of two closed lobes, while the southern extension appears to consist of an incomplete lobe that is open toward the east. The diffuse X-ray emission from the central elliptical shell is limb-brightened and follows closely the inner wall of the nebular shell in the H image. Diffuse X-ray emission is also present in the extensions. In the northern extension, diffuse X-ray emission fills each nebular lobe. In the southern extension, diffuse X-ray emission appears to be bounded even though the nebular lobe appears incomplete.
It is interesting to note that the western lobe in the northern extension and the eastern side of the southern extension appear to be radially aligned with the two linear, jet-like features best seen in Reed et al.’s (1999) [N II] image at 17 from the central star. This alignment may be naively used to suggest a physical connection between the diffuse X-ray emission along this direction and the jet-like features; however, as we show in §3.2, there is no spectral evidence supporting this hypothesis.
3.2 Spectral Properties
We have extracted spectra from the entire nebula and from three regions corresponding to the central elliptical shell, the northern extension, and the southern extension, respectively. The X-ray spectrum of the central elliptical shell was extracted with the central star excised. These spectra can be used to constrain the temperature, density, and abundances of the hot, X-ray-emitting gas, and to search for spatial variations in these physical conditions. The extracted spectra are plotted in Figure 2. In all cases the emission peaks at 0.55 keV, and then drops abruptly to a faint plateau between 0.7 and 0.9 keV. No significant emission is detected at energies greater than 1.0 keV. Below 0.5 keV, the spectra of the central shell and the southern extension drop off to nearly zero at 0.3 keV, while the spectrum of the northern extension levels and stays high at 0.3 keV.
The observed spectral shape depends on many physical parameters, including the temperature and chemical abundances of the X-ray-emitting gas, the intervening absorption, and the detector response. We adopt the thin plasma emission model of Raymond & Smith (1977). It is expected that the X-ray-emitting gas should have a chemical composition consistent with either the fast stellar wind itself or a mixture of the fast wind and the nebular material. The nebular abundances of He, C, N, O, and Ne have been reported to be 0.11, 2.310-4, 5.910-5, 5.610-4, and 1.410-4 relative to hydrogen by number, respectively (Aller & Czyzak, 1983; Pwa et al., 1984; Manchado & Pottasch, 1989). Accordingly, we have adopted nebular abundances, relative to the solar values (Anders & Grevesse, 1989), of 1.13, 0.63, 0.53, 0.66, and 1.14 for He, C, N, O, and Ne, respectively, and 1.0 for the other elements. For the abundances of the fast stellar wind, we have adopted He and N abundances 60 and 3 times the solar values, respectively, but kept the abundances of the other elements solar (de Koter et al., 1996). For the intervening absorption, we have assumed solar abundances and adopted absorption cross-sections from Balucinska-Church & McCammon (1992).
We first fit the observed spectrum of the diffuse X-rays from the entire nebula with models using the aforementioned nebular abundances, but with temperature, absorption column density, and the normalization factor as free parameters in the model. No models with nebular abundances can match the observed spectral shape. More specifically, the models produce either too strong O VII lines at 0.56 keV or too weak N VI lines at 0.43 keV. The spectral fits can be improved only if the N/O ratio is raised above the nebular value. The stellar wind has an enhanced N/O ratio, roughly three times the nebular value; consequently, models using stellar wind abundances fit the observed spectral shape much more satisfactorily.
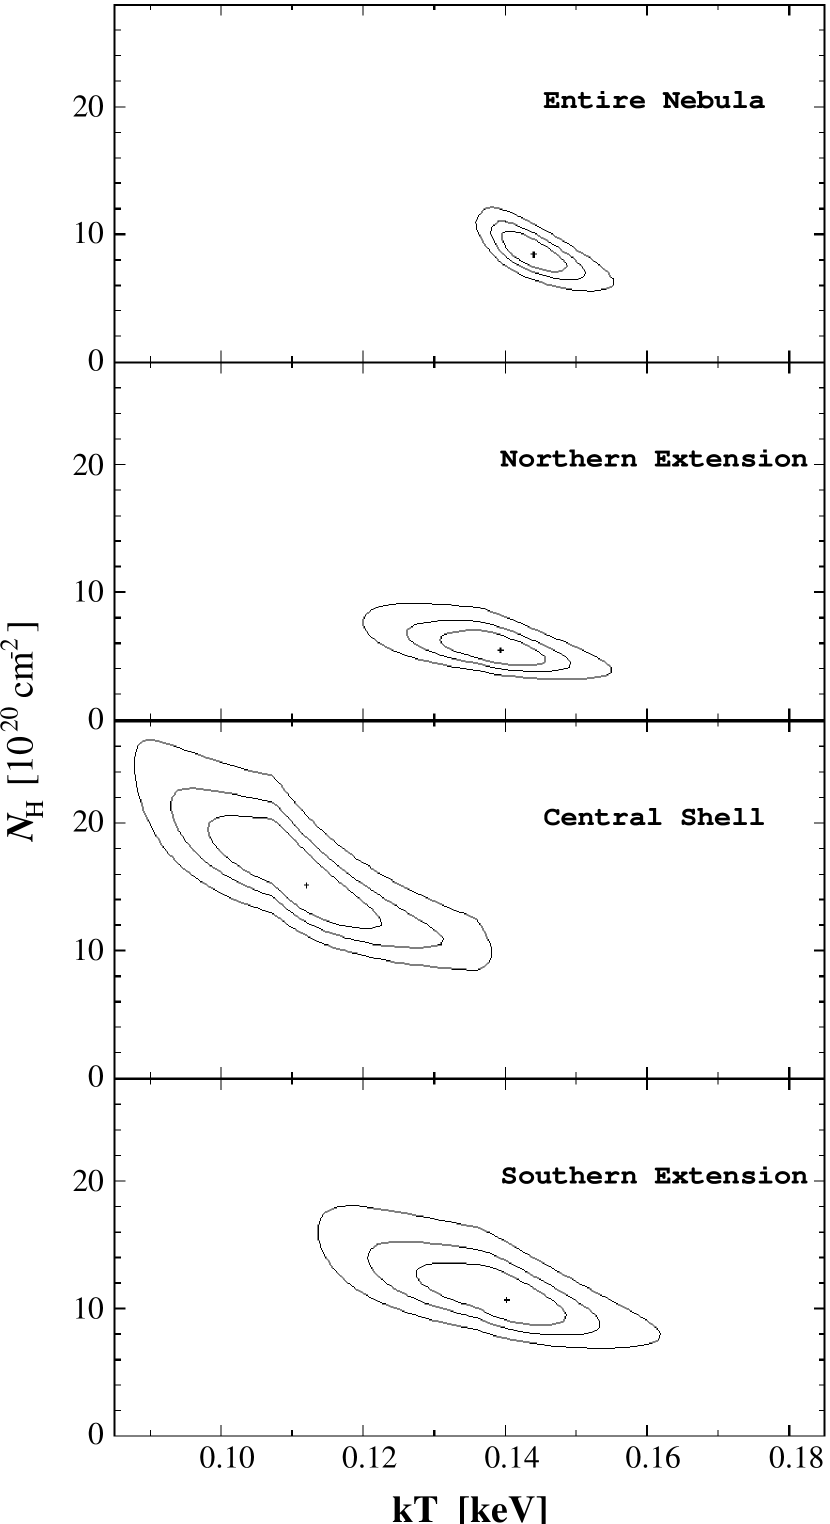
The best-fit model with stellar wind abundances has a plasma temperature of = 1.7106 K, an absorption column density of = 81020 cm-2, and a normalization factor of 710-5 cm-5. This best-fit model is overplotted on the spectrum of the entire nebula in Figure 2. The reduced of the fits as a function of and is plotted in Figure 3. The 99% confidence contour spans = 5.5–121020 cm-2 and = 1.6–1.8106 K (or = 0.135–0.155 keV). The observed (absorbed) X-ray flux is 810-14 ergs cm-2 s-1; the unabsorbed X-ray flux is 810-13 ergs cm-2 s-1, and the X-ray luminosity is 1.01032 ergs s-1 for a distance of 1 kpc (Cahn, Kaler, & Stanghellini, 1992; Reed et al., 1999).
We have also fit the spectra extracted from the central shell, and the northern and southern extensions. In these spectral fits we used the same stellar wind abundances as those adopted in the fits for the entire nebula. These three spectra have fewer counts, so the best-fit plasma temperature and absorption column are not as well constrained as those for the entire nebula. As indicated by the grid plots in Figure 3, the northern and southern extensions have very similar temperatures, but the northern extension has a smaller absorption column. The temperature and absorption column of the central shell are the least well constrained. Its grid plot indicates that the gas in the central shell may be cooler, more absorbed, or both.
The spectral fits suggest appreciable variation of absorption column across the 16′′ extent of the X-ray emission region of NGC 6543. NGC 6543 is at a high Galactic latitude, , so the foreground interstellar absorption column is not likely to vary rapidly over the 16′′ nebular extent. The absorption column density through the nebular envelope of NGC 6543, on the other hand, is expected to increase from the north to the south because the major axis of the nebula is tilted with its north end toward us (Miranda & Solf, 1992). Furthermore, the nebular envelope is brighter and denser near the equatorial plane of the central shell, thus would produce higher absorption columns toward the central shell and the southern extension. Therefore, the intervening absorption of the X-ray emission from NGC 6543 occurs mostly within its cool nebular shell.
Finally, we note that the temperature appears uniform, no variations greater than 50% are detected. We have extracted spatially-resolved spectra for the two lobes in the northern extension (not shown here). As described in §3.1, the western lobe is radially aligned with a jet-like [N II] feature, but both the eastern and western lobes display similar spectral shape, showing no evidence of additional dynamical heating in the western lobe. Therefore, either the jet-like [N II] feature is not a physically energetic phenomenon or the alignment is fortuitous.
4 Discussion
The physical properties of the hot gas in NGC 6543 can be compared with those expected in the wind-blown bubble model of Weaver et al. (1977). In this model, the bubble interior is filled by the adiabatically shocked fast stellar wind; however, the heat conduction and mass evaporation across the interface between the hot interior and the cool nebular shell raise the density, lower the temperature, and alter the abundances of the hot gas near the interface. The limb-brightened X-ray morphology of NGC 6543 indicates that the hot gas near the interface is responsible for the X-ray emission. Furthermore, the temperature derived from X-ray spectral fits, 1.7106 K, is 100 times lower than the post-shock temperature of NGC 6543’s 1,750 km s-1 wind (Perinotto et al., 1989), but may be consistent with that expected near the interface. The location and temperature of NGC 6543’s X-ray-emitting gas require that this hot gas contains a significant fraction of nebular material. In fact, if the mixing is adiabatic, the observed low temperature requires the X-ray-emitting gas to be dominated by nebular material. This is contrary to the results of our spectral fits, which indicate stellar wind abundances!
As an independent test to the origin of NGC 6543’s X-ray-emitting gas, we compare the mass of the hot gas to the amount of fast stellar wind supplied during the lifetime of the nebula. The electron density of the X-ray-emitting gas can be derived from the normalization factor of the spectral fit and distance. For a normalization factor of 710-5 cm-5, a distance of 1 kpc, and a He/H number ratio of 6, the rms electron density is 50 cm-3, where is the volume filling factor. The emitting volume, including the central shell and the extensions and taking into account of the 35∘ inclination of the major axis (Miranda & Solf, 1992), is 2.51051 cm3. The total mass of the X-ray-emitting gas is thus 2.510-4 M⊙.
The dynamical age of the Cat’s Eye’s central shell is 1,000 yr (Miranda & Solf, 1992; Reed et al., 1999). The stellar wind mass loss rate of the Cat’s Eye’s central star is uncertain, and ranges from 410-8 M⊙ yr-1 (Perinotto et al., 1989) to 3.210-7 M⊙ yr-1 (Bianchi et al., 1986). Within the dynamical age of the central shell, the total mass supplied by the stellar wind is 410-5 M⊙ to 3.210-4 M⊙. Comparisons between these values to the value derived from X-ray observations indicate that the fast stellar wind can supply most or all of the hot gas only if the high mass loss rate is adopted.
If the X-ray-emitting gas is comprised of largely shocked fast stellar wind, the low temperature of the X-ray-emitting gas is puzzling. How does the hot shocked wind cool from 1.4108 K to 1.7106 K within 1,000 yr? It is possible that the fast stellar wind is not steady and its velocity was lower in the past, as suggested by Arnaud, Borkowski, & Harrington (1996) for BD +30∘3639, another PN whose diffuse X-ray emission has been unambiguously resolved (Kastner et al., 2000). Future observations of more PNs with diffuse X-ray emission may help us solve this puzzle.
Finally, it is interesting to note that the Chandra image of NGC 6543 shows the hot, X-ray-emitting gas to be confined within the central shell and the two extensions along its major axis, but not associated with any of the intriguing optical features in the outer envelope. The thermal pressure of the hot interior is about twice as high as the pressure in the nebular shell, for a nebular electron density of 4,000 cm-3 and temperature of 7,000 K (Manchado & Pottasch, 1989). Clearly, the hot gas drives the expansion of the central shell, and governs the ongoing evolution of NGC 6543, but is not responsible for the complex optical features in the outer shell.
References
- ACIS Background Report (2000) ACIS Background Report 2000, prepared by Maxim Markevitch, 4/11/00, available at http://asc.harvard.edu/cal/Links/Acis/acis/Cal_prods/bkgrnd/04_11/bg110400.html
- Aller & Czyzak (1983) Aller, L. H., & Czyzak, S. J. 1983, ApJS, 51, 211
- Anders & Grevesse (1989) Anders, E., & Grevesse, N. 1989, Geochimica et Cosmochimica Acta 53, 197
- Arnaud (1996) Arnaud, K. 1996, in ASP Conf. Ser. 101. Astronomical Data Analysis Software and Systems V, eds. G. Jacoby & J. Barnes (San Francisco: ASP), 17
- Arnaud, Borkowski, & Harrington (1996) Arnaud, K., Borkowski, K. J., & Harrington, J. P. 1996, ApJ, 462, L75
- Balucinska-Church & McCammon (1992) Balucinska-Church, M., & McCammon, D. 1992, ApJ, 400, 699
- Bianchi et al. (1986) Bianchi, L., Cerrato, S., Grewing, M. 1986, A&A, 169, 227
- Cahn, Kaler, & Stanghellini (1992) Cahn, J. H., Kaler, J. B., & Stanghellini, L. 1992, ApJS, 94, 399
- de Koter et al. (1996) de Koter, A., Heap, S. R., Hubeny, I., & Lanz, T. 1996, in ASP Conf. Ser. 96, Hydrogen deficient stars, eds. C. S. Jeffery and U. Heber (San Francisco: ASP), 141
- Frank, Balick, & Riley (1990) Frank, A., Balick, B., & Riley, J. 1990, AJ, 100, 1903
- Guerrero, Chu, & Gruendl (2000) Guerrero, M., Chu, Y.-H., & Gruendl, R. A. 2000, ApJS, 129, 295
- Kastner et al. (2000) Kastner, J. H., Soker, N., Vrtilek, S., Dgani, R. 2000, ApJ, 545, L57
- Kreysing et al. (1992) Kreysing, H. C., Diesch, C., Zweigle, J., Staubert, R., Grewing, M., Hasinger, G. 1992, A&A, 264, 623
- Kwok (1983) Kwok, S. 1983, in IAU Symposium 103, Planetary Nebulae, ed. D. R. Flower (Dordrecht: Reidel), 293
- Manchado & Pottasch (1989) Manchado, A., & Pottasch, S. R. 1989, A&A, 222, 219
- Miranda & Solf (1992) Miranda, L. F., & Solf, J. 1992, A&A, 260, 397
- Perinotto et al. (1989) Perinotto, M., Cerruti-Sola, M., Lamers, H. J. G. L. M. 1989, ApJ, 337, 382
- Pwa et al. (1984) Pwa, T. H., Pottasch, S. R., & Mo, J. E. 1984, A&A, 139, 1
- Raymond & Smith (1977) Raymond, J. C., & Smith, B. W. 1977, ApJS, 35, 419
- Reed et al. (1999) Reed, D. S., et al. 1999, AJ, 118, 2430
- Weaver et al. (1977) Weaver, R., McCray, R., Castor, J., Shapiro, P., & Moore, R. 1977, ApJ, 218, 377