3C 236: Radio Source, Interrupted?
Abstract
We present new HST STIS/MAMA near-UV images and archival WFPC2 V and R band images which reveal the presence of four star forming regions in an arc along the edge of the dust lane in the giant (4 Mpc) radio galaxy 3C 236. Two of the star forming regions are relatively young with ages of order yr, while the other two are older with ages of order yr which is comparable to the estimated age of the giant radio source.
Based on dynamical and spectral aging arguments, we suggest that the fuel supply to the AGN was interrupted for yr and has now been restored, resulting in the formation of the inner 2 kpc scale radio source. This time scale is similar to that of the age of the youngest of the star forming regions.
We suggest that the transport of gas in the disk is non-steady and that this produces both the multiple episodes of star formation in the disk as well as the multiple epochs of radio source activity. If the inner radio source and the youngest star forming region are related by the same event of gas transport, the gas must be transported from the hundreds of pc scale to the sub-parsec scale on a time scale of yr, which is similar to the dynamical time scale of the gas on the hundreds of pc scales.
1 INTRODUCTION
3C 236 is a powerful classical double radio galaxy at relatively low redshift (z=0.1) (Willis, Strom, & Wilson 1974; Barthel et al. 1985; Schilizzi et al. 2000). Its angular size of 40 arcmin corresponds to a projected linear size of 4 Mpc (possibly 4.5 Mpc deprojected – Schilizzi et al. 2000) making it the largest known radio galaxy and even one of the largest known objects in the universe.222We adopt a Hubble constant of km s-1 Mpc-1 and a deceleration parameter of and at the redshift of 3C 236 () the scale is 1.68 kpc arcsec-1. There are no large scale radio jets detected in this source. The bright lobes do not connect to the core; however at low frequencies faint and diffuse bridges are seen (Mack et al. 1997; Waldram & Riley 1993). The nuclear radio source appears to be a small classical double source with an extent of 2 kpc and thus resembles a Compact Steep Spectrum (CSS)333See O’Dea (1998) for a review of Compact Steep Spectrum and GHz Peaked Spectrum radio sources. radio source (Fomalont, Miley, & Bridle 1979; Barthel et al. 1985). Van Gorkom et al. (1989) detected the 21 cm line of HI in absorption against the nuclear radio source (This has since been imaged with VLBI by Conway 1999). One of the most remarkable features of 3C 236 is the alignment of the inner 2 kpc component and with the overall 4 Mpc source structure to within a few degrees (Fomalont and Miley 1975), implying that the nuclear activity axis remains constant over times considerably in excess of yr. The observed constancy in direction was one of the earliest indications that rotating black holes power extragalactic radio sources.
The presence of the 2 kpc radio source inside the 4 Mpc radio source suggests that 3C 236 is a member of the class of “double-double” radio sources (see, e.g., Schoenmakers et al. 1999, 2000a,b; Kaiser, Schoenmakers & Röttgering 2000; Lara et al. 1999). Baum et al. (1990) have suggested that these sources are produced when (1) the radio activity is renewed after a period of dormancy so that the smaller and younger source is propagating outwards amidst the relic of the previous epoch of activity and/or (2) the radio activity is temporarily interrupted - perhaps by “smothering” of the radio source by infall of gas.444Christiansen (1973) has discussed repetitive activity in the context of plasma cloud models and Bridle, Perley & Henriksen (1986) have discussed a restarting jet model for 3C219. In the latter case the nuclear jets must propagate outwards though the infalling dense gas and reestablish a connection to the lobes. Hooda, Mangalam, & Wiita (1994) have presented numerical simulations which show that jets with low Mach numbers () may “stall” due to an instability (even if the jet is still being continuously fed by the nucleus). The stalled jet creates a new hot spot within the lobe of the source which then continues to propagate outwards.
Martel et al. (1999) presented an HST/WFPC2 image in the broad red (F702W) filter of the host galaxy of 3C 236. They show that the galaxy contains a broad dust lane and circumnuclear knots of emission. The properties of the dust are discussed further by De Koff et al. (2000). In this paper we present HST/WFPC2 V band (F555W) and STIS/NUV-MAMA near UV images which show that these knots are very blue and are likely to be young star clusters. We discuss the implications of the star formation for the fueling and life cycle of the radio activity.
2 HST WFPC2 and STIS OBSERVATIONS
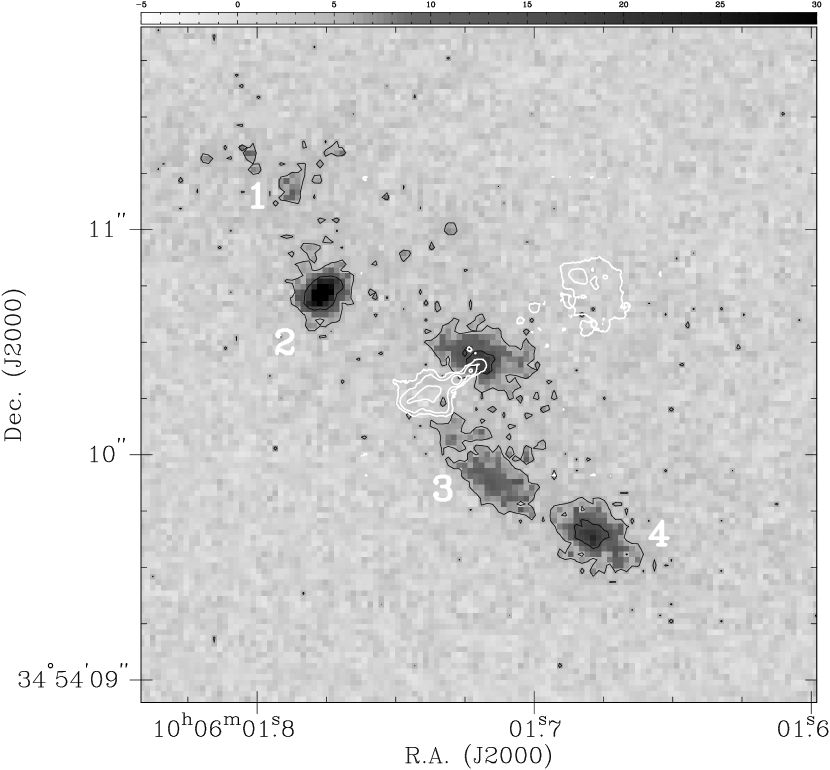
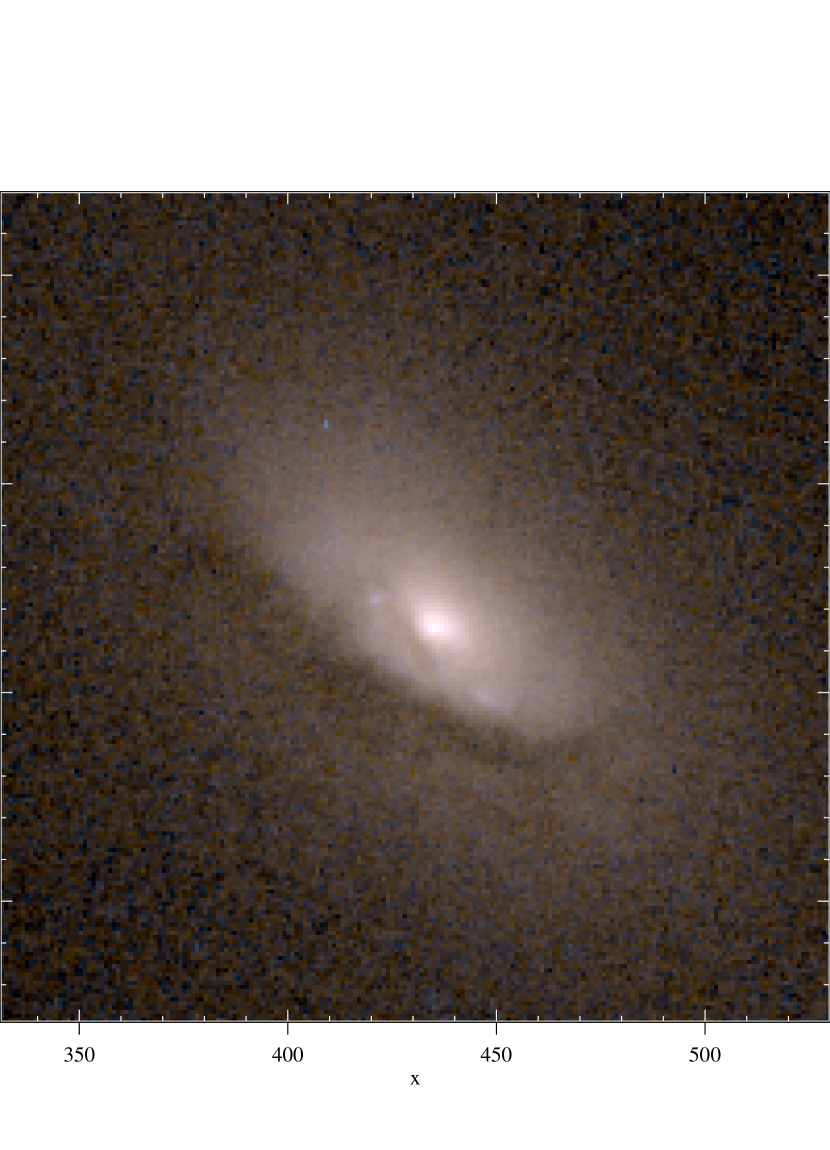
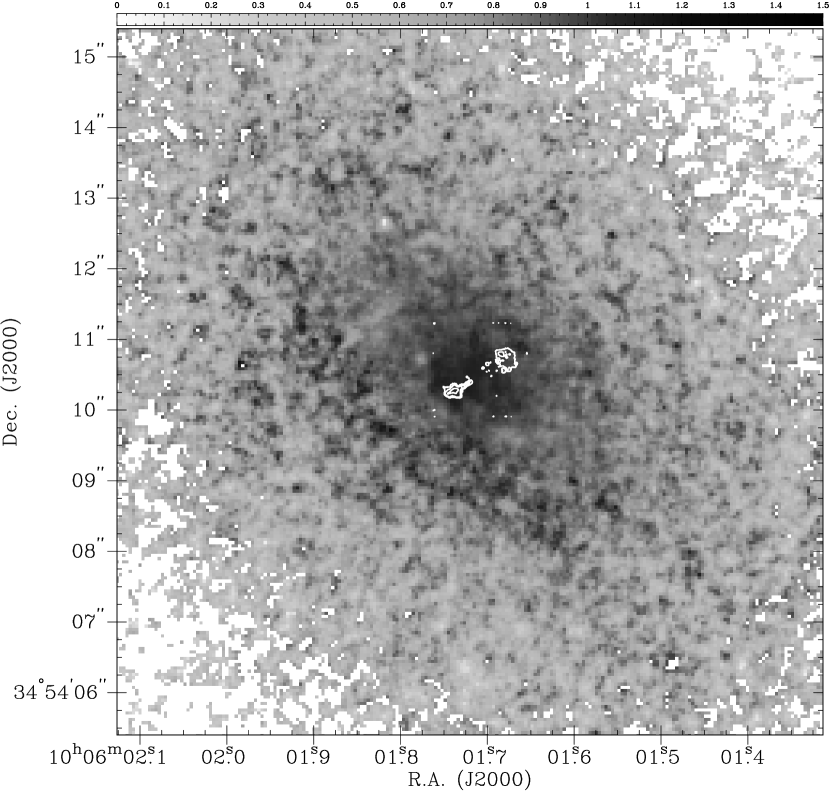
The HST observations were obtained as part of a snapshot survey of the 3CR sample by Sparks and collaborators (e.g., De Koff et al. 1996; McCarthy et al. 1997; Martel et al. 1999). 3C236 was observed on the PC of WFPC2 (Trauger et al. 1994). The F555W and F702W data were reduced as described by Martel et al. (1999). The STScI calibration pipeline was re-run using updated reference files. Cosmic rays were removed by combining both images with the CRREJ task in the STSDAS package in IRAF. The STIS NUV-MAMA (Kimble et al. 1998) images were reduced as described by Allen et al. (2000). Again the images were run though the STScI calibration pipeline using the best available reference files. The parameters of the observations are given in Table 1. Our STIS NUV-MAMA image is presented in Figure 1 and a three color image created by combining the STIS and WFPC2 data is shown in Figure 2.
3 RESULTS
Our main new observational result is the detection of several very blue resolved knots on the eastern edge of the dust lane (Figures 1 and 3). First we set the stage by discussing the large-scale dust lane that extends across much of the galaxy along its major axis; and the inner “disk” of dust. We then discuss the properties of the very blue knots that we have detected with STIS, including their colors, luminosities and inferred star-formation characteristics; and finally the relationship between the radio continuum emission and the optical/UV morphology of the galaxy.
3.1 Large-Scale Dust Lane and Inner Dust Disk
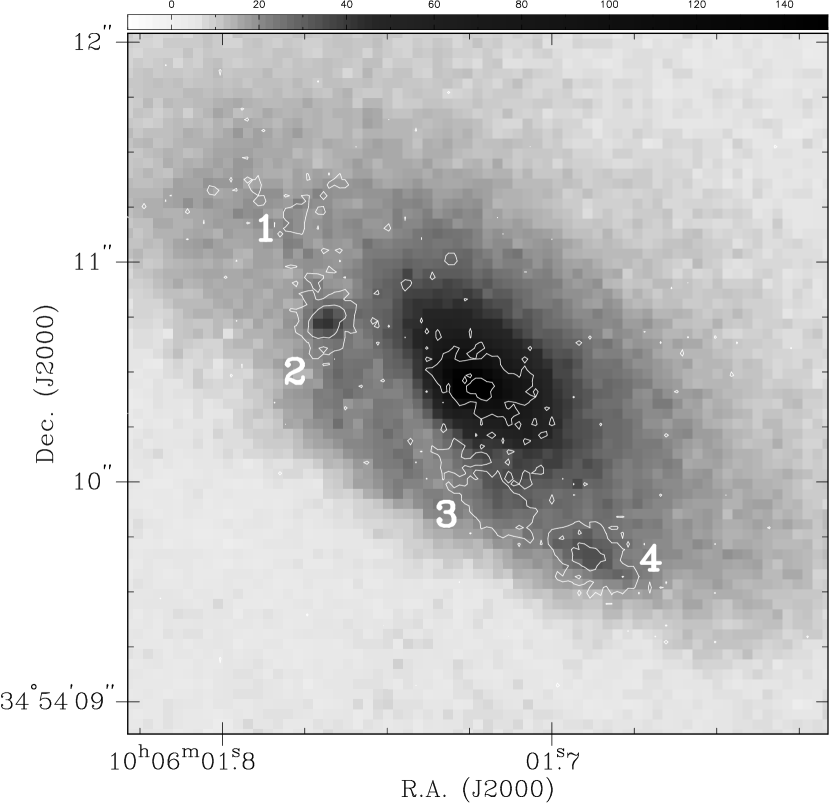
In the broad-band images (e.g., Martel et al. 1999) there are significant signs of asymmetric obscuration by a system of dust lanes (with an overall PA) across the galaxy. Figures 3 and 4 show the relationship of the blue knots to the dust lane. In particular, the F555W image (Figure 3) clearly shows a deficit of galaxy continuum immediately south of the blue knots, relative to the continuum level at corresponding radial distances in the north. Asymmetric deficits in the underlying elliptical morphology are also evident to the east and north-east of the galaxy nucleus.
To investigate more quantitatively the extent and depth of the obscuration, we used the IRAF “ellipse” task to fit a set of elliptical isophotes to the underlying continuum in the F702W image. This band should be less susceptible to obscuration than the F555W image and thereby better constrain the fit. We also imposed additional constraints on the fit, including fixing the center of the isophotes (thus their symmetry about the nucleus) and masking out obscured regions in order to minimize their impact on the fit. The parameters of the ellipse fit are shown in Figure 5.
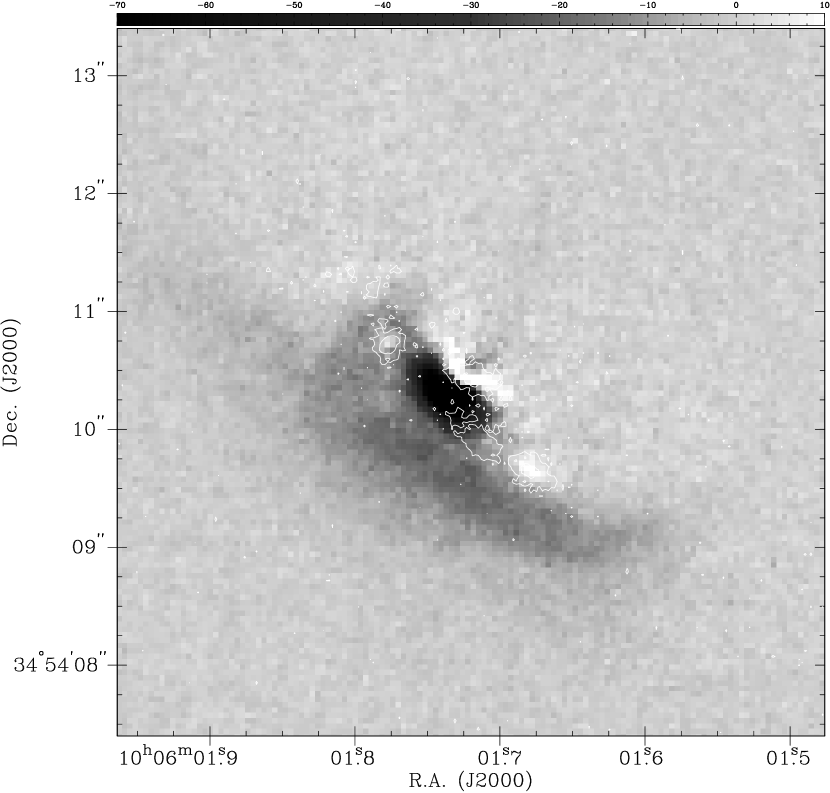
In Figure 4 we show the residual image produced after fitting the elliptical model to the underlying R-band galaxy continuum emission and subtracting this fit from the image. A large band of obscuration kpc in extent is clearly visible along the major axis of the galaxy. This can also be seen in the F555W-F702W color image of the galaxy (Fig 6). The residual image also indicates substantial obscuration relatively close to the nucleus, along with additional arcs and loops of obscuration to the east and north-east of the nucleus. The implications of these features are discussed further in Section 4.
Our color image (Figure 2) shows what appears to be an inner narrow dust disk in projection at a position angle of . (A hint of this is also seen in the absorption image of De Koff et al. 2000). The disk has a projected size of 06 (1 kpc). This inner disk is about 5 degrees from perpendicular to the inner radio source ().
3.2 Properties of the near-UV Knots
We detect a number of extended regions in our STIS/NUV-MAMA image (Figures 3 and 4). There are four very blue regions located in an arc along the eastern edge of the dust lane at a distance of (800 pc) from the nucleus. The regions are resolved with sizes (500 pc). The properties of the knots are given in Table 2 (calibrated in the HST VEGAMAG system - where the magnitude of Vega in the WFPC2 filters is defined to be zero). At the redshift of 3C236 (z=0.1005) there are no bright emission lines present in our F25SRF2 filter. The knots are located on the edge of the dust lane and are not related to the radio source or to an ionization cone. The most sensible explanation for the knots is that they are regions of recent and/or current star formation.
We compare the measured properties of the blue continuum to a set of stellar population synthesis models (Bruzual & Charlot 1993; Charlot & Bruzual 2000), which have been K-corrected to the redshift of 3C 236 and calibrated in the HST VEGAMAG system using our HST filter bandpass transmission curves. We find it preferable to retain our measured magnitudes in the VEGAMAG system and compare them with models that have also been calculated in this system, rather than attempting to transform the magnitudes to other systems such as the Johnson/Cousins system, because uncertainties in the color terms can translate into errors of several tenths of a magnitude. The models are shown in Figure 7 and represent two scenarios for star formation: (1) a constant star formation rate (SFR), assuming an invariant IMF; (2) an instantaneous burst of star formation (or “Simple Stellar Population”, SSP). In each case we investigated two standard IMFs for which models were available, namely Salpeter (1955) and Scalo (1986), each with upper and lower mass cutoffs of 0.1 and 100 respectively. We also examined models of different metallicities, specifically Abundance , 0.2, and 0.02 (where is the solar abundance). Further details of the model parameterizations are described in Charlot & Bruzual (1991, 2000) and Bruzual & Charlot (1993). Having calculated HST colors and magnitudes for these various models, we note that the difference between the color evolution of and 0.2 models is minimal for the constant SFR models, thus for the purposes of clarity we only plot the 0.2 models. For the SSP models, the color evolution is more sensitive to metallicity but is relatively insensitive to the choice of IMF, therefore the SSP models that we plot are for the Salpeter IMF only.
In Figure 7 we plot the evolution in color-age and color-color space of three population synthesis models with a Salpeter IMF, metallicities of , 0.2 and 0.02, together with the observed blue clusters, as well as the surrounding galaxy and the nuclear region. The comparison suggests that the colors of the two bluest clusters are consistent with ages Myr and metallicities above , with ages of the two redder of these clusters ranging up to a maximum of Myr. The reddest of the four clusters is either much older ( yr) with a mass , or otherwise is the same age as the other three, but has higher extinction and/or a metallicity significantly above solar (however, this cluster is fainter than the other three and its properties are not as well constrained). In § 4 we discuss in further detail the implications of the measured properties of the blue continuum regions for various physical mechanisms that can be responsible for triggering the star formation.
In Table 3 we present the inferred star formation parameters that are required to match the observed range of colors and integrated absolute magnitude of the extended blue continuum distribution, for the various star formation scenarios that we have described. For each model, we tabulate the upper and lower limits of the range of epochs in its evolution that reproduce our observed color, as well as the color. For constant SFR models, the SFR for each of the two epochs is obtained by matching the model to the absolute magnitude. For the instantaneous burst models we tabulate the total mass of stars (an SFR is not physically meaningful in this case since the burst is represented by a delta-function).
We point out that the inferred ages are all highly dependent upon the measured colors, and should therefore be interpreted as upper limits due to the likely presence of reddening across most of the field. For example, a decrease in the intrinsic color by only a further 0.2 magnitudes will yield ages as low as yr for the continuous SFR models, and yr for the instantaneous burst models. In summary, although the exact ages are uncertain and are model dependent, we do find that the knots span a range in age with two of the knots being significantly younger ( Myr) than the other two ( Myr).
3.3 Comparison between the Radio and HST Images
In Figures 8 and 6 we show an overlay of the global VLBI 1.66 GHz radio image (Schilizzi et al. 2000) superposed onto the HST/WFPC2 F555W broad-band and F555W-F702W color images. The registration between the two images was performed on the the assumption that the position of the radio core is coincident with the optical nucleus of the galaxy in the F555W and F702W images (this is slightly different to the apparent registration in the Schilizzi et al. paper where the radio core is identified with a STIS knot that is to the north-east of the broad-band nucleus of the galaxy). Furthermore, there is no other strong correspondence between the kpc-scale radio structure and the blue knots that we detect with STIS.
4 DISCUSSION
4.1 The Dust Lane and Inner Disk
Gas acquired via cannibalism is expected to be smeared into a disk on a dynamical timescale yr (e.g., Gunn 1979; Tubbs 1980). It will then precess around one of the preferred planes of the galaxy, dissipating angular momentum and finally settling into one of the preferred planes of the galaxy on the precession timescale yr (Gunn 1979; Tubbs 1980; Tohline, Simonson, & Caldwell 1982; Habe & Ikeuchi 1985). The dissipation of angular momentum will also result in gas being transported inwards towards the galaxy nucleus (e.g., Christodoulou & Tohline 1993). In 3C 236 the dust lane seems asymmetric and filamentary (De Koff et al. 2000; and Figure 4) and is misaligned with the inner disk suggesting the lane is still “dynamically young”. This indicates that the host galaxy has recently ( yr) acquired gas from a companion.
3C 236 is in a very poor environment and is considered by Zirbel (1997) to have no obvious group members within 0.5 Mpc (based on a statistical correction for background contamination). The donor galaxy for the gas could have already been “eaten”. However, we do detect a small candidate companion galaxy located at 10.1 arcsec (17 kpc) from the nucleus along PA 20∘ in our WFPC2 images.
The mass of dust in the dust lane is estimated by De Koff et al. (2000) to be M⊙ based on both HST absorption maps and IRAS luminosities. The corresponding gas mass is M⊙ based on the standard gas-to-dust ratio. Thus, the dust lane appears to be very massive. The large amount of gas in the disk could supply fuel for a long time and would have allowed the radio galaxy to grow to its extremely large size. The relatively sparse environment of the galaxy may also be an important factor in producing the large radio source.
The absorption from the dust lane appears to be greater on the south-east side of the galaxy, consistent with that side of the lane coming out of the galaxy towards us. This would imply that the north west radio jet is oriented towards us and the south east jet is oriented away from us (as also inferred by Schilizzi et al. 2000 using De Koff et al.‘s image).
4.1.1 Stability of the Alignments
A summary of the relevant position angles are given in Table 5. The orientation of the large scale (4 Mpc) radio source is 122.5∘ (Willis et al. 1974; Barthel et al. 1985). The “overall” orientation of the kpc scale central source is - though there are wiggles in the kpc scale jet and departures from this overall orientation - and on the parsec scale, the orientation of the jet is (Barthel et al. 1885; Schilizzi et al. 2000). Thus, over the lifetime of the radio source ( yr, § 4.3) and over a factor of range in size scale, the jets remain aligned to within about 10∘. The large and small scale radio source are aligned to within a few degrees of perpendicular to the “inner” (1 kpc) dust disk which has a projected major axis of but are poorly aligned with the perpendicular to the larger dust lane which has a projected major axis of . Thus, the radio source axis is approximately perpendicular to the dust disk - as found in many radio galaxies (e.g., Kotanyi & Ekers 1979; De Koff et al. 1996; Verdoes et al. 1999).
The Bardeen-Petterson effect will cause the black hole to swing its rotation axis into alignment with the rotation axis of the disk of gas (on scales of hundreds to thousands of Schwarzschild radii) which is feeding it; and conversely will keep the spin axis of the inner disk aligned with the BH spin (e.g., Bardeen & Petterson 1975; Rees 1978). The time scale for alignment of the spin axes is uncertain, but for typical parameters expected in the current paradigm will be in the range yr (Scheuer & Feiler 1996; Natarajan & Pringle 1998). This is much shorter than the radio galaxy life time and ensures that the jet will be ejected aligned with the angular momentum vector of the (large scale) accretion disk.
The combination of the long term stability of the jet ejection axis and the alignment of the jets with the inferred rotation axis of the inner kpc-scale dust disk suggests that the orientation of the inner dust disk has also been stable over the lifetime of the radio source. This is consistent with the inner dust disk being in a stable resonant orbit - most likely in either an oblate (Tohline et al. 1982) or triaxial galaxy (Merritt & de Zeeuw 1983). This also implies that the outer misaligned dust lane (which presumably feeds the disk) settles into the same preferred plane as the disk.
4.2 The Star Forming Regions in the Dust Lane
We note that the 3CR UV snapshot survey results suggest that a significant fraction () of powerful nearby radio galaxies show evidence for extended regions of star formation (Allen et al. 2000) – consistent with early reports of blue colors in powerful radio galaxies (e.g., Smith & Heckman 1989; McNamara & O’Connell 1992; McNamara 1995). The lack of a direct relationship between the radio source and the the starburst (in contrast to the more powerful objects at higher redshift) suggests that these are not jet/cocoon-induced starbursts, but may be “infall-induced”. This suggests that (1) infall-induced starbursts are common in nearby radio galaxies and (2) the lifetimes of the starbursts are similar to that of the radio sources (which is luminosity dependent, but is typically estimated to be yr, e.g., Parma et al. 1999).
The analysis of the star burst colors suggests that the star formation has been triggered over a range of time scales ranging from perhaps a yr for the younger knots to about yr for the older knots. The triggering mechanism of the star bursts is not known, but may be due to (1) cloud-cloud collisions of clouds in adjacent orbits due to differential precession in the disk or (2) gas clouds continuing to fall into the disk.
The star formation in the disk suggests that gas continues to be transported into the nucleus and possibly fueling the nuclear activity. However the range of ages of the starbursts suggests that the transport of gas into the nucleus may be clumpy and sporadic, with different star bursts being triggered by different events of infall/transfer of gas. Thus, the existence of non-uniform transport of gas in the disk may be responsible for both (1) the range of ages of the star-forming regions, and (2) the apparent episodic nature of the radio source.
4.3 The Relationship between the Starbursts and the Radio Source
The large-scale source has a total projected linear size of about 4 Mpc. The projected length of the south eastern side of the source is about 24 arcmin (2.4 Mpc). The minimum age of the large scale source is then
| (1) |
where is the advance speed of the lobe. For a canonical expansion speed of 0.03c (e.g., Scheuer 1985; Alexander & Leahy 1987), the minimum age is yr. The radio source age is similar to the dynamical time scale in the galaxy and the age estimates for the older starbursts suggesting that the large scale radio galaxy and the initiation of the starbursts are both related by a common event, i.e., the infall of gas.
We note that the star bursts appear to be confined to the dust disk and are not associated with the small scale radio source. Thus, there does not appear to have been any significant “jet-induced” star formation in this source. This is consistent with the hypothesis that the dense gas is mostly confined to the plane of the disk and avoids the radio source (which seems to be perpendicular to the dust disk).
Conway (1999) and Conway & Schilizzi (in preparation) present VLBI imaging of the HI absorption towards the inner radio source. He shows significant HI absorption towards the south-east jet/lobe, but none towards the north-west lobe. This is consistent with the south-east jet being viewed through the dust lane while the north-west jet is in front of the dust lane. Conway (1999) suggests that there is evidence from the kinematics of the HI for a possible interaction between the south-east jet/lobe and the HI gas. This interaction would explain the asymmetry in the kpc-scale radio source (i.e., the SE side is brighter and shorter than the NW side). We note that such an interaction, if present, has not produced any detectable star formation.
4.4 The Relationship of the Small and Large Radio Sources
Here we consider the possible relationships between the small (2 kpc) and large (4.5 Mpc) scale radio sources. The small source could be (1) brightness enhancements (knots) in the inner part of the large scale jet; (2) a young source which has resumed activity after a period of dormancy of the active nucleus; (3) the location of the working surfaces of the jet due to infall of gas which has smothered the radio jet and temporarily interrupted the supply of energy to the lobes.
4.4.1 Bright Inner part of Continuous Jet
The morphology of the small source argues against the first possibility. The small source does not resemble knots in the inner parts of jets. Instead, we see structures which look like lobes marking the ends of the jet. The spectral indices of the small source show a range of values extending to very steep spectra (Schilizzi et al. 2000). These steep spectra are more consistent with those of radio lobes than with knots in jets which tend to be (e.g., Bridle & Perley 1984). Schilizzi et al. have suggested that the radio jet extends in a continuous fashion from the core to the lobes based on faint emission seen in the low frequency low resolution images. However, (1) an alternate explanation for the faint emission is that it is a low surface brightness cocoon or “bridge” and (2) in a continuous jet scenario there is still an unexplained sudden transition in the jet properties at the scale of the kpc source. Thus, for the rest of the discussion we consider further only the second and third scenarios.
4.4.2 Young Source
If the central 2 kpc source is a young source, then its age is given by
| (2) |
where, for an advance speed of c, the minimum age is yr. This is much younger than the youngest of the star forming regions in the dust lane. Note that a difference in the ages is to be expected since the star formation occurs on the kpc scale and the jet is fed on the sub-parsec scale.
We assume that the steep spectra in the small source found by Schilizzi et al. indicate radiative aging of the electrons, rather than an intrinsically steep electron spectrum. This implies that the dynamical age of the source is greater than its radiative age. For a given magnetic field, this gives an upper limit on the lobe advance speed where is the distance between the core and hot spot and is the electron radiative lifetime, due to synchrotron and inverse Compton losses
| (3) |
where is the frequency (in Hz), is the magnetic field in Gauss, and is the equivalent magnetic field of the microwave background (e.g., van der Laan & Perola 1969). We plot the upper limit to the lobe expansion speed as a function of magnetic field strength adopting a size of 1 kpc and a frequency of 5 GHz in Figure 9. At the equipartition magnetic field in the two lobes A and C of a few hundred G the particle lifetime is yr and the upper limit to the expansion velocity is a few percent of the speed of light.
In the young source scenario, the nucleus becomes dormant possibly due to a lack of fuel to the central engine, the jets cease, and the previously ejected jet material traverses the length of the source in the light travel time (assuming the jet bulk velocity is relativistic) shutting off the energy supply to the hot spots (e.g., Baum et al. 1990; Schoenmakers et al. 2000a,b; Kaiser et al. 2000). We assume that the particles are accelerated primarily in the hot spots (perhaps by Fermi acceleration in the Mach disk - Blandford & Ostriker 1978 or MHD turbulence - De Young 2000) and that the acceleration will cease when the jet no longer feeds the hot spot. Thus, the particle population will age once the hot spots are no longer fed. If the jet bulk velocity is relativistic as commonly assumed in powerful classical doubles, then the jets will propagate to the hot spots in about yrs. Then, the ages of the youngest electrons in the lobe provides a constraint on the dormancy period of the nucleus. This assumes that the spectral aging estimates are dominated by the younger and brighter electron population (see also Jones, Ryu, & Engel 1999). This appears to be the case since the age estimated from spectral aging is significantly less than the dynamical age based on the likely lobe propagation velocity.
The dormancy period could be longer if (1) the acceleration continues for some timescale after the jet ceases to feed the hotspot, (2) the jet propagation to the lobes is significantly slower than light speed, or (3) the spectral aging estimates are in error (see, e.g., Tribble 1993; Rudnick, Katz-Stone, & Anderson 1994).
The radio spectral aging estimates from Mack et al. (1998) are consistent with ages for the electrons in the hot spots of order yr. This would imply a dormancy period for the nucleus of yr. If this is the correct model, it would imply that even though the dust lane is present, the flow of material to the nucleus is not continuous; instead it is clumpy and sporadic on time scales of yr. Alternately, there could be an additional factor responsible for the duty cycle of the central engine which is not directly related to the fuel supply (e.g., some property of the magnetic field in the accretion disk which varies on time scales of yr).
4.4.3 Interrupted Source
In the third scenario, the nucleus is active continuously; however, dense gas clouds fall into the path of the radio jet and block the passage of both jets. The energy supply to the lobes is then cut off until the jets are able to burrow through the clouds and re-establish a connection to the lobes.
This scenario requires that both jets be cut off symmetrically. The existence of HI absorption towards the radio source and the evidence for possible interaction between the south-east jet and the HI gas would support the interrupted source scenario. However, there is no evidence for interaction of the north-west lobe with ambient gas. In general, it seems like it would be more difficult to block both jets with infalling gas than it would be to simply shut off the fuel supply to the engine (i.e., no infall).
As in the previous scenario, the particles in the hot spots will age after the energy supply is cut off. In this scenario, the time over which the jets have been blocked, the age of the youngest electrons in the hotspots, and the age of the small source should all be similar – i.e., yr adopting the spectral aging estimates of Mack et al. (1998). This age seems extremely long for such a compact source and would imply the existence of a cocoon of very steep spectrum emission - which has not been detected (Schilizzi et al. 2000).
Thus, in the interrupted source scenario the two jets have been blocked for about yr by dense gas. This requires (1) the presence of dense gas surrounding the jets, and (2) the age of the kpc-scale source to be yr. However, as we have argued above, there is no evidence that both jets have been blocked. At present, (1) the very old implied age for the compact radio source and the lack of very steep spectrum radio emission and (2) the lack of evidence for strong confinement of both jets by dense gas are problems for the scenario that the radio source has been interrupted by infalling gas.
4.5 Non-steady Flow in the Disk?
The fact that the dust lane is asymmetric, filamentary, and is misaligned with the inner disk suggests that is dynamically young. During this phase it is expected to be precessing around the preferred plane and dissipating angular momentum and transporting gas inwards to the nucleus through processes such as viscosity and cloud-cloud collisions (e.g., Shlosman, Begelman, & Frank 1990). The collisions of these clumps and filaments in the disk may well trigger the observed star formation. The range of estimated ages for the star forming regions implies that the star formation is triggered over a range of time scales and is not based on a single event. Thus, the existence of the observed clumps and filaments in the dust lane as well as the range of ages of the star formation regions suggests that the transport of gas through the disk to the nucleus is clumpy and non-steady.
As we have discussed, the properties of the inner 2 kpc radio source are consistent with a scenario in which the fuel supply to the nucleus was interrupted for yr and has now been restored. This apparent intermittancy in the fuel supply is evidence that the transport of fuel on the sub-parsec scale is also clumpy and non-steady. The outflows in young stellar objects and Herbig-Haro objects also appear to show evidence for non-steady fueling and repetitive activity (e.g., Reipurth, Raga & Heathcote 1992; Bally & Devine 1994; Eisloffel & Mundt 1997). Thus, we suggest that the range of ages in the star forming regions and the repetitive activity in the AGN in 3C 236 are both due to non-steady transport of gas in the disk on their respective scales.
We note that a one-to-one correspondence in the age of the young inner radio source and the youngest starburst in the dust lane is not necessarily expected since the dynamical time on the hundreds of pc scale where the star formation occurs ( yr) is longer than the dynamical time scale on the sub-pc scale where the fueling of the AGN occurs. However, if the young radio source and the youngest star forming region are both produced by the same “disturbance” propagating inwards through the disk, then we can use the difference in the ages of the youngest starburst ( yr) and the inner radio source ( yr) to constrain the propagation time. Thus, in the context of this scenario, the time for the gas to be transported in from the hundreds of pc scale to the sub-parsec scale is no more than yr which is comparable to the dynamical time on the hundreds of pc scale. If this is correct, it implies that nature is able to solve the angular momentum problem on these scales and that clumps of gas are transported inwards on the dynamical time scale.
5 SUMMARY AND THE BIG PICTURE
We present HST WFPC2 V and R band images and STIS/MAMA NUV images which reveal the presence of four star forming regions in the dust lane in the giant (4 Mpc) radio galaxy 3C 236. The dust lane appears to be asymmetric and is misaligned with the inner disk suggesting it is still dynamically young. The dust lane appears to be quite massive ( M⊙) (De Koff et al. 2000) and clumpy.
Two of the star forming regions are relatively young with ages of Myr and metallicities above , while the other two are older with ages ranging up to a maximum of Myr. yr. We note that the age of the giant radio source is likely to be yr. Thus, the star formation appears to be coeval with the radio source lifetime. The star formation and the radio source may both be the common results of infall of gas to the host galaxy.
We consider two hypotheses for the small kpc-scale source in 3C 236. (1) It may be a young source ( yr) which has resumed activity after a period of nuclear dormancy of about yr (based on the spectral ages of the electrons in the radio lobes). (2) It may be a continuously active source in which infalling gas has interrupted the jet flow to the lobes for a period of about yr. Both the “young” and “interrupted” source scenarios require that energy is no longer being supplied to the hot spots. This should be tested with high resolution radio observations of the hot spots. Currently, the rather old age required for the small source and the apparent lack of a mechanism for confining the radio source make the interrupted source hypothesis less appealing.
The simultaneous existence of the small and large radio source is consistent with repetitive activity in the nucleus on time scales of yr. The repetitive nuclear activity may be tied to time dependence in the infall of fuel on the same time scale. This time scale is similar to that of the ages of the younger of the star forming knots. The range of ages of the star forming regions implies repetitive triggering/fueling of the star formation activity in the dust lane. Thus, there is evidence for non-steady activity on both size scales in which clumps of gas are transported inwards to the nucleus on the dynamical time scale.
We suggest that the transport of gas in the disk is non-steady over a large range of size scales and that this produces both the multiple episodes of star formation in the disk as well as the multiple epochs of radio source activity.
References
- (1)
- (2) Alexander, P., & Leahy, J. P., 1987, MNRAS, 225, 1
- (3)
- (4) Bally, J., & Devine, D., 1994, ApJ, 428, L65
- (5)
- (6) Bardeen, J. M., & Petterson, J. A., 1975, ApJ, 195, L65
- (7)
- (8) Barthel, P. D., Schilizzi, R. T., Miley, G. K., Jägers, W. J., & Strom, R. G., 1985, A&A, 148, 243
- (9)
- (10) Baum, S. A., O’Dea, C. P., Murphy, D. W., & de Bruyn, A. G. 1990, A&A, 232, 19
- (11)
- (12) Baum, S. A., et al. 1997, ApJ, 483, 178, erratum 1998, ApJ, 492, 854
- (13)
- (14) Blandford, R. D., & Ostriker, J. P., 1978, ApJ, 221, 29
- (15)
- (16) Bridle, A. H., Perley, R. A., & Henriksen, R., 1986, AJ, 92, 534
- (17)
- (18) Bruzual, A. G., & Charlot, S., 1993, ApJ 405, 538
- (19)
- (20) Charlot, S., & Bruzual, A. G., 1991, ApJ 367, 126
- (21)
- (22) Charlot, S., & Bruzual, A. G., 2000, in preparation
- (23)
- (24) Christiansen, W. A., 1973, 164, 211
- (25)
- (26) Christodoulou, D. M., & Tohline, J. E., 1993, ApJ, 403, 110
- (27)
- (28) Conway, J. E., 1999, NewAR, 43, 509
- (29)
- (30) De Koff, S., Baum, S. A., Biretta, J., Golombek, D., Macchetto, F. D., McCarthy, P. J., Miley, G. K., & Sparks, W. B., 1996, ApJS, 107, 621
- (31)
- (32) De Koff, S., Best, P., Baum, S. A., Sparks, W. B., Röttgering, H., Miley, G. K., Golombek, D., Macchetto, F. D., & Martel, A., 2000, ApJS, 129, 33
- (33)
- (34) De Young, D. S., 2000, in proceedings of the workshop on “Particles and Fields in Radio Galaxies,” in press.
- (35)
- (36) Eisloffel, J., & Mundt, R., 1997, AJ, 114, 280
- (37)
- (38) Fomalont, E. B., & Miley, G. K., 1975, Nature, 257, 99
- (39)
- (40) Fomalont, E. B., Miley, G. K., & Bridle, A. H., 1979, A&A, 76, 106
- (41)
- (42) Gunn, J. E., 1979, in Active Galactic Nuclei, ed. C. Hazard & S. Mitton, (Cambridge: Cambridge University Press), p. 213
- (43)
- (44) Habe, A., & Ikeuchi, S., 1985, ApJ, 289, 540
- (45)
- (46) Hooda, J. S., Mangalam, A. V., & Wiita, P., 1994, ApJ, 423, 116
- (47)
- (48) Jones, T. W., Ryu, D., & Engel, A., 1999, ApJ, 512, 105
- (49)
- (50) Kaiser, C. R., Schoenmakers, A. P., & Röttgering, H. J. A., 2000, MNRAS, 315, 381
- (51)
- (52) Kimble, R. A., et al. 1998, ApJ, 492, 83L
- (53)
- (54) Kotanyi, C., & Ekers, R.D., 1979, A&A, 73, L1
- (55)
- (56) Lara, L., Márquez, I., Cotton, W. D., Feretti, L., Giovannini, G., Marcaide, J. M., & Venturi, T., 1999, A&A, 348, 699
- (57)
- (58) Mack, K.-H., Klein, U., O’Dea, C. P., & Willis, A. G., 1997, A&AS, 123, 423
- (59)
- (60) Mack, K.-H., Klein, U., O’Dea, C. P., Willis, A. G., & Saripalli, L., 1998, A&A, 329, 431
- (61)
- (62) Martel, A. R. et al. 1999, ApJS, 122, 81
- (63)
- (64) McNamara, B. R., & O’Connell, R. W., 1992, ApJ, 393, 579
- (65)
- (66) McNamara, B. R., 1995, ApJ, 443, 77
- (67)
- (68) Merritt, D., & De Zeeuw, T., 1983, ApJ, 267, L19
- (69)
- (70) Natarajan, P., & Pringle, J. E., 1998, ApJ, 506, L97
- (71)
- (72) Norman, M. L., 1993, in Astrophysical Jets, eds. D. Burgarella, M. Livio, C. P. O’Dea, (Cambridge: Cambridge University Press), 211
- (73)
- (74) O’Dea, C. P., 1998, PASP, 110, 493
- (75)
- (76) Parma, P., Murgia, M., Morganti, R., Capetti, A., de Ruiter, H. R., & Fanti, R., 1999, A&A, 344, 7
- (77)
- (78) Rees, M. J., 1978, Nature, 275, 516
- (79)
- (80) Reipurth, B., Raga, A. C., & Heathcote, Steve, 1992, ApJ, 392, 145
- (81)
- (82) Rudnick, L., Katz-Stone, D. M., & Anderson, M. C., 1994, ApJS, 90, 955
- (83)
- (84) Salpeter, E. E., 1955, ApJ 121, 161
- (85)
- (86) Scalo, J., 1986, Fundamentals of Cosmic Physics 11, 1
- (87)
- (88) Scheuer, P. A. G., 1995, MNRAS, 277, 331
- (89)
- (90) Scheuer, P. A. G., & Feiler, R., 1996, MNRAS, 282, 291
- (91)
- (92) Schilizzi, R. T., Tian, W. W., Conway, J. E., Nan, R., Miley, G. K., Barthel, P. D., & Normandeau, M., 2000, A&A, in press
- (93)
- (94) Shlosman, I., Begelman, M. C., & Frank, J., 1990, Nature, 345, 679
- (95)
- (96) Schoenmakers, A. P., de Bruyn, A. G., Röttgering, H. J. A., & van der Laan, H., 1999, A&A, 341, 44
- (97)
- (98) Schoenmakers, A. P., de Bruyn, A. G., Röttgering, H. J. A., van der Laan, H., & Kaiser, C. R., 2000a, MNRAS, 315, 371
- (99)
- (100) Schoenmakers, A. P., de Bruyn, A. G., Röttgering, H. J. A., & van der Laan, H., 2000b, MNRAS, 315, 395
- (101)
- (102) Smith, E. P., & Heckman, T. M., 1989, ApJ, 341, 658
- (103)
- (104) Tohline, J. E., Simonson, G. F., & Caldwell, N., 1982, ApJ, 252, 92
- (105)
- (106) Trauger, J. T., et al. 1994, ApJ, 435, 3L
- (107)
- (108) Tribble, P. C., 1993, MNRAS, 261, 57
- (109)
- (110) Tubbs, A. D., 1980, ApJ, 241, 969
- (111)
- (112) van der Laan, H., & Perola, G. C., 1969, A&A, 3, 468
- (113)
- (114) van Gorkom, J. H., Knapp, G. R., Ekers, R. D., Ekers, D. D., Laing, R. A., & Polk, K. S., 1989, AJ, 97, 708
- (115)
- (116) Verdoes Kleijn, G. A., Baum, S. A., de Zeeuw, P. T., & O’Dea, C. P., 1999, AJ, 118, 2592
- (117)
- (118) Waldram, E. M., & Riley, J. M., MNRAS, 265, 853
- (119)
- (120) Willis, A. G., Strom, R. G., & Wilson, A. S., 1974, Nature, 250, 625
- (121)
- (122) Zirbel, E. L., 1997, ApJ, 476, 489
- (123)
| Date | Program ID | Instrument | Filter | Time |
|---|---|---|---|---|
| Sec | ||||
| 1995-05-07 | 5476 | WFPC2/PC1 | F702W | 4 x 140 |
| 1996-06-12 | 6348 | WFPC2/PC1 | F555W | 2 x 300 |
| 1999-01-03 | 8275 | STIS/NUV-MAMA | F25SRF2 | 1440 |
| ID | Size | |||||||
|---|---|---|---|---|---|---|---|---|
| (″) | (″) | (″) | (mag) | (mag) | (mag) | |||
| 1 | 8 | 8 | 02 | 25.910.07 | 26.740.36 | 25.950.23 | 0.43 | 0.58 |
| 2 | 6 | 3 | 03 | 23.890.03 | 23.760.08 | 24.050.09 | 0.11 | 0.17 |
| 3 | 1 | 3 | 0402 | 24.040.03 | 26.440.30 | 26.700.34 | 0.34 | 0.64 |
| 4 | 4 | 5 | 0302 | 23.910.03 | 23.120.06 | 22.870.05 | 0.09 | 0.11 |
| nuc | 23.880.03 | 20.930.02 | 20.190.01 | 0.05 | 0.04 |
Note. — For each object, the offsets in Right Ascension and Declination ( and respectively) are given in arc-seconds relative to the continuum nucleus of the galaxy. The 1 uncertainties are derived from the count-rate statistics.
| Model | Regions 1 & 3 | Regions 2 & 4 | ||
|---|---|---|---|---|
| Const. SFR: | SFR (/yr) | SFR (/yr) | ||
| 0.2 | ||||
| 0.02 | ||||
| Inst. Burst: | ) | ) | ||
| 0.2 | ||||
| 0.02 | ||||
Note. — The upper and lower limits of the timescale of each model correspond to the epochs in the model evolution that produce the observed range of colors. For the Constant SFR models, the tabulated SFR is that which is required to match the observed integrated magnitude of the knots. For the Instantaneous Burst models, we instead tabulate the total mass of stars since in this model all the star formation occurs at one instant in time. Further details are given in the text.
| Feature | Position Angle | Ref |
|---|---|---|
| Degrees | ||
| Kpc-scale Radio Source | 115 | 1,2 |
| Mpc-scale Radio Source | 122 | 1,3 |
| inner dust disk | 30 | 4,5 |
| outer dust lane | 55 | 4,5,6 |
| host galaxy | 45 | 4 |
References. — 1. Barthel et al. (1985). 2. Schilizzi et al. (2000). 3. Willis et al. (1974), 4. This paper. 5. De Koff et al. (2000). 6. Martel et al. (1999).