Infrared constraints on the dark mass concentration observed in the cluster Abell 1942
Abstract
We present a deep -band image of the region in the vicinity of the cluster Abell 1942 containing the puzzling dark matter concentration detected in an optical weak lensing study by Erben et al. (2000). We demonstrate that our limiting magnitude, , would be sufficient to detect clusters of appropriate mass out to redshifts comparable with the mean redshift of the background sources. Despite this, our infrared image reveals no obvious overdensity of sources at the location of the lensing mass peak, nor an excess of sources in the vs. colour-magnitude diagram. We use this to further constrain the luminosity and mass-to-light ratio of the putative dark clump as a function of its redshift. We find that for spatially-flat cosmologies, background lensing clusters with reasonable mass-to-light ratios lying in the redshift range 0z1 are strongly excluded, leaving open the possibility that the mass concentration is a new type of truly dark object.
keywords:
gravitational lensing – galaxies: clusters: individual: Abell 1942 – infrared: galaxies – cosmology: dark matter1 Introduction
Gravitational lensing offers the most practical route to tracing the spatial distribution of dark matter and its relationship to that of the radiating baryonic component. Most progress has been made in rich galaxy clusters through both detailed studies of strongly-lensed features of known spectroscopic redshift (e.g. Kneib et al. 1996) and weak lensing analyses, where elaborate tools have been developed to convert the measured coherent alignment of faint background galaxies into the projected cluster mass density field (Kaiser & Schneider 1993, Schneider 1996). The resulting lensing mass distributions appear to agree reasonably well with those inferred from the optical light over a range of scales (Smail et al 1995, Bonnet et al. 1994). Although discrepancies have been reported in the concentration of the inferred dark matter relative to that of the baryonic component (Miralda-Escudé & Babul 1995), the uncertainties remain significant and there is not yet a compelling case for distinct distributions of dark and visible matter (Smail et al. 1996, Allen 1998).
Deep imaging surveys are now beginning to explore the spectrum of mass concentrations outside rich clusters (Wittmann et al. 2000, van Waerbeke et al. 2000, Bacon et al. 2000, Kaiser et al. 2000). These so-called ‘cosmic shear’ field surveys are primarily concerned with a statistical description of the weak lensing signal as a function of angular scale. They could also provide further constraints on the presence or otherwise of concentrations with high mass-to-light ratios. Although the detection of dark halos without significant baryonic material would represent a considerable challenge to standard theories for the origin of structure, it is important to examine the observational constraints.
In an important paper, Erben et al. (2000) report the first detection of a dark matter halo not obviously associated with any light. Using two wide field optical images of the rich cluster Abell 1942 (=0.224), they find a highly significant secondary peak in the reconstructed mass distribution located about 7 arcmin south of the cluster centre (in addition to also finding a strong signal corresponding to the cluster itself). An archival ROSAT/HRI image shows a 3.2 source close (but not precisely co-located) with this secondary mass peak. A marginal overdensity of galaxies in their -band image is claimed by Erben et al. The authors are unable to associate the lensing signal with the X-ray source on the assumption that both represent a distant projected cluster and conclude that the mass concentration identified via their lensing study is either a distant cluster unrelated to the X-ray source, or tantalisingly, a dark halo of 31014 located within the cluster.
The burden of proof for the existence of such a dark clump within Abell 1942 is high. As Erben et al. discuss, the mass-to-light ratio inferred depends sensitively on its (unknown) redshift. Quite reasonable mass-to-light ratios are implied if the clump is placed at high redshift but the inferred mass then also increases. The most conservative explanation would place the clump at 0.8 with 450 (for an Einstein-de Sitter cosmology). Deeper imaging at infrared wavelengths represents one obvious way to eliminate or confirm this explanation.
In this paper we follow up the optical study of Erben et al. (2000) with a deep -band (1.6 m) image analysis. As the infrared -correction is considerably smaller and more uniform across the Hubble sequence of galaxy types than is the case at optical wavelengths, deep infrared imaging is a powerful tool for exploring the existence or otherwise of all galaxy populations at high redshifts. Our goal is to extend the analysis of Erben et al. and to attempt to locate the origin of this puzzling lensing signal.
Our paper is structured as follows. In 2 we discuss the unique advantages of using an infrared imager to constrain the properties of the proposed dark clump by demonstrating that, at achievable limiting magnitudes, we can reasonably expect to see most conventional clusters to the mean redshift of the background population used by Erben et al. (2000). In 3 we describe our deep -band observations of Abell 1942 and discuss their reduction and suitability in terms of our achieved limiting magnitude. 4 presents our analysis of the likely -band light associated with both the dark matter clump and the nearby X-ray source. No convincing excess is seen in either case and we convert the observed flux limits into new constraints on the mass-to-light ratio of the putative clump. We present our conclusions in 5.
2 Strategic Issues
Erben et al. (2000) imaged Abell 1942 in both the and photometric bands using different imaging cameras on the 3.5m Canada-France-Hawaii Telescope. The dark clump was inferred from the weak shear signals observed in both datasets. Although their 4.5 hour -band image provides the most significant detection of the dark clump, because of the strong -correction for early type galaxies beyond 0.5, the 3 hour -band image provides the most interesting constraints on the presence of a distant lensing cluster.

Erben et al. claim the mean redshift of the background population at their limit of 24.5 is 0.7-0.8 (although no spectroscopic data yet exists to such a faint limit and a higher mean redshift cannot be ruled out). A key strategic question for this paper is, therefore, the depth necessary at near-infrared wavelengths (specifically in the -band in which our observations are conducted), to better detect background clusters up to the redshift limit appropriate for the -band image, say 1.
Using the colour -correction, , for spheroidal galaxies taken from the analysis of Menanteau et al. (1999), a cluster elliptical with =24.5 at the mean redshift of the background population would be expected to have =21.7. However, there is a further advantage of conducting cluster searches in the infrared in that the contrast of cluster members at faint limits against the field population is much greater than in the optical because of the smaller optical -correction for the bulk of the intervening field population.
We can define the observed contrast of a cluster (following Couch et al. 1991), where is the field-subtracted number of cluster galaxies brighter than the limiting magnitude of the survey within some physical aperture, and is the rms of the background field counts on the scale of that aperture. We will investigate the effects of the -correction in the - and -bands on the visibility of a rich cluster with redshift, using previously presented data for Abell 2219 (Gray et al. 2000).
Abell 2219 is a richness class III cluster at , a similar richness and redshift to Abell 1942. We determine by counting galaxies within an aperture of radius 60 arcsec (corresponding to a physical radius of kpc at this redshift) using the colour selection of Gray et al. (2000). By comparing this number with that found with the same aperture and colour selection applied to offset fields we determine that roughly 20% of these are field galaxies, and correct by this factor. Using -corrections of Menanteau et al. (1999) we may determine what - and -band magnitudes these cluster galaxies would have if the cluster were shifted to higher redshift, and what fraction of those galaxies would then be brighter than the limiting magnitudes of and . At each redshift we measure of the field counts in an aperture corresponding to the angular size of the physical aperture at that redshift, and calculate the contrast, .
Fig. 1 shows the results of this calculation. Abell 2219 itself at yields a detection in the -band and a detection in the -band. To the level we would be able to see such a cluster to in and in . This demonstrates the advantage of searching for clusters in the infrared: for a given cluster, the contrast is greater and remains greater to much higher redshift due to the advantageous effects of the -correction and reduced numbers of field galaxies. If the unexplained mass detection of Erben et al. (2000) were the result of a high-redshift cluster similar to Abell 1942 or Abell 2219, then for a limiting magnitude we would expect to be able to make a detection in the -band to the redshift limit they present for such a cluster.
For such a magnitude limit we may also determine how poor a cluster we could detect. For a cluster at Fig. 1 shows that a richness class III cluster has . We would therefore detect a cluster at that redshift with 3/5 as many galaxies at the level. Using the relations between numbers, richness, and mass of van Kampen & Katgert (1997) this means that to we would be able to detect a cluster with roughly 80% the mass of Abell 2219, or a richness class II cluster.
3 Observations
| date | exposures | total exposure time |
|---|---|---|
| (seconds) | ||
| 2000 Feb 17 | 116 | 5220 |
| 2000 Feb 18 | 21 | 945 |
| 2000 Feb 19 | 78 | 3510 |
| 2000 Mar 19 | 27 | 1215 |
Infrared imaging data for the rich cluster Abell 1942 () were taken over four nights in February and March 2000 using the Cambridge Infrared Survey Instrument (CIRSI, Beckett et al. 1998) on the 2.5m du Pont telescope at Las Campanas, Chile. CIRSI is a wide-field infrared imager composed of four 1K 1K Rockwell Hawaii HgCdTe detectors, with a gap of approximately one detector width between each array. On the Dupont telescope the pixel scale is 0.2 arcsec/pixel, corresponding to a field of view of arcmin for each detector.
The instrument pointing was arranged so that one chip imaged the core of Abell 1942, one chip imaged the dark lump region as indicated by the mass maps of Erben et al. (2000), and the remaining two chips covered adjacent blank sky regions. This configuration ensured that the infrared data would overlap the existing CFHT UH8K -band image (which has a similar pixel size of 0.24 arcsec/pixel) whilst providing essential background field count data.
The deep CIRSI -band observations were made using 45 second exposures with a nine-point dither pattern. Typically three or four exposures were taken at each dither position, followed by an offset of 9 or 15 arcsec. Table 1 summarizes the observations.
The CIRSI data were reduced using the pipeline developed by one of us (JRL) for the Las Campanas Infrared Survey (Marzke et al. 1999, Firth 2000). Flat field frames were created from dome flats and bad pixel masks constructed from the data. The images at each dither position were coadded and flat fielded, followed by a first-pass sky subtraction. Object masks were constructed for the sky-subtracted images and these masks were used to perform a second-pass running sky subtraction on the original images. A reset anomaly present in the data was corrected by median filtering the rows and columns of each quadrant of each image. The offsets between images due to the dithering pattern were calculated, and a tangent plane world coordinate system (WCS) was fitted. A final weighted image was constructed for each chip using the WCS for each exposure. The regions of low S/N where the overlap was not complete were discarded, and the resulting images measured arcmin per chip. The median seeing for the final coadded images was 0.7.
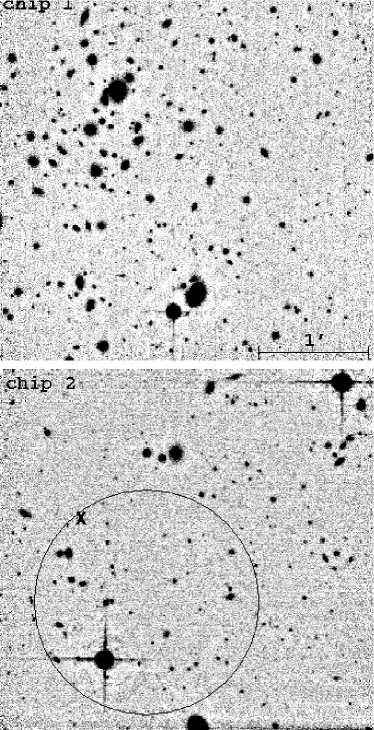
Standard stars were chosen from the near-infrared catalogue of Persson et al. 1998. Dither sequences were calibrated using the standard star observations from the relevant night. A set of secondary standards within the sub-images were then measured and used to calculate the zeropoint of the final weighted image. Fig. 2 shows two of the four resulting chip images: the cluster core and the ‘dark lump’ region.
Object catalogues were created for each chip image using SExtractor 2.0 (Bertin & Arnouts 1996) with a detection threshold of 1.5 above the noise level and requiring an object to have at least 6 connected pixels. Isophotal magnitudes were measured separately for the CIRSI -band and the UH8K -band image (described in Erben et al. 2000). SExtractor was then run in double image mode to measure an colour using the -band isophot (when registered to the -band image). Additional catalogues were created encompassing those objects seen in only one of the bands.
The turnover in the number counts reveals magnitude limits of and (the latter in agreement with the results quoted by Erben et al. ) for the two images. To further test the magnitude limits of the -band data we performed completeness tests. Using the artdata package in IRAF we added galaxies of known magnitude to the data and recovered them using SExtractor as above. The simulations were performed ten times, with 50 galaxies being added in random locations each time. Fig. 3 shows that a 50% completeness level is achieved at a limiting magnitude of .

4 Analysis
4.1 Search for a high-redshift cluster
We begin our analysis of the dark clump region by adopting the hypothesis that the mass concentration arises from a background cluster whose contrast was not sufficiently large in the optical images available to Erben et al. (c.f. Fig. 1). We will first examine this possibility in terms of the colours of sources in the region of the dark lump, later examining the possibility of a cluster recognisable via images found only via their detection in the CIRSI image.
4.1.1 Colour-based search
The key ingredients necessary for recognising a distant cluster are a faint limiting magnitude and contrast against the background field. Conceivably, a distant cluster can be rendered visible within Erben et al.’s -band image by combining with our -band image and searching for the signature of an appropriately red colour-magnitude relation of its early-type galaxies so that its contrast is increased. Early-type galaxies in clusters have been shown to obey a linear relation on the colour-magnitude diagram with extremely small scatter (Bower, Lucey & Ellis 1992a,b). This relation has been exploited to detect and confirm clusters via their red sequence (Gladders & Yee 2000, da Costa et al. 1999).
Fig. 4 shows the colour-magnitude diagrams for the four chips based on the matched catalogues. In the case of chip 1 containing the Abell 1942 cluster core, the sequence of =0.22 early-type galaxies is clearly visible. However no sequence with redder colours can be detected in the chip 2 containing the dark matter lump (or, in fact, in any other chip). We quantified this result by searching for an excess contrast in chip 2 c.f. the mean of that found in the other chips according to colour slices selected with an appropriate colour-magnitude slope.
The cluster sequence bounded by the parallel lines in Fig. 4 is described by the relation
which agrees well with the colour-magnitude relation measured in Abell 2219 using the same filters (Gray et al. 2000). We use this gradient, , to divide the colour-magnitude diagram for each of the four CIRSI chips into colour bins. We choose a width of 0.2 mag for the colour slices, and overlap successive bins to allow for any potential cluster galaxies that may span more than one bin. Comparing the excess numbers in each bin with the errors derived from the average for that bin for chips 2,3, and 4 (those chips not containing the core of Abell 1942) we calculate a contrast, , for each colour slice and each chip. These results are summarized in Table 2.
| chip 1 | chip 2 | chip 3 | chip 4 | (A2219) | ||
|---|---|---|---|---|---|---|
| 1.012 | 0.45 | 1.79 | 1.34 | 0.45 | ||
| 1.112 | 0.65 | 2.84 | 2.19 | 0.65 | ||
| 1.212 | 0.33 | 2.67 | 2.00 | 0.67 | ||
| 1.312 | 0.27 | 1.07 | 0.80 | 1.87 | ||
| 1.412 | 0.31 | 0.31 | 1.23 | 1.54 | ||
| 1.512 | 1.75 | 1.09 | 0.22 | 1.31 | ||
| 1.612 | 4.90 | 0.82 | 0.41 | 1.22 | ||
| 1.712 | 8.16 | 0.53 | 0.07 | 0.46 | ||
| 1.812 | 13.13 | 0.29 | 0.94 | 1.23 | 4.60 | 0.30 |
| 1.912 | 7.60 | 0.00 | 0.89 | 0.89 | 5.07 | 0.35 |
| 2.012 | 0.29 | 0.29 | 0.51 | 0.79 | 5.52 | 0.40 |
| 2.112 | 0.08 | 0.08 | 0.82 | 0.91 | 5.67 | 0.45 |
| 2.212 | 1.71 | 0.45 | 1.26 | 1.71 | 5.63 | 0.48 |
| 2.312 | 3.46 | 0.87 | 2.02 | 2.89 | 5.63 | 0.53 |
| 2.412 | 1.53 | 0.11 | 1.42 | 1.53 | 5.83 | 0.59 |
| 2.512 | 0.60 | 0.84 | 0.60 | 0.24 | 5.04 | 0.79 |
| 2.612 | 1.92 | 0.57 | 0.91 | 1.47 | 5.60 | 0.82 |
| 2.712 | 1.23 | 0.86 | 0.86 | 1.72 | 5.17 | 0.93 |
| 2.812 | 0.28 | 0.56 | 1.12 | 0.56 | 5.20 | 0.98 |
| 2.912 | 0.86 | 0.62 | 0.49 | 0.12 | 5.87 | 1.00 |
| 3.012 | 0.14 | 0.14 | 0.28 | 0.14 | 5.99 | 1.06 |
| 3.112 | 0.17 | 0.17 | 0.87 | 0.70 | 6.04 | 1.12 |
| 3.212 | 1.09 | 0.22 | 0.22 | 0.44 | 6.32 | 1.18 |
Abell 1942 is detected in the and neighbouring bins for chip 1 with a peak significance of . However, the remaining three chips (in particular chip 2, containing the putative dark lump) show no colour slices for which . We do, however, see a detection for the bin in chip 1. This marginal detection corresponds to the sequence visible with colours mag redder than the Abell 1942 sequence in Fig. 4. These colours are consistent with those of early-type galaxies at . However, when the positions of the 25 galaxies in this bin are plotted on the sky, they show no obvious clustering and are spread nearly evenly across the four quadrants of chip 1. They are therefore not likely to be in physical association. Similarly, a slight overdensity is seen in the and bins in chip 2 but these galaxies show no angular clustering and are not co-located with the dark lump region.

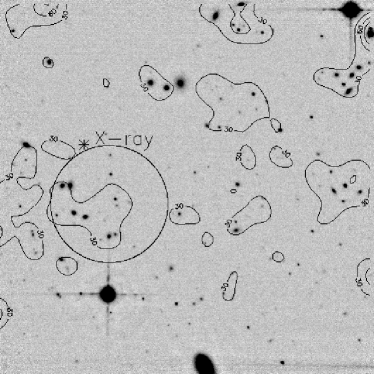
Erben et al. reported a slight overdensity of galaxies in their -band image approximately 60 arcsec from the location of the mass peak and close to the X-ray source. We also detect this marginal concentration in the matched - and -band catalogues (Figure 5). However, when we examine the location of those galaxies in this excess region on the colour-magnitude relation, no obvious trend is found. Even allowing for field contamination, at most 2-3 galaxies have colours appropriate for a high redshift cluster and the colour variation from galaxy to galaxy is considerable.

4.1.2 Population of H-only objects?
Next, we turn our attention to the faintest -band objects in the CIRSI image including those sufficiently faint that Erben et al. did not detect them in their -band image. As we showed in 2, the reduced -correction in the -band makes it possible that a distant cluster could be seen in the CIRSI image but not in the -band data (c.f. Figure 1).
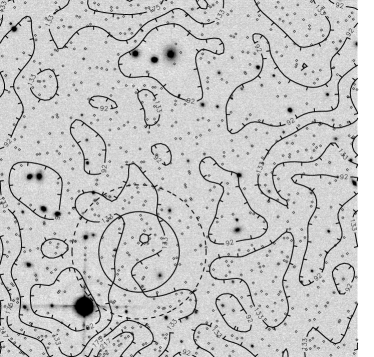
In this case we utilised a SExtractor catalogue based only on the -band image, foregoing the formal magnitude limit on the assumption that the magnitude-dependent selection function is positionally invariant across the detectors (Gray et al. 2000). Figure 6 shows the location of all the sources that consist of at least 5 connected pixels whose surface brightness lies 1 above the mean background. Again, the number of sources within an aperture centred on the location of the dark lump deviates by less that from the mean value determined for 10 randomly-placed apertures on the same chip. This statement is true both for sources to and to the catalogue limit, and for apertures of 18 and 36 arcsec radii (corresponding to the and dispersion for the centroid of the Erben et al. mass peak). As shown previously in , we expect a significantly stronger signal in the case of even a richness class II cluster at .
In conclusion, neither the colour-based nor the -band search has turned up a convincing case for any physical association of background sources in the region of the mass peak. Most importantly, the colours of sources in this region show a wide variation and, to a faint -limit, no excess is visible.
4.2 A Dark Mass Concentration
Having discounted the possibility of a conventional background cluster of galaxies, we next attempt to place limits on the -band luminosity associated with the mass peak and hence the mass-to-light ratio of the structure which will depends on its (unknown) redshift.
We first consider the area around the X-ray source located at , . No obvious infrared source is found at this location. We sum the flux of all the non-stellar objects within a radius of 20 arcsec that are contained in the -band photometric catalogue described in Section 3 to . Comparing to the flux contained in 26 control apertures distributed on the three non-cluster chips we find the flux in the aperture containing the X-ray source is only 1.4 above the mean.
Similarly, we examine the -band flux of objects within 50 arcsec of the location of the mass concentration. Again, there is no significant excess of -band flux compared to that within control apertures.
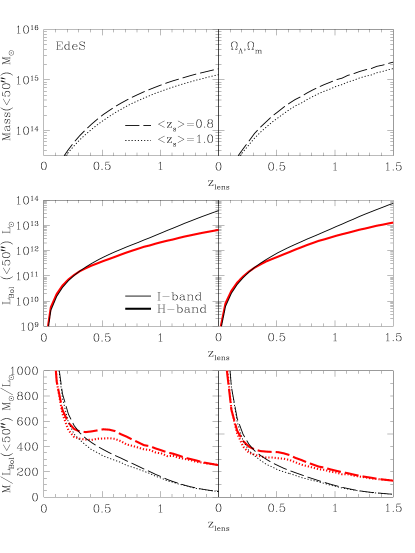
Finally, we consider the constraints placed on the mass-to-light ratio of the mass concentration. The measured -band flux within the 50″aperture is not significantly in excess of that found in a sample of control apertures placed randomly on chips 2,3, and 4 (avoiding Abell 1942 on chip 1). We use the fluctuations in the -band flux in the control apertures to place an upper limit on the excess luminosity, which will be dependent on the cosmology and the unknown redshift of the dark clump. The total apparent flux is transformed into a total -band luminosity, using the Menanteau et al. -corrections for early-type galaxies. This measurement of is then transformed into the bolometric luminosity using bolometric corrections for an old stellar population from the same models. This curve, which varies with the unknown redshift of the clump, is shown in Fig. 7 and allows comparison with the curves derived in a similar fashion from the -band data. As these are upper limits on the luminosity of the clump, the -band data provides tighter constraints on the luminosity at high redshift.
The weak lensing measurements of Erben et al. provide an estimate of the lensing mass within the aperture, assuming a redshift distribution for the source galaxies, with and (where ). Combining these lensing mass estimates with the upper limits on the bolometric luminosity due to the cluster galaxies, we obtain the lower limits on the shown in the bottom panel of Fig. 7.
5 Discussion
From our infrared study we have discounted the possibility that the mass concentration detected by Erben et al. is the result of a hitherto undetected massive high redshift cluster of galaxies. The resulting velocity dispersion, , implied by the measured tangential shear is in excess of 2000 km s-1 for a singular isothermal sphere model with . This is considerably higher than any currently measured rich cluster, and we have shown in Fig. 1 that we would expect to make a significant detection of such a cluster to the magnitude limit of our infrared study. Both searches for an excess in the colour-magnitude diagram and a spatial overdensity of sources in the deep infrared data reveal no such features. Furthermore, a massive cluster at higher redshift (beyond the magnitude limit of our study) is ruled out by the lensing constraint provided by the finite redshift of the background sources (for which a reasonable limit is ): the lensing object cannot be more distant than the sources being lensed.
The lower limits on the mass-to-light ratio inferred in 4.2 confirm the darkness of the mass concentration, and the infrared data are shown to provide stronger constraints on these limits at high redshift. Changing the redshift distribution of the sources used in the lensing reconstruction from to serves to lower the lensing mass and hence the resulting , but only slightly. Removing the discrepancy would require the sources used in the lensing mass reconstruction to be placed at significantly higher redshift. We find for derived from the -band measurements (slightly lower in a -cosmology).
Mass-to-light ratios for clusters presented in the literature tend to be calculated in blue or visible light, which makes direct comparisons difficult (although if bolometric corrections similar to those applied in the calculations above are followed, transforming to will lower the resulting ). Hradecky et al. (2000) present for a sample of eight low-redshift relaxed clusters with masses derived from the X-ray properties. They find a median in solar units. Other studies using weak lensing techniques have found moderately higher cluster mass-to-light ratios, e.g. for MS1137 () and for RXJ1716 () (Clowe et al. 1998), for Abell 2163 (Squires et al. 1997), ranging as high as for the exceptionally dark cluster MS 1224 at (Fischer et al. 1999, Fahlman et al. 1994). Clearly, the lower limits we find for the mass concentration place it firmly at the ‘dark’ end of the ratio scale for conventional clusters.
The reality of the lensing signal, which has been verified by Erben et al. in two separate datasets using two different cameras, is not in question. The absence of any overdensity of infrared sources or light makes the mass concentration increasingly enigmatic. Having ruled out a high-redshift cluster we are left to consider the possibility of a new type of object comprising a truly dark halo with an extremely high mass-to-light ratio.
Alternative explanations would involve chance alignments of the background galaxies at the location of the lensing signal (shown by Erben et al. to have a probability ) or would require placing the source galaxies at much higher redshift than previously expected. A more complex lens configuration involving projection effects along the line of sight (Metzler, White, & Loken 2000) could also be invoked. Finally, recent studies regarding the intrinsic correlations of galaxy shapes (e.g. Heavens, Refregier, & Heymans 2000) and the resulting implications for weak lensing studies must also be considered, as such intrinsic alignments could greatly increase the probability of uncovering a false mass peak.
Further studies to obtain photometric redshifts of the background sources, space-based high resolution data for improved lensing reconstructions, and deeper X-ray or SZ studies of the region are the next observational steps required to resolve the nature of this puzzling object.
Acknowledgments
We thank Thomas Erben and Yannick Mellier for providing the UH8K -band image of Abell 1942, and Alexandre Refregier for numerous helpful discussions. The Cambridge Infrared Survey Instrument is available thanks to the generous support of Raymond and Beverly Sackler. MEG acknowledges support from the Canadian Cambridge Trust and the Natural Sciences and Engineering Research Council of Canada.
References
- [1] Allen S.W., 1998, MNRAS 296, 392
- [2] Bacon D., Refregier A., Ellis R.S., 2000, MNRAS, 318, 625
- [3] Beckett M., Mackay C., McMahon R., Parry I., Ellis R.S., Chan S.J., Hoenig M., 1998, Proc. SPIE, 3354, 431
- [4] Bertin E., Arnouts S., 1996, A&AS, 117, 393
- [5] Bonnet H., Mellier Y., Fort B., 1994, ApJ, 427, 83
- [6] Bower R.G., Lucey J.R., Ellis R.S., 1992a, MNRAS, 254, 589
- [7] Bower R.G., Lucey J.R., Ellis R.S., 1992b, MNRAS 254, 601
- [8] Clowe D., Luppino G.A., Kaiser N., Henry J.P., Gioia I.M., 1998, ApJ, 497L
- [9] Couch W.J., Ellis R.S., Malin D.F., MacLaren I., 1991, MNRAS, 249, 606
- [10] da Costa L., et al. , 1999, A&A, 343, 29L
- [11] Erben T., van Waerbeke L., Mellier Y., Schneider P., Cuillandre J.-C., Castander F.J., Dantel-Fort M., 2000, A&A, 355, 23
- [12] Fahlman G., Kaiser N., Squires G., Woods D., 1994, ApJ, 437, 56
- [13] Firth, A., 2000, Clustering at High Redshift, ASP Conference Series, Vol. 200, p. 404
- [14] Fischer P., 1999, AJ, 117, 2024
- [15] Gladders M.D., Yee H.K.C., 2000, AJ, 120, 2148
- [16] Gray M.E., Ellis R.S., Refregier A., Bézecourt J., McMahon R.G., Hoenig M.D, 2000, 318, 573
- [17] Hradecky V., Jones C., Donnelly R.H., Djorgovski S.G., Gal R.R., Odeqahn S.C., 2000, ApJ, 543, 521
- [18] Kaiser N., Wilson G., Luppino G.A., 2000, astro-ph/0003338
- [19] Kaiser N., Squires G., 1993, ApJ, 404, 441
- [20] Kneib J.P., Ellis R.S., Smail I., Couch W.J., Sharples R.M., 1996, ApJ 471, 643
- [21] Marzke R., McCarthy P.J., Persson E., et al., 1999, Photometric Redshifts and the Detection of High Redshift Galaxies, ASP Conference Series, Vol. 191, p. 148
- [22] Menanteau F., Ellis R.S., Abraham R.G., Barger A.J., Cowie L.L., 1999, MNRAS 309, 208
- [23] Metzler C.A., White M., Loken C., 2000, ApJ, submitted (astro-ph/0005442)
- [24] Miralda-Escude J., Babul A., 1995, ApJ, 449, 18
- [25] Persson S.E., Murphy D.C., Krzeminsky W., Rother M., Rieke M.J., 1998, AJ, 116
- [26] Refregier A., Heavens A., Heymans C., 2000, MNRAS, 319, 649
- [27] Schneider P., 1996, MNRAS, 283, 837
- [28] Smail I., Ellis R.S., Fitchett M.J., Edge A.C., 1995, MNRAS, 273, 277
- [29] Smail I., Dressler A., Kneib J.-P., Ellis R.S., Couch W.J., Sharples R.M., Oemler A.J., 1996, ApJ, 469, 508
- [30] Squires G., Neumann D.M., Kaiser N., Arnaud M., Babul A., Boehringer H., Fahlman G., Woods D., 1997, ApJ, 482, 648
- [31] van Kampen E., Katgert P., 1997, MNRAS, 289, 327
- [32] van Waerbeke L, et al., 2000, A&A, 538, 30
- [33] Whittman D.M., Tyson J.A., Kirkman D., Dell’Antonio, I., Bertstein G., 2000, Nature, 405, 143