A Comparison of Radio and X-Ray Morphologies of Four Clusters of Galaxies Containing Radio Halos
Abstract
Clusters of galaxies may contain cluster-wide, centrally located, diffuse radio sources, called halos. They have been found to show morphologies similar to those of the X-ray emission. To quantify this qualitative statement we performed a point-to-point comparison of the radio and the X-ray emission for four clusters of galaxies containing radio halos: Coma, Abell 2255, Abell 2319, Abell 2744. Our study leads to a linear relation between the radio and the X-ray surface brightness in two clusters, namely Abell 2255 and Abell 2744. In Coma and A2319 the radio and the X-ray brightnesses seem to be related with a sub-linear power law. Implications of these findings within simple radio halo formation models are briefly discussed.
Key Words.:
Radiation mechanism: non-thermal – Radio continuum: general – Galaxies: clusters : general – Galaxies: intergalactic medium – Magnetic Fields1 Introduction
The presence of cluster-wide magnetic fields and relativistic electrons in cluster of galaxies is revealed by the detection of radio halos in the center of some clusters of galaxies. Radio halos are diffuse, extended radio sources associated with the intra-cluster medium (ICM) rather than with a particular galaxy.
The physical mechanism producing the population of radio-synchrotron emitting relativistic electrons is not yet determined. However, it is clear from cooling time arguments that such mechanism has to operate in the ICM, in order to explain the large extensions ( 1Mpc) of radio halos.
In general, clusters containing radio halos are characterized by the presence of a recent merger event, that probably provides the energy source for the relativistic electrons, by the absence of strong cooling flows and by high X-ray luminosity (Feretti 2000).
Several suggestions for the mechanism transferring energy to the relativistic electrons have been made (see Enßlin (2000) for a recent review). These include in-situ acceleration by plasma and by shock waves, particle injection from radio galaxies, acceleration out of the thermal pool, secondary electrons resulting from hadronic collisions of relativistic protons with the ICM gas protons, and combinations of these processes.
It is, therefore, important to establish observable quantities which allow a discrimination between these models. Important observable quantities used so far in the literature are: the global radio spectral index, the emission and spectral index profile, the total radio power and its correlation to cluster parameters such as temperature or X-ray luminosity.
It is the purpose of this paper to present a new observable quantity: the point-to-point correlation of the radio and the X-ray surface brightness in clusters containing radio halos. Its suitability is demonstrated by the striking similarities of the radio halo morphology and the thermal X-ray emission of halo clusters. These morphological similarities indicate an energetical relation between the thermal gas and the relativistic plasma. This observable is straightforward to determine from observational data, can be constrained by theoretical models and does not depend on any assumption.
We present in Sect. 2 the methodological approach of the radio - X-ray comparison. The results are given in Sect. 3 and discussed in Sect. 4.
Intrinsic parameters are computed with H0 = 50 km s-1Mpc-1 and q0 = 0.5.
2 Data Analysis
So far, the similarity of the radio halo and the X-ray morphology of the clusters has been pointed out in the literature (Deiss et al. 1997, Feretti 1999, Liang et al. 2000) but it has never been used to constrain theoretical models.
Here we present the first quantitative analysis of the relation between the radio and the X-ray brightness distribution. We carried out such analysis for the following four clusters: Coma (Abell 1656), Abell 2255, Abell 2319, and Abell 2744, whose properties are summarized in Table 1.
Except for A2744, we analyzed already published radio and X-ray images. Therefore, we refer to the previous works for the details of the radio and X-ray data.
The analyzed X-ray surface brightness images were obtained in the 0.5-2.0 keV energy band (only the Coma surface brightness image was obtained in the 0.5-2.4 keV energy band). The X-ray background was taken into account in the analysis of the X-ray images.
The presence of a visible Sunyaev-Zel’dovich (SZ) effect was established in three of our four clusters (see Table 1). However, the radio halo surface brightness is not corrected for a SZ effect contamination since this is significant only for frequencies higher than 5 GHz. The images discussed here have been obtained at much lower frequencies (0.3 or 1.4 GHz).
| Name | aredshift | bLX (0.1-2.4 keV) | cT | dSunyaev-Zel’dovich |
| 1044erg/s | (keV) | effect | ||
| A2255 | 0.0806 | 4.79 | 7.3 | no |
| Coma | 0.0231 | 7.21 | 8.4 | yes |
| A2744 | 0.3080 | 22.05 | 11.0 | marginal detection |
| A2319 | 0.0557 | 13.71 | 9.1 | yes |
| a Redshift reference : Struble & Rood (1999) | ||||
| b X-ray Luminosities reference : Ebeling et al. (1996) | ||||
| c Temperatures reference : Wu et al. (1999) | ||||
| d SZ effect references : Herbig et al. (1995), Coma; Andreani et al. (1996), A2744; | ||||
| White & Silk (1980), A2319. | ||||
We performed a comparison of the radio and X-ray surface brightness both using ‘point’ values and annuli-averaged values. From the first we derive the - correlation. The image processing was done using the Synage++ program (Murgia 2000, in preparation and PhD thesis), which allows to create grids and concentric rings with the possibility of excluding areas containing contaminating emission (i.e. from radio galaxies). For Coma and A2255 we used radio images where discrete sources were subtracted using the AIPS package, while in the other two clusters discrete radio sources were excluded from the analysis with the help of the Synage++ program.
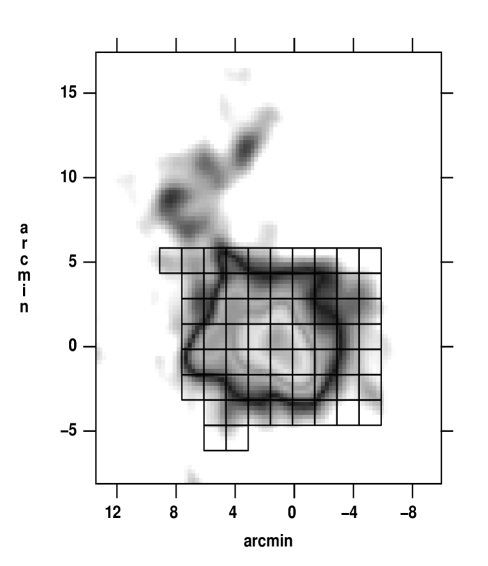
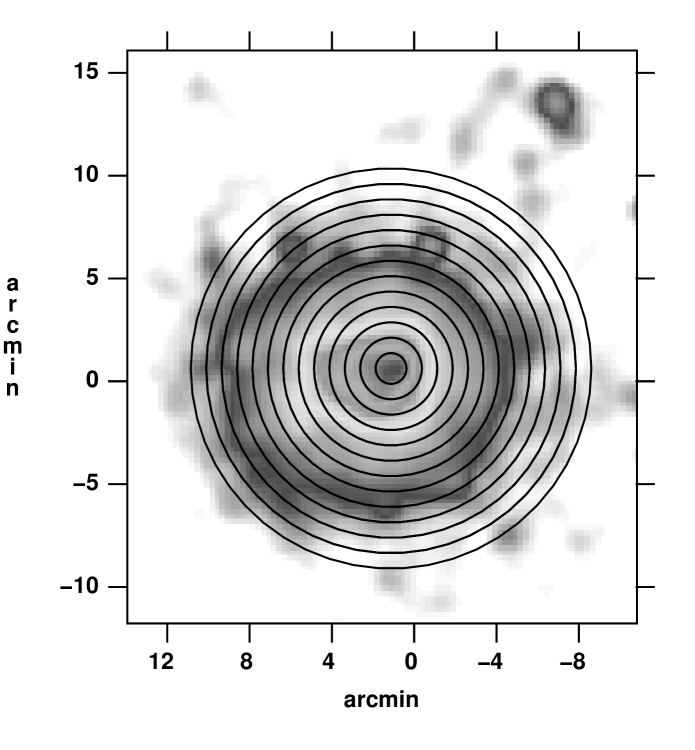
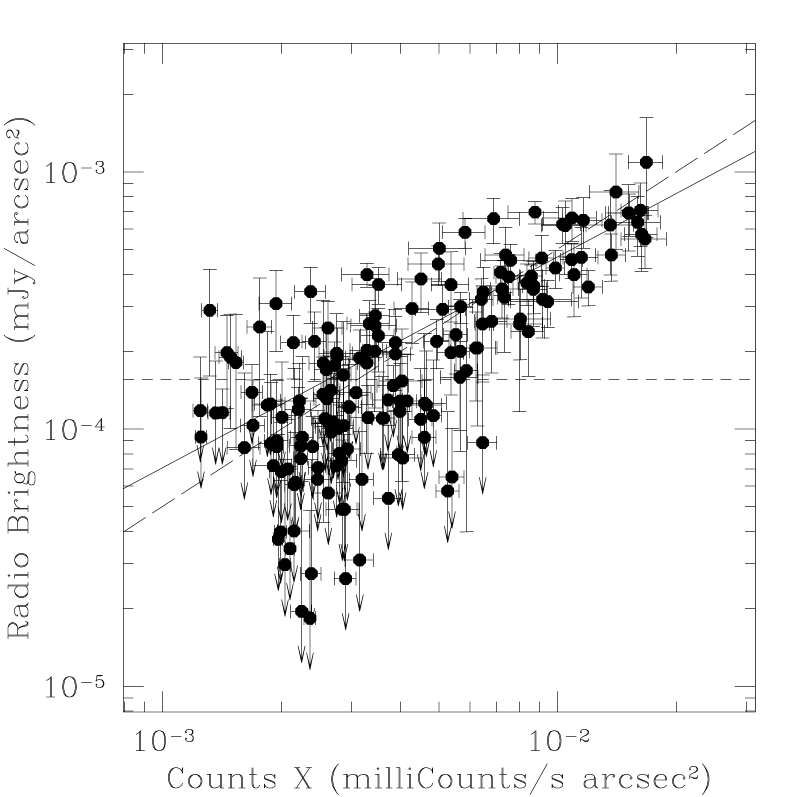
For each cluster, we constructed a square grid covering the region containing the radio halo (see Fig. 1 upper panel). We derived the mean and the root-mean-square (RMS) of the radio and X-ray surface brightness for every grid cell. The grid cell sizes were chosen to obtain a good compromise between high signal to noise ratio and good resolution. The RMS is assumed to be an estimate of the error, and it is used as a weighting factor in the following fitting procedure. The resulting point-to-point radio versus X-ray brightness comparisons of the four clusters are presented in Figs. 3, 6, 9, and 12. There, each point represents the mean brightness obtained of each cell of the grid while the error-bars indicate the RMS of the brightness distribution. Furthermore, the horizontal dashed lines indicate the 3 sigma noise level of the radio maps. For graphical reasons the lower error-bars of radio fluxes below the 3 sigma radio noise levels are not displayed. We fit the data for a power-law relation
| (1) |
using logarithmic units and using error-bars for both and . The best fit parameters for each cluster were estimated by a least square method and the corresponding fitting line is indicated by a solid line in each figure. A larger grid cell does not change the fitting results. However, since this approach of counts in cells involves spatial averaging, this kind of analysis is insensitive to scale features smaller than the cell size.
Due to some degree of morphological difference between the radio and X-ray images deviations from a tight correlation exist, which appear as scatter in the - plots. However, most of the outlayers have radio fluxes below the 3 sigma noise level.
We also compared the shape of the normalized radio and X-ray brightness profiles of the clusters in Fig. 4, 7, 10, and 13. To obtain these profiles, the mean and RMS brightnesses were estimated within concentric rings centered on the X-ray brightness peaks (see Fig. 1 lower panel). The RMS within the rings was used as an estimate of the errors.
As can be seen from the large error-bars in the profile, but also from the brightness variation within the concentric rings (see lower panel of Fig. 1), morphological distortions of the clusters do affect the profiles. Moreover, since the X-ray and the radio peaks are not always perfectly coincident, also the choice of the center of the concentric rings could introduce some arbitrariness into the analysis. For these reasons, the local point-to-point comparison is more reliable in the analysis of radio halos.
3 Results
3.1 A2255
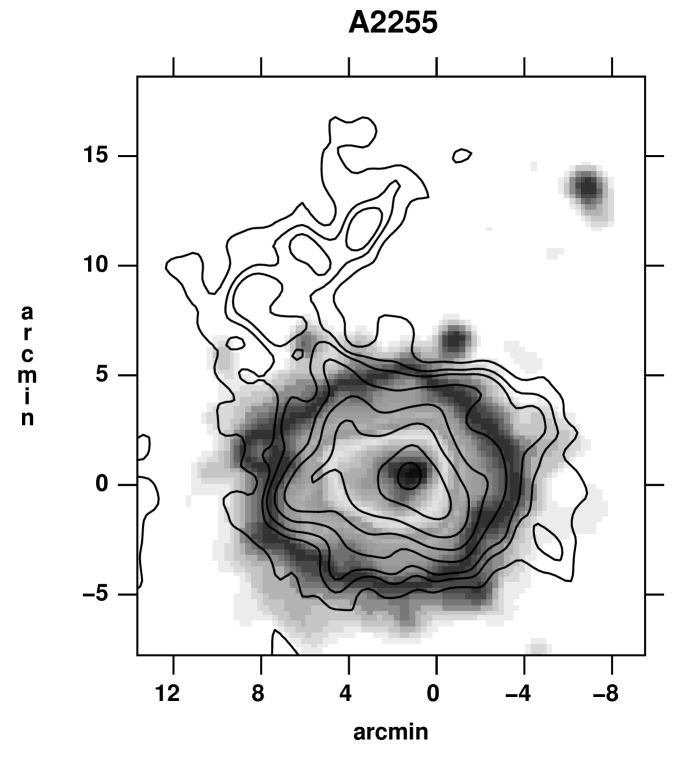
An X-Ray study of the cluster A2255, located at redshift 0.0806 (Struble & Rood 1999), has been presented by Burns et al. (1995) and Feretti et al. (1997a). The cluster shows an asymmetric X-ray structure suggesting an ongoing cluster merger event.
In Fig. 2 we show the overlay between the radio (contours) and the X-ray surface brightness image (grey scale). The X-ray image results from 14500 seconds exposure time of the Rosat PSPC detector. It was obtained by binning the photon events in a two dimensional grid and then smoothing with a Gaussian of =30′′.
A high sensitivity radio map was presented by Feretti et al. (1997a). The image was obtained with the Westerbork Synthesis Radio Telescope (WSRT) at 90 cm and with a resolution of 88′′ 82′′. The cluster radio emission is characterized by a diffuse halo source located at the cluster center, by a peripheral relic in the North-East, and by the presence of several tailed radio galaxies. The radio galaxies have been subtracted from the image used here (Feretti et al. 1997a, Fig. 1 upper panel and Fig. 2). The angular size of the halo is about 10′.
In Fig. 1 we show the grid and rings for the analysis of this cluster: the grid cells have a size of 90′′ (184 kpc), the width of the concentric rings is 45′′. Fig. 3 and Fig. 4 show the two comparisons of the radio and X-ray emissions.


Fig. 3 indicates that the radio brightness correlates well with the X-ray brightness. The normalization and slope of the fitted power-law (Eq. 1) are , and . The formal errors result from the RMS of the grid data-points. The derived correlation is consistent with a linear relation between the radio and X-ray emissivity.
Fig. 4 shows that the two brightness profiles are very similar.
3.2 Coma (Abell 1656)
The radio halo in Coma (Coma C) is the prototype and the best studied example of cluster radio halos. It is located at the cluster center, shows a rather regular shape and a large size.
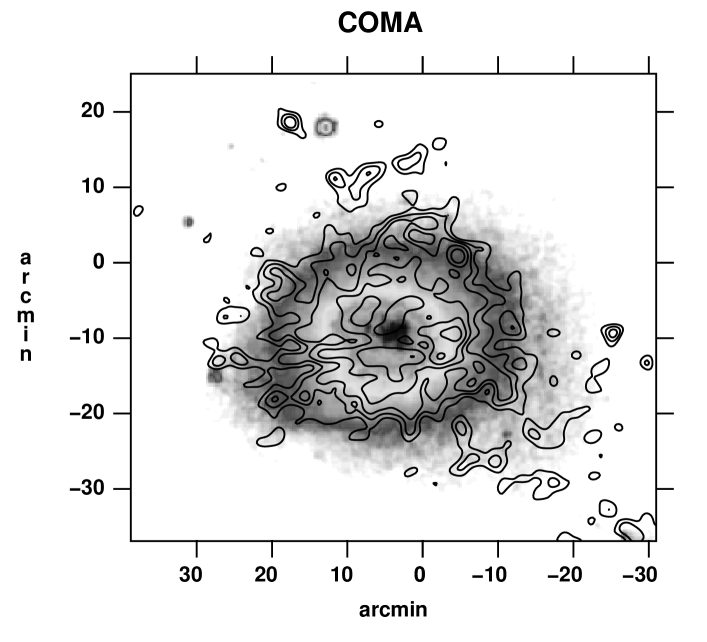
Deiss et al. (1997) obtained a map at 1.4 GHz of the halo, after subtraction of all discrete sources. They pointed out the similar extension of the X-ray and the radio emission in E-W direction towards the NGC 4839 group. According to Burns et al. (1994) the X-ray morphology indicates that the Coma cluster has undergone a collision with the NGC 4839 group about 2 Gyr ago. Moreover, recent works provide evidence for ongoing merging of groups in the center of Coma (Colless & Dunn 1996, Vikhlinin et al. 1997, Donnelly et al. 1999, Bravo-Alfaro et al. 2000).
We use here the radio map of Coma obtained with the Westerbork Synthesis Radio Telescope at 90 cm at an angular resolution of 125′′55′′ (Feretti & Giovannini 1998) after subtraction of the discrete sources. In this radio image the projected size of the halo is about 30′. The X-ray image was obtained from Rosat PSPC observations (White et al. 1993) and was kindly supplied by Dr. Briel.
In Fig. 5 we show the overlay between the radio (contours) and the X-ray surface brightness (grey scale) images. For a better display (but not for the data analysis) the radio map was smoothed, whith a Gaussian of 125′′125′′ (FWHM).


The grid cells have a size of 256′′ (166 kpc), while the concentric rings have a thickness of 128′′. The shape of the two radial profiles are slightly different and the point-to-point comparison of radio and X-ray brightness shows a large scatter, which can also be seen in the radial profiles. It might be worth to emphasize that the radio brightness emission in Coma is lower than in the case of the other analyzed clusters: only a minority of the data points are above the 3 sigma noise level (Fig. 6). This possibly allows background noise to introduce additional scatter. However, the error-weighting of the data should reduce the noise influence, although it could introduce a bias towards flatter relations (i.e. smaller values of ). The fitted power-law relation (Eq. 1) has the normalization and slope . We emphasize that this sub-linear power law relation should be verified through a radio map of higher sensitivity.
Fig. 6 shows that a linear relation () between grid values of the radio and X-Ray brightness may also be consistent with the data.
3.3 A2744
The radio halo in A2744 was found by Giovannini et al. (1999) during a search for new radio halos and cluster relics among the candidates extracted from the NRAO VLA Sky Survey (NVSS, Condon et al. 1998). The cluster A2744, located at a redshift of 0.308 (Struble & Rood 1999), was re-observed with the VLA at 1.4 GHz in C and D configuration (Govoni et al. 2000, in preparation). We analyzed the resulting map, which has an angular resolution of 50′′ 50′′.
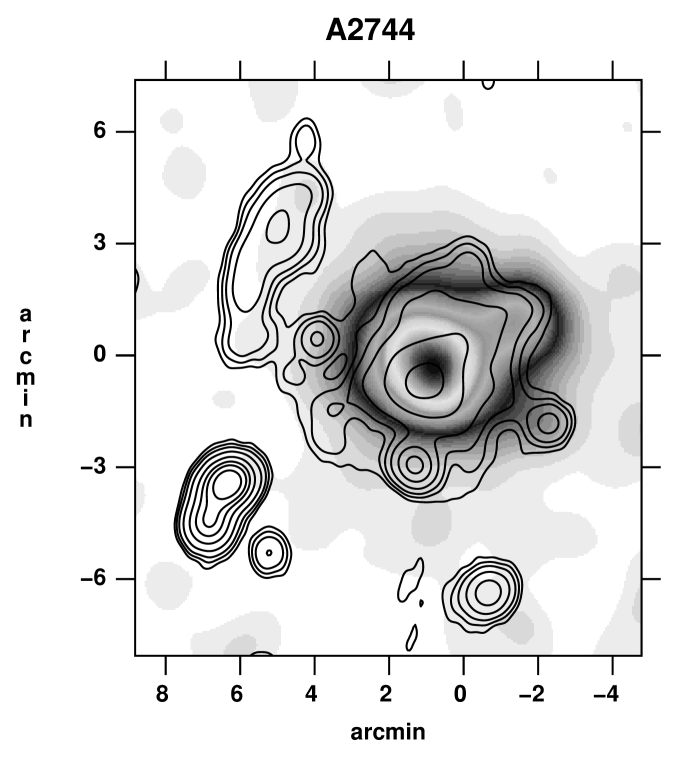
The X-ray image results from 13600 seconds exposure time and was obtained from Rosat PSPC archive data, by binning the photon events in a two dimensional grid and then smoothing with a Gaussian function with =30′′. The X-ray background, of about cts sec-1 arcsec-2, was determined by fitting the X-ray surface brightness profile with a hydrostatic isothermal model (Cavaliere & Fusco-Femiano, 1981).
The X-ray image shows morphological substructures, which are possible indication of a recent merger.
In Fig. 8 we present the overlay between the radio (contours) and the X-ray image (grey-scale) of A2744. The elongated diffuse radio emission in the peripheral North-East region of the cluster is classified as a cluster relic, and, therefore, excluded from the analysis.
We performed the analysis of the radio and the X-ray morphology using a grid with a cell size of 51′′ (285 kpc), and concentric rings with a thickness of 30′′. Since this cluster is at a large distance, the gridding corresponds to cells of large linear size. However, both the X-ray emission and the radio halo are well resolved (FWHM of X-ray and radio profiles 170′′ from Fig. 10). Therefore, although the number of statistically independent cells and rings in the cluster is lower than in other clusters, it allows us to perform a quantitative analysis.
The absence of X-ray point sources with an optical or radio counterpart doesn’t allow us to check if the offset between the X-ray and the radio peaks is real or not. We note that the offset ( 30′′) is within the cell size (51′′).
Results are presented in Fig. 9 and 10. The shape of the two brightness profiles is perfectly coincident and in this case we get a linear relation (, ).


3.4 A2319
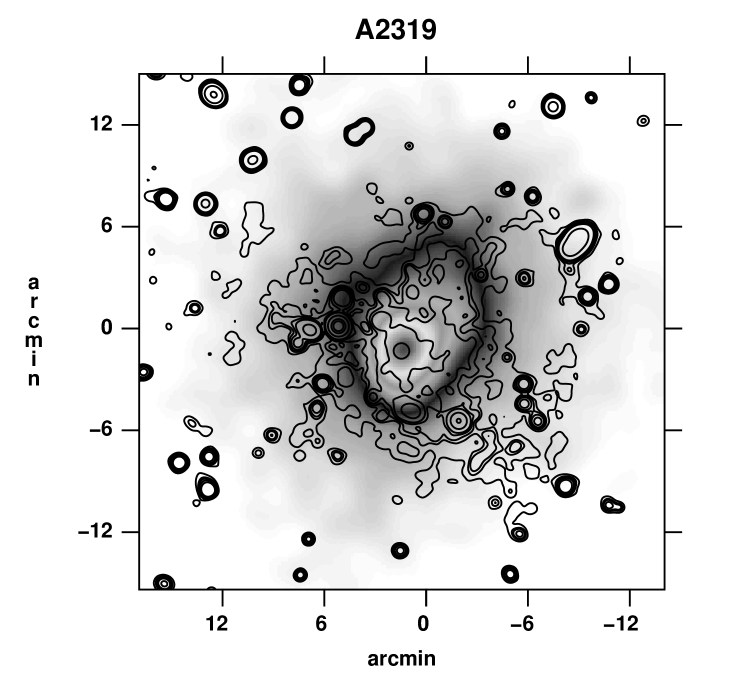
A radio and X-ray study of the cluster A2319 has been presented by Feretti et al. (1997b). We refer to this paper for the details of the images. This cluster is located at a redshift of 0.0557 (Struble & Rood 1999). It has an irregular radio halo, with a size of about 16′, at its center.
The radio image was obtained with the Westerbork Synthesis Radio Telescope (WSRT) at 20 cm with a resolution of 29.0′′ 20.4′′. The X-ray image results from the Rosat PSPC archive data and was obtained by binning the photon events in a two dimensional grid and then smoothing with a Gaussian function with =50′′.
In Fig. 11 we show the overlay between the radio (contours) and the X-ray surface brightness (grey scale) image. For a better display (but not for the data analysis) the radio map was smoothed, with a Gaussian of 30′′30′′ (FWHM).
The grid has a cell size of 56′′ (82 kpc), and the concentric rings have a thickness of 20′′. Results are given in Fig. 12 and 13. We get a sub-linear power law - relation with and (see Fig. 12). As in the case of the Coma cluster, the low radio signal to noise ratio might affect our estimate. The radial brightness profiles have slightly different shapes. As for Coma, this could result from a non-linear relation.

for clarity.
4 Discussion
The point to point comparison studied in this work gives important insight on the spatial distribution of magnetic fields and relativistic particles with respect to the X-ray emitting gas in clusters of galaxies.
We have found a strong positive correlation between the radio halo and the X-ray brightness in all the analyzed clusters of galaxies (see Fig. 3, 6, 9 and 12). Moreover, we found a linear relation between the radio and the X-ray brightness in two clusters of galaxies (A2255, A2744).
The appearance of radio halos seems to be correlated to the occurrence of cluster mergers (Feretti et al. 1997b), which suggests that cluster mergers could be the key of the connection between the thermal and the relativistic components in the clusters.
In the following we demonstrate how some simple assumptions can lead to a linear relation between the radio and the X-ray brightness. Most of the thermal energy content of a galaxy cluster results from the dissipation of the kinetic energy of gas falling into the cluster potential. The dissipation occurs in shock waves and turbulent cascades, which are strongest in the case of major cluster merger events. Some small fraction of the dissipated energy might go into the amplification of magnetic fields due to field line stretching in shear flows (Roettiger et al. 1999, Dolag et at. 1999). Another fraction might go into relativistic particle populations via Fermi I or II acceleration. The rest of the dissipated energy is thermalized in the hot ICM. Let us assume for simplicity, that the energy fraction which goes into the non-thermal components (fields and relativistic particles) compared to the thermal component is independent of the position in a cluster. This assumption needs not to hold in reality, but it allows us to construct simple test models, for comparison with observations.
The X-ray emissivity in a cluster is given by:
| (2) |
where and are the electron density and temperature. For an isothermal cluster the X-ray emissivity at a given position is proportional to the thermal energy density () squared:
| (3) |
If the number density of relativistic electrons with energy between and can be assumed to be the radio emissivity at a given position in a cluster is given by:
| (4) |
where is the frequency and is the magnetic field strength.
In general, for each value of , the observationally obtained linear relation implies that the relativistic particles and the magnetic field are connected to the thermal plasma through the relation:
| (5) |
Such a relation must be approximately fulfilled in A2255 and A2744. In the other two clusters, the relations obtained between and seem to imply that the radial decline of the magnetic field strength and relativistic particle density is slower than the decline of thermal gas density.
In the following we assume for simplicity a single radio spectral index () which is typical for cluster radio halos. Therefore the radio emissivity at frequency is
| (6) |
where is the relativistic electron energy density, and is the local magnetic field () energy density.
If we assume – as suggested above – that magnetic fields and radio emitting electrons have energy densities proportional to the thermal energy content ( and ) we find that the ratio is independent of the position within an isothermal cluster. The same is true for the ratio of the surface brightnesses and , which are the line-of-sight projected emissivities. Thus as observed at least in two of our cases. Such a linear relation might be obtained by some of the primary electron models where the energy density in relativistic electrons is proportional to the thermal energy density.
In hadronic secondary electron models the radio emitting electrons are secondary particles produced in hadronic cosmic ray proton-gas interactions (see review Enßlin 2000). In these models the radio emissivity is given by (Dolag & Enßlin 2000):
| (7) |
assuming . This more complicated dependence results from the fact that the spectrum of the radio emitting electrons is shaped by the parent cosmic ray proton spectrum, here assumed to be a power-law, and by the electron cooling processes. These are mainly due to synchrotron losses () and to inverse Compton scattering with the CMB photon field (). We assume further that the cosmic ray proton population has an energy density proportional to that of the thermal component (). The resulting ratio of the radio and X-ray emissivities
| (8) |
is independent of the magnetic energy density for strong fields (), and proportional to it for weak fields (). Thus, for a radial decreasing magnetic field strength we expect a linear relation between the radio and the X-ray brightness in the case of strong magnetic fields, while we expect a super-linear power law in the case of weak magnetic fields. For instance, for a magneto-hydrodynamically simulated Coma-like cluster of galaxies with intermediate field strength (), which is consistent with published Faraday rotation measurements, Dolag & Enßlin (2000) get a radio to X-ray surface brightness relation of . The prediction of this specific version of hadronic secondary electron models is in contradiction with the data analysis presented here.
5 Conclusions
We analyzed radio and X-ray images of four clusters of galaxies on a point-to-point and also on a circular averaged (radial profile) basis. We argue that the point-to-point comparison is less affected by morphological distortions, and that it allows to introduce a radio vs X-ray surface brightness relation (- relation). This was found to be consistent with a linear relation in two clusters (Abell 2555: ; Abell 2744: ) and to be a sub-linear power law in the other two analyzed clusters (Coma: ; Abell 2319: ). We note that in the case of Coma the relation could be affected by the low signal to noise ratio of the used radio map.
We presented two simplified cluster radio halo models: a primary electron and a hadronic secondary electron model. In both models we assumed that the magnetic fields and the primary particle population (electrons in the primary model, the parent protons in the hadronic secondary model) have energy densities proportional to the thermal energy density. The predicted - relations of these models are linear for the primary model and for the hadronic secondary model in the regime of strong magnetic fields (). The hadronic secondary model with weak or moderate field strength () and with an assumed linear scalings of the thermal and non-thermal (relativistic electrons and magnetic fields) energy densities produces a super-linear power law - relation, and it is therefore disfavored by the data analysis presented here.
We hope that the point-to-point radio vs X-ray surface brightness
relation will prove a useful observational and theoretical tool for
future studies of the mysterious nature of cluster radio halos and of
the non-thermal energy content of clusters of galaxies.
Acknowledgments
We are indebted to Matteo Murgia for the use of the Synage++ program and for helpful comments on the paper. We thank Ulrich G. Briel who kindly supplied the X-Ray map of Coma. We further thank Gianfranco Brunetti for helpful discussions and Francesco Miniati for comments on the manuscript.
References
- (1) Andreani P., Pizzo L., Dall’Oglio G., et al., 1996, ApJ 459, L49
- (2) Bravo-Alfaro H., Cayatte V., van Gorkom J.H., Balkowski C., 2000, AJ 119, 580
- (3) Burns J.O., Roettiger K., Ledlow M., Klypin A., 1994, ApJ 427, L87
- (4) Burns J.O., Roettiger K., Pinkney J., et al., 1995, ApJ 446, 583
- (5) Cavaliere A., Fusco-Femiano R., 1981, A&A 100, 194
- (6) Colless M., Dunn A.M., 1996, ApJ 458, 435
- (7) Condon J.J., Cotton W.D., Greisen E.W. et al., 1998, AJ 115, 1693
- (8) Deiss B.M., Reich W., Lesch H., Wielebinski R., 1997, A&A 321, 55
- (9) Dolag K., Bartelmann M., Lesch H., 1999, A&A 348, 351
- (10) Dolag K., Enßlin T.A., 2000, A&A 362, 151
- (11) Donnelly R.H., Markevitch M., Forman W. et al., 1999, ApJ 513, 690
- (12) Ebeling H., Voges W., Böhringer H., Edge A.C., Huchra J.P., U.G. Briel, 1996, MNRAS 281, 799
- (13) Enßlin T.A., 2000, in The Universe at low radio frequencies, Symposium IAU 199, Pune (India), in press, (astro-ph/0001433)
- (14) Feretti L., Böhringer H., Giovannini G., Neumann D., 1997a, A&A 317, 432
- (15) Feretti L., Giovannini G., Böhringer H., 1997b, New Ast. 2, 501
- (16) Feretti L., Giovannini G., 1998, in A new view of an old Cluster: untangling Coma Berenices, Eds. A. Mazure, F. Casoli, F. Durret, D. Gerbal, Word Scientific Publishing Co Pte Ltd, p 123
- (17) Feretti L., 1999, in Proceeding of the Ringberg workshop on Diffuse Thermal and Relativistic Plasma in Galaxy Clusters, ed. H. Böhringer, L. Feretti, & P. Schuecker (MPE report)
- (18) Feretti L., 2000, in The Universe at low radio frequencies, Symposium IAU 199, Pune (India), in press, (astro-ph/0006379)
- (19) Giovannini G., Tordi M., Feretti L., 1999, New Ast. 4, 141
- (20) Govoni F. et al., 2000, in preparation
- (21) Herbig T., Lawrence C.R., Readhead A.C.S., Gulkis S., 1995, ApJ 449, L5
- (22) Liang H., Hunstead R.W., Birkinshaw M., Andreani P., 2000, ApJ 544, 686
- (23) Murgia M., 2000, in preparation
- (24) Roettiger K., Burns J.O., Stone J.M., 1999, ApJ 518, 603
- (25) Strubel M.F., Rood H.J., 1999, ApJS 125, 35
- (26) Vikhlinin A., Forman W., Jones C., 1997, ApJ 474, L7
- (27) White S.D.M., Briel U.G., Henry J.P., 1993, MNRAS 261, L8
- (28) White S.D.M., Silk J., 1980, ApJ 241, 864
- (29) Wu X.P., Xue Y.J., Fang L.Z., 1999, ApJ 524, 22