Australia Telescope Compact Array Observations of the OH Star Roberts 22: Resolved Images of OH Emission
Abstract
We have imaged the unusual OH/IR object G 284-0.8 (Roberts 22) in the OH transitions at 1612, 1665 and 1667 MHz using the Australia Telescope Compact Array in Narrabri, NSW, Australia. The angular resolution of the OH images we present here is 6″ (12000 AU at a distance of 2 kpc). We find OH emission, of extent 15 (2800 AU), located inside the optical bipolar flow region (size 8″) discovered by Allen et al. (1980) and imaged recently by Sahai et al. (1999) with the Hubble Space Telescope. We present astrometry of Roberts 22, providing registration of the OH and Hubble Space Telescope images to within 035. We describe the OH velocity field in Roberts 22 and discuss the kinematic properties of the source and its evolutionary status.
1 Introduction
The OH maser source G 284.2-0.8 was discovered in the course of a southern galactic plane survey at 1612 MHz near the H II region RCW 48 (Manchester, Goss and Robinson 1969; Manchester, Robinson and Goss 1970). The discovery pre-dated the detection of OH emission from IR stars, and the nature of the source was not appreciated at the time. Subsequently it became clear that G 284.2-0.8 could be classified as a Type II OH/IR star, as defined by Wilson et al. (1970). The source acquired its most common name, Roberts 22 (hereafter R22), by its inclusion in a catalog of Wolf-Rayet stars by Roberts (1962). Additional designations include Hen 404, Wray 549 and IRAS 10197-5750.
Subsequent single-dish observations using the Parkes radio telescope from 1968 to 1978 were reported by Allen et al. (1980). These observations found strong OH emission at 1612 MHz and 1665 MHz in a double-peaked spectrum, with fainter emission at 1667 MHz, and no detected emission in the 1720 MHz satellite line. The source was found to have low levels of circular polarization. Allen et al. (1980) reported no time variations exceeding a factor of two over this interval, and concluded that the maser is pump-limited. An OH light curve has also been measured by Silva et al. (1993), who derived a periodicity of 7.2 years. These data are poorly sampled, however, and evidence for this period is not compelling.
Ground based optical observations of R22 reveal that the source is associated with a bipolar reflection nebula (Allen et al., 1980). The irregular lobes of the nebula, each of size 25 are separated by 35 at position angle 30 Nearly identical spectra identify them as reflection nebula. Analysis of the reflection spectra in H by Allen et al. (1980) shows that R22 is unusual among OH/IR stars: the nebula is illuminated by a hidden A2 Ie star, not a more typical late M-type star. The spectral type is based on the presence of Fe II absorption, the absence of He I and the weakness of the Balmer absorption lines.
The optical morphology is strikingly confirmed in wideband continuum Hubble Space Telescope (HST) observations centered at 606 nm, and in associated imaging in H, and [SII] (Sahai et al., 1999). These high resolution optical images show that Roberts 22 consists of two bright “butterfly wing” lobes of size 25 with intersecting loops of 25, separated by a dark equatorial band hiding the central star. The nebular morphology is characterized by a high degree of point symmetry, with the exception of a “northern spur” – a region of decreased emission extending from the waist into the northern lobe. Sahai et al. (1999) propose that the symmetry may result from the interaction of collimated bipolar flows with an asymptotic giant branch envelope. The authors find that the radial emission profile is not consistent with a r-3 profile expected for time-invariant mass loss.
R22 was initially detected in the near-infrared by Frogel & Persson (1975). Allen et al. (1980) confirmed the near-IR properties, and explain the infrared observations by a hot stellar continuum, reddened by 8–10m. By applying this reddening to star of spectral type A2 Ib, they obtained a distance of 1.8 kpc (although they adopted 2 kpc for calculations) and a luminosity of L☉. We adopt the distance of 2 kpc in this paper, thus establishing an angular scale of 0.01 pc (2000 AU) per arc second.
Allen et al. (1980) calculated a mass loss velocity of 80 km s-1, from the P Cygni H profile, and suggest that the line of sight to R22 is 20-30° below the equatorial plane. 12CO (J=2-1) was detected by Bujarrabal & Bachiller (1991) with a central velocity of -0.1 km s-1 and a velocity of expansion of km s-1. This CO emission is clearly associated with R22, rather than background emission along the galactic plane.
Initial interferometric observations of the 1612 MHz line at the Australia Telescope Compact Array (ATCA) indicated an unresolved source (2-3″ diameter) with a clear velocity gradient suggesting rotation (Goss, 1995, unpublished observations). Subsequent ATCA observations at 1665 MHz and 1667 MHz are reported by Sahai et al. (1999) and by Caswell (1998) in a survey of 200 OH masers. The overall kinematic model proposed by Sahai et al. (1999) is that of radially expanding gas at low latitudes with Vexp 30 km s-1 for OH and a systemic velocity of 0 to -6 km s-1. They inferred a mass loss rate of 7 10-5 M☉ year-1 (from CO observations) to 10-4 M☉ year-1 (from dust observations), and estimate the mass of dust in cavity walls to be 0.3 M☉. They find a timescale for expansion 500 years. The authors also proposed that the southern lobe is closer to the observer, as the northern lobe is 0.5m fainter.
The exact kinematics of the circumstellar material of R22 and the evolutionary status of the central star remain important subjects of interest. In this paper, we report on high-resolution imaging observations of the OH maser emission towards R22 using data taken with the ATCA at 1612 MHz, 1665 MHz and 1667 MHz. These observations reveal the morphology of the OH emission at high resolution and allow an investigation of the maser kinematics. The kinematic properties of the source support its classification as a proto-planetary nebula (PPN) (Sahai et al., 1999). An astrometric solution for R22 has been obtained, which registers the OH maser emission with respect to the high-resolution HST images published by Sahai et al. (1999).
2 Observations
Observations of R22 were made using the ATCA, located at Narrabri, NSW, Australia on February 1 and 4, 1997, as summarized in Table 1. Two 4 MHz bands were observed, centered at 1612.00 MHz (containing the OH line at rest frequency 1612.231 MHz) and 1666.00 MHz (containing the OH main lines at rest frequencies 1665.402 MHz and 1667.359 MHz). The effective velocity resolution of the observations was 0.44 km s-1. The total observing time was 28 hours, with the major portion of the time (15 hours) allocated to observations at 1612 MHz. The ATCA was in configuration 6A, with a maximum antenna spacing of approximately 6 km. For unit robust weighting (Briggs, 1995), full tracks at 1612 MHz provided a resolution of (PA = ) while the shorter 1666 observation resulted in a resolution of (PA = ).
The data were edited, calibrated and imaged using the Astronomical Image Processing System (AIPS) maintained by the National Radio Astronomy Observatory (NRAO). The observations at 1612 MHz were subject to severe interference from a Glonas satellite broadcasting at 1608 MHz. Careful editing of the data was required to eliminate these effects. The 1612 MHz and 1666 MHz data sets were self-calibrated in phase on the channels with strong maser emission. These solutions were applied to all remaining channels. Self-calibration changed the positions of our sources by 01. The images were deconvolved using the Clark CLEAN algorithm down to a threshold level of five times the rms noise. The AIPS task JMFIT was used to fit the centroid of emission in each velocity channel in the image plane. For typical line features with a peak flux density of 10 Jy beam-1, the relative error in the determination of positions is 20 mas, assuming the error model of Kogan (1997). The position error contributed by the phase calibrator J0823-500 is limited by an uncertainty in its VLBI position of 2-3 milliarcseconds (mas) (J. Reynolds, private communication).
In the strongest channels, the images are dynamic-range limited at the level of approximately 1000:1 at 1612 MHz and 1665 MHz, and 100:1 at 1667 MHz. The observational parameters are summarized in Table 2; the quoted rms noise values (20 mJy beam-1 at 1612 MHz and 28 mJy beam-1 at 1665 MHz) were measured in channels without strong emission.
3 Results
3.1 Continuum Results
A continuum image was constructed from the line free channels in the 1612 MHz data. The image shows two weak continuum sources 10′ to the west of the position of R22, with integrated flux densities of 0.5 Jy and 0.2 Jy. The sources, located near 10h 20m 15s, = -58° 04′ (J2000), are part of the H II region G 284.6-0.5, imaged at 6 cm by Shaver & Goss (1970). No continuum emission was detected at the position of R22 to within a 3 limit of 7 mJy beam-1.
3.2 Line Results
At 1612 MHz (see Figure 1a) the integrated line emission profile of R22 shows a multiple-peaked spectrum with a peak flux density of 42 Jy beam-1 and a velocity range of 50 km s-1, in agreement with the earlier observations of Allen et al. (1980). The integrated line emission profile at 1665 MHz, shown in Figure 1b, is clearly double-peaked, but asymmetric, with the blue-shifted emission predominating, in agreement with the 1612 MHz emission. The 1665 MHz emission has a peak flux density of 50 Jy beam-1 and a velocity range similar to the 1612 MHz line. The weaker 1667 MHz integrated line emission, which has a maximum of 2.9 Jy beam-1 is shown in Figure 2.
Recent measurements by Caswell (1998) found 1665 MHz and 1667 MHz emission at = 10h 21m 3387 = -58° 05′ 476 ( 04, J2000). This determination agrees with the position of the peak flux density at 1665 MHz and 1667 MHz from the observations reported here, as summarized in Table 2. Caswell measured a peak flux density of 2.1 Jy for the peak 1667 MHz emission, in good agreement with our observed flux density of 2.9 Jy beam-1. The peak flux density of the 1665 MHz line, as reported by Caswell (1998) (about 70 Jy beam-1), is quite uncertain due to the large correction for primary beam attenuation.
At 1612 MHz the locations of the centroids of the maser emission in each channel describe an arc, as shown in Figure 3a. This arc covers a position angle (PA) from 310° to 160 At the adopted distance of 2 kpc (Allen et al., 1980; Sahai et al., 1999), the maser emission spans approximately 2800 AU. The velocity increases as PA decreases around the arc, from -35 km s-1 in the NW to -5 km s-1 in the SE. At 160° the velocity–PA correlation changes sign, with velocity increasing from 0 km s-1 at 170° to 15 km s-1 at 210°. The pattern for the 1665 MHz emission (shown in Figure 3b) is similar to 1612 MHz, with the same velocity–PA change of sign at 170°. These relations are plotted in Figure 4. The brightest 1667 MHz maser emission is located near the center of the 1665 and 1612 MHz arcs, but does not show any clear velocity-position angle dependence.
3.3 Optical and Radio Morphology
3.3.1 Astrometry
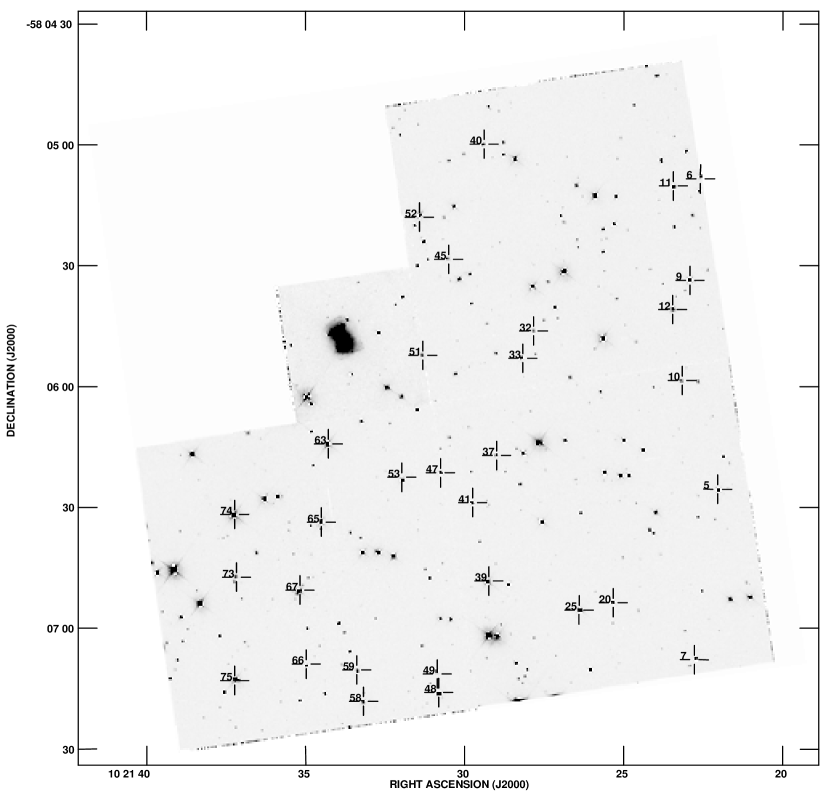
We aligned the HST image of R22, as obtained from the HST archive, to the radio reference frame using guide stars from the USNO-A2.0 catalog. We used mosaiced HST observations of R22, with the object located on the Planetary Camera chip and containing 32 stars from the UNSO-A2.0 catalog, all fainter than 12 magnitude. Table 3 lists the stars used, along with residuals and blue and red magnitudes. Figure 5 shows the stars plotted over the HST image. The USNO-A2.0 catalog has absolute astrometric calibration based on the International Celestial Reference Frame, through the Hipparcos Tycho catalog, and is in agreement with the radio reference frame to within 026 (Deutsch, 1999). Deutsch (1999) found that with sufficient reference stars, the position of current (epoch 2000) optical sources not found in USNO-A2.0 can be achieved to a (1) accuracy of 035. The dominant source of error is small-scale proper motions of reference stars since the 1950-era observations. We investigated several sources of additional error which may have affected our solution, including the proper motion of nearby stars and the uncertainty in relative chip positions. As recommended by Deutsch (1999) we excluded confused stars (such as stars resolved into optical binaries by HST) and stars with obvious proper motions from our fit. We compared solutions for stars on a single chip to solutions over all four chips (including a solution primarily using stars on the WPC) and found no discrepancy in star positions across the chip boundaries. Therefore the alignment of the HST and ATCA observations of R22, shown in Figure 6 and 7, has an accuracy of 035 (1).
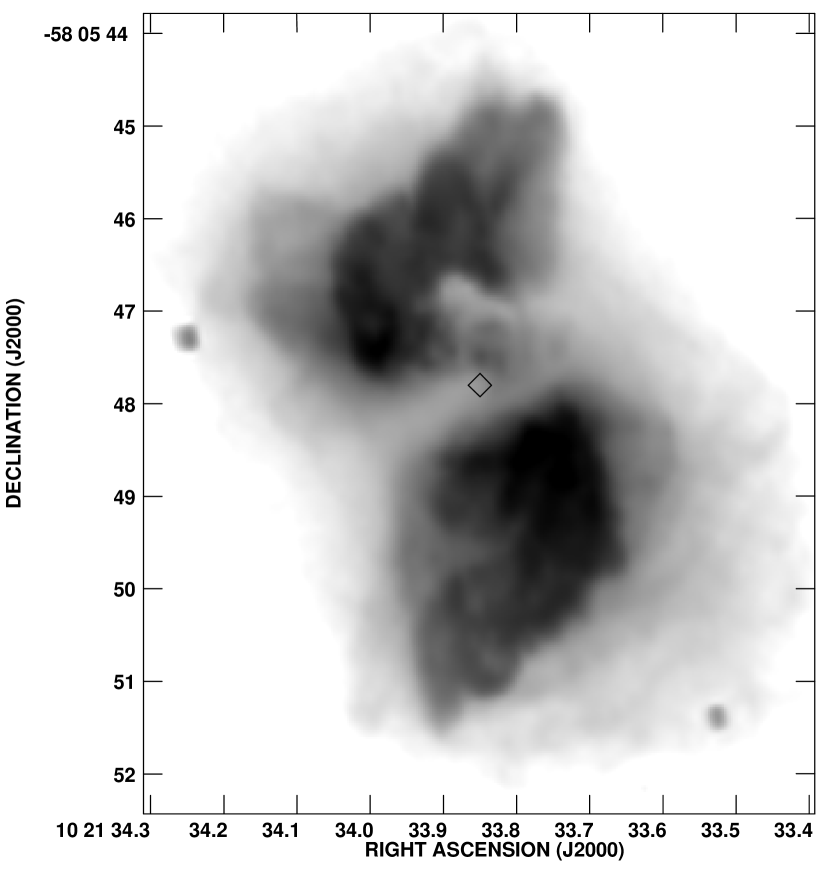
The 1612 and 1665 MHz emission features are associated with the northern lobe as shown in Figure 6. The 1612 MHz emission describes a circular arc coincident with regions of fainter optical emission in the waist of the bipolar outflow and in the “northern spur”, clearly visible as a region of decreased intensity in Figure 8. The 1665 MHz emission (see Figure 6b) is located along the same arc. The 1667 MHz emission is less precisely located, due to lower signal to noise but is clearly not confined to the same region (see Figure 7). We do not observe the equatorial spread of 1667 MHz emission shown in Figure 3b of Sahai et al. (1999); rather the emission seems approximately bounded by the extended emission of the nebulae, with the brightest masers (2.8 Jy) located near = 10h 21m 339, = -58° 05′ 48″ (J2000) (see Figure 7).
The alignment of the HST and OH maser observations as derived here, differs from that adopted by Sahai et al. (1999). In the absence of an astrometric solution to register the OH and optical emission, Sahai et al. (1999) assumed that the maser emission was aligned with the geometric center of the nebula, confined to the equatorial waist (Sahai, private communication). Their spatial alignment is therefore uncertain at, or above, the arcsecond level.
3.3.2 The position of the star
Without full spatial sampling, the arc of emission at 1612 MHz and 1665 MHz, shown in Figure 3 can be fit by a circle with radius 07 centered at = 10h 21m 3395 = -58° 05′ 473 We do not believe this position is the most likely location of the star. As stated by Bowers (1991) and te Lintel Hekkert et al. (1992) the most likely position for an obscured central star is the midpoint between the red- and blue-shifted maser emission. However this method is only reliable if the maser distribution is fully sampled in velocity, and is approximately symmetric in appearance. For the case of R22, the distribution on the sky is clearly non-symmetric (see Figure 3), and it is quite likely that maser emission has not been detected from the full range of velocities. Given the point symmetry in the nebulae structure, a more likely estimate is the center of the optical nebula. In the Hipparcos reference frame this suggested stellar position is = 10h 21m 3385, = -58° 05′ 478 (J2000). It should be noted that while we have accurately determined the optical-radio alignment, choosing a center of a non-symmetric nebula is a matter of opinion. The location marked by a cross in Figure 3 and diamonds in Figures 6-7 is the same location (relative to the nebula) proposed by Sahai et al. (1999), but aligning the HST image to the Hipparcos reference frame has shifted the optical coordinates by = -13, .
4 Discussion
The radio-interferometric images reported here are the first at 1612 MHz, and demonstrate a clear arc-like morphology in both the 1612 MHz and 1665 MHz OH maser emission. The observations have sufficient sensitivity to permit accurate measurements of the position of the centroid of the emission and the variation of maser component velocity across the spectrum. These signatures can be used to explore the kinematics of the circumstellar material in the region in which the OH masers are located in R22.
Double-peaked total-power spectra, such as those observed for R22 (Figs. 1-2), are commonly associated with spherical mass outflows in a stable maser emission region (Bowers, 1991), modulo deviations explained by localized mass loss and density variations (Silva et al., 1993). However, such outflows produce a characteristic radius-velocity signature, described by , where is the local standard of rest (LSR), is the radius of the shell, is the velocity of the central star, and is the expansion velocity. We plot the measured radius-velocity relationship for R22 as derived from the 1612 MHz and 1665 MHz centroid position in Figure 7, assuming the stellar position at the optical center of the nebula, as described in the preceding section. A spherically symmetric outflow is clearly not consistent with these data.
As discussed above, there is also a systematic variation of velocity with position angle along the arcs of emission at both 1612 MHz and 1665 MHz. This also argues strongly against a spherically symmetric outflow. The kinematic signatures observed for R22 could be produced by a variety of outflow models, perhaps in combination with local masing conditions which vary across the source.
Kinematic modeling of the maser emission was attempted, by fitting to parametrized ellipsoidal models, similar to those described by Bowers (1991). Such fitting is sensitive to the assumed stellar position, the degree of completeness of the velocity and spatial sampling, and the assumptions regarding maser transport. The models employed assumed a regular kinematic flow with one component. Maser intensity was derived directly from the velocity coherence along the line of sight, and no allowance was made for local masing conditions, density or turbulence. No conclusive model has been obtained, and further work is planned in this area.
We can conclude from our study of the kinematic properties of the source that R22 does not show characteristics of a classical OH/IR star. The highly asymmetric OH maser emission supports the classification as a PPN, as clearly supported by the HST observations (Sahai et al., 1999).
The accurate relative astrometry reported here shows a striking spatial association between the arcs of OH maser emission at 1612 MHz and 1665 MHz and the bipolar optical emission, especially in the region of the “northern spur”, shown in Figure 6.
5 Conclusions
We have presented radio-interferometric images of the OH maser emission towards R22, obtained using the ATCA, in the transitions at 1612 MHz, 1665 MHz and 1667 MHz. The principal conclusions of this work are:
-
•
The OH maser emission at 1612 MHz and 1665 MHz has an arc-like morphology, with a clear, systematic dependence of maser position and velocity across the spectrum. The kinematic signatures are not consistent with a classical OH/IR star with a spherically symmetric outflow.
-
•
The OH maser emission and the HST optical image have been astrometrically aligned to within 0.35″ (1). This defines the exact location of the OH maser emission in the equatorial waist of the optical bipolar outflow.
-
•
The maser kinematics support the classification of this object as a PPN as suggested by Sahai et al. (1999).
References
- Allen et al. (1980) Allen, D.A., Hyland, A.R., Caswell, J.L., 1980 MNRAS, 192, 505
- Bowers (1991) Bowers, P.F., 1991, ApJS, 76, 1099
- Briggs (1995) Briggs, D.S., 1995, Ph.D. thesis, New Mexico Institute of Mining and Technology.
- Bujarrabal & Bachiller (1991) Bujarrabal, V. & Bachiller, R. 1991, A&A, 242, 247
- Caswell (1998) Caswell, J. L. 1998, MNRAS, 297, 215
- Deutsch (1999) Deutsch, E. W. 1999, AJ, 118, 1882
- Frogel & Persson (1975) Frogel, J.A., Persson, S.E., 1975, ApJ, 197, 351
- Kogan (1997) Kogan, L. 1997 AIPS memo #97, October 14, 1997, available at http://www.cv.nrao.edu/aips/aipsdoc.html#MEMOS
- Manchester et al. (1969) Manchester, R.N., Goss, W.M., Robinson, B.J., 1969 ApJ, V. 3, 1, 11
- Manchester et al. (1970) Manchester, R.N., Robinson, B.J., Goss, W.M., 1970 Aust. J. Phys. 23, 751
- Roberts (1962) Roberts, M.S., 1962, AJ, 67, 1, 79
- Sahai et al. (1999) Sahai, R., Zijlstra, A., Bujarrahal, V., te Lintel Hekkert, P., 1999 AJ, 117, 1408
- Shaver & Goss (1970) Shaver, P.A., Goss, W.M. 1970 Aust. J. Phys. astrophys. Suppl. 14, 77
- Silva et al. (1993) Silva, A.M., Azcàrate, I.N., Pöppel, W.G.L., Likkel, L., 1993 A&A, 275, 510
- te Lintel Hekkert et al. (1992) Te Lintel Hekkert, P. T. L., Chapman, J. M. & Zijlstra, A. A. 1992, ApJ, 390, L23
- Wilson et al. (1970) Wilson, W.J., Barrett, A.H., Moran, J.M. 1970 ApJ, 160, 545


| Observation Date | February 1,4 1997 |
|---|---|
| Configuration | 6A |
| (J2000) | 10h 21m 3398 -58° 05′ 38″ |
| 28418 -079 | |
| Total Bandwidth | 4 MHz/740 km s-1 |
| Number of Channels | 2048 |
| Channel Separation | 1.95 kHz/0.36 km s-1 |
| Spectral Resolution | 2.36 kHz/0.44 km s-1 |
| Flux Density Calibrator | 1934-638, 14.5 Jy at 1612 MHz |
| Phase Calibrator | J0823-500, 7.7 Jy at 1612 MHz |
| 1612 MHz | 1665 MHz | 1667 MHz | |
|---|---|---|---|
| Observation Duration | 925 min | 140 min | 140 min |
| Spatial Resolution | 75 62 | 204 51 | 204 51 |
| Beam Position Angle | -58° | 13° | 13° |
| RMS Noise | 10 mJy beam-1 | 24 mJy beam-1 | 24 mJy beam-1 |
| Peak Flux Density | 42.2 Jy beam-1 | 50.1 Jy beam-1 | 2.88 Jy beam-1 |
| Location of Peak: | 10213386 | 10213387 | 10h 21m 339 |
| (J2000) | -58° 05′ 476 | -58° 05′ 477 | -58° 05′ 479 |
| Velocity of Peak | -25.0 km s-1 | -27.5 km s-1 | -27.8 km s-1 |
| Ref.11These are merely reference numbers, also used in Figure 5. The USVO returned more than 80 stars, many of which did not fit our criterion, as discussed in Section 3.3.1. | RA: h m s 22The fitted positions of the star can be found by ddd.dd-residuals | Residuals ″ 33The given positions of the stars from USNO, epoch 1980.274483. | DEC:° ′ ″ | Residuals ″ | Red m | Blue m |
|---|---|---|---|---|---|---|
| 5 | 10 21 22.0420 | -0.10 | -58 06 25.480 | -0.23 | 17.2 | 18.6 |
| 6 | 10 21 22.5880 | -0.18 | -58 05 08.470 | 0.40 | 16.9 | 18.2 |
| 7 | 10 21 22.7760 | -0.58 | -58 07 07.830 | 0.33 | 17.4 | 19.1 |
| 9 | 10 21 22.9127 | 0.29 | -58 05 33.650 | -0.08 | 16.9 | 18.3 |
| 10 | 10 21 23.1640 | 0.75 | -58 05 58.510 | -0.27 | 17.7 | 19.5 |
| 11 | 10 21 23.4380 | -0.23 | -58 05 10.220 | -0.32 | 17.4 | 19.3 |
| 12 | 10 21 23.4653 | 0.05 | -58 05 40.870 | -0.02 | 16.8 | 18.0 |
| 20 | 10 21 25.3260 | -0.03 | -58 06 53.700 | 0.06 | 17.7 | 19.8 |
| 25 | 10 21 26.3993 | -0.07 | -58 06 55.470 | 0.04 | 16.9 | 18.0 |
| 32 | 10 21 27.8387 | 0.01 | -58 05 46.210 | -0.07 | 17.8 | 19.9 |
| 33 | 10 21 28.1720 | 0.43 | -58 05 52.970 | 0.02 | 17.6 | 19.0 |
| 37 | 10 21 28.9907 | 0.01 | -58 06 17.150 | 0.18 | 17.5 | 19.3 |
| 39 | 10 21 29.2400 | 0.62 | -58 06 48.310 | -0.16 | 15.6 | 17.4 |
| 40 | 10 21 29.3893 | -0.09 | -58 04 59.840 | -0.28 | 17.5 | 18.9 |
| 41 | 10 21 29.7473 | -0.01 | -58 06 28.800 | 0.14 | 17.7 | 19.5 |
| 45 | 10 21 30.4973 | 0.15 | -58 05 28.430 | 0.02 | 17.7 | 19.3 |
| 47 | 10 21 30.7627 | 0.06 | -58 06 21.450 | -0.06 | 17.7 | 19.3 |
| 48 | 10 21 30.8133 | -0.17 | -58 07 15.990 | -0.25 | 17.0 | 18.1 |
| 49 | 10 21 30.8613 | 0.22 | -58 07 11.400 | 0.57 | 17.7 | 19.0 |
| 51 | 10 21 31.3127 | 0.26 | -58 05 52.290 | 0.72 | 17.4 | 19.0 |
| 52 | 10 21 31.4233 | -0.58 | -58 05 17.940 | 0.40 | 15.9 | 17.2 |
| 53 | 10 21 31.9747 | -0.22 | -58 06 22.560 | -0.57 | 17.1 | 18.6 |
| 58 | 10 21 33.1773 | 0.09 | -58 07 18.150 | -0.14 | 17.3 | 18.6 |
| 59 | 10 21 33.3880 | -0.31 | -58 07 10.370 | -0.03 | 17.4 | 18.8 |
| 63 | 10 21 34.2860 | 0.14 | -58 06 14.230 | -0.03 | 15.9 | 16.8 |
| 65 | 10 21 34.5047 | -0.08 | -58 06 33.660 | 0.11 | 15.7 | 18.2 |
| 66 | 10 21 34.9773 | -0.16 | -58 07 08.930 | -0.14 | 17.5 | 19.7 |
| 67 | 10 21 35.1753 | 0.05 | -58 06 50.530 | -0.21 | 16.4 | 17.1 |
| 73 | 10 21 37.1733 | -0.02 | -58 06 47.310 | 0.25 | 17.3 | 18.6 |
| 74 | 10 21 37.2267 | 0.16 | -58 06 31.780 | -0.11 | 15.0 | 15.5 |
| 75 | 10 21 37.2287 | -0.41 | -58 07 12.980 | 0.34 | 15.6 | 17.2 |
| 78 | 10 21 38.5253 | -0.21 | -58 06 16.790 | 0.07 | 16.1 | 17.3 |
| Line | Channel | Velocity | Peak Int. | Unc. | Integral Int. | Unc. | RA J2000 | Unc. | DEC | Unc. |
|---|---|---|---|---|---|---|---|---|---|---|
| ATCA | km/s | Jy/Beam | Jy/Beam | Jy | Jy | h m s | s | ° ′ ″ | ″ | |
| 1612 | 60 | -35.13 | 2.1917 | 1.02E-02 | 2.2151 | 1.78E-02 | 10 21 33.884 | .00182 | -58 5 46.73 | .01294 |
| 1612 | 62 | -34.41 | 5.6757 | 1.11E-02 | 5.6536 | 1.92E-02 | 10 21 33.883 | .00075 | -58 5 46.74 | .00545 |
| 1612 | 64 | -33.68 | 9.1162 | 1.34E-02 | 9.0928 | 2.31E-02 | 10 21 33.876 | .00055 | -58 5 46.84 | .00415 |
| 1612 | 66 | -32.95 | 3.5755 | 1.10E-02 | 3.5849 | 1.92E-02 | 10 21 33.878 | .00117 | -58 5 46.90 | .00874 |
| 1612 | 68 | -32.23 | 3.2178 | 1.02E-02 | 3.2203 | 1.78E-02 | 10 21 33.877 | .00122 | -58 5 47.04 | .00892 |
| 1612 | 70 | -31.50 | 2.6848 | 1.04E-02 | 2.6622 | 1.79E-02 | 10 21 33.866 | .00147 | -58 5 47.03 | .01086 |
| 1612 | 72 | -30.78 | 1.4879 | 1.00E-02 | 1.4597 | 1.71E-02 | 10 21 33.856 | .00251 | -58 5 47.08 | .01890 |