The Hubble Deep Field in the Far Ultraviolet
\toctitleThe HDF in the Far Ultraviolet
11institutetext: Space Telescope Science Institute
3700 San Martin Drive
Baltimore, MD 21218 USA
*
Abstract
Results from a recent HST survey of field galaxies at wavelengths 1600 Å and 2400 Å are be presented. The data are used to constrain the fraction of Lyman-continuum radiation that escapes from galaxies at redshifts . The combined UV-IR photometry for HDF galaxies is also used to investigate whether low-mass starburst galaxies dominate the field-galaxy population at redshift . The relative lack of objects with the colors of faded bursts suggests that star-formation is largly quiescent rather than bursty or episodic.
When the ultimate self-consistent model of cosmology and galaxy evolution comes along it will be able to reproduce the full distribution of galaxy shapes, sizes, masses, and spectral types, at all redshifts and in all environments. Until that happens, we as observers are forced to try to piece together portions of the puzzle, gathering data as new facilities and techniques become available, and testing and refining parts of the theory. One of the new facilities that has relatively recently become available is the Space Telescope Imaging Spectrograph (STIS), which was installed on the Hubble Space Telescope in 1997. Prior to STIS, the deepest observations of galaxies at far-UV ( Å) wavelengths reached to 111Magnitudes throughout this contribution are on the AB system (Oke 1974), where Far-UV observations provide a sensitive probe of the population of young massive stars in galaxies, and spectral breaks at Lyman and the Lyman break (912 Å) are among the strongest features that can be used for estimating photometric redshifts. The STIS Multi-Anode-Microchannel Array (MAMA) detectors provide sensitive imaging over a in two bands centered at approximately 1600 Å (FUV) and 2400 Å (NUV). Rest-frame emission shortward of 2000 Å can be measured for the first time in galaxies in the crucial redshift range , probing the period where most of the stars in the present-day universe were formed.
Amongst the aims of our survey were to (1) measure galaxy counts in the far-UV, (2) compare rest-frame UV morphologies to optical morphologies for galaxies at , (3) measure the far-UV background and constrain the contribution from faint galaxies, (4) constrain the contribution of galaxies to the metagalactic ionizing background radiation, and (5) constrain the star-formation histories of dwarf galaxies at redshifts . The observations cover an area of one square arcminute, with three sigma detection limits of in both the NUV and FUV bands. Galaxy counts from our survey have been presented by Gardner et al. [10] and constraints on the FUV background by Brown et al. [3]. In this contribution, we concentrate on two topics: setting constraints on the ionizing radiation escaping from galaxies and setting constraints on star-formation histories of low-luminosity galaxies in the HDF.
1 The Ionizing Radiation Escaping from Galaxies
Studies of quasar absorption lines indicate that the intergalactic medium is highly ionized out to redshifts of order . Instead of appearing as a smooth Gunn-Peterson (1965) absorption trough at redshifts less than 1216 Å in the rest frame QSO of the QSOs, the absorption due to neutral hydrogen in the IGM appears at discrete wavelengths (the Lyman-alpha forest). The total baryon content in neutral gas is much less than that expected from primordial nucleosynthesis, and both the measurements of the line strengths of different ionization states heavier elements, and the measurement of the proximity effect suggest that the gas is highly ionized by a metagalactic radiation field [16, 2]. It is likely that the ionization of the IGM plays an important role in regulating the cooling and collapse of gas to form galaxies [1, 19].
The IGM at high redshifts is most likely ionized by young galaxies and QSOs. However, the relative contribution of these two types of objects to the high-redshift ionizing background is not well constrained. The declining space density of QSOs beyond suggests that even if they produce most of the ionizing photons at , their contribution is likely to decline dramatically at high redshifts. An extrapolation of the measured luminosity functions and redshift evolution suggests QSOs and other AGN are likely to provide only about 25% of the ionizing photons at 1 Ryd at z=5. In contrast, the Lyman continuum flux estimated to arise from the integrated LF of galaxies at appears sufficient to keep the IGM ionized, provided that a fraction of the ionizing photons escape [13].
The most direct constraints on at redshift come from observations of four starburst galaxies with the Hopkins Ultraviolet Telescope (HUT) [11]. More recently Steidel et al. [17] have reported a detection of Lyman continuum radiation from a composite spectrum of 29 Lyman-break galaxies at redshifts . The measured ratio of 900 Å to 1500 Å emission is remarkably high, indeed higher than expected from some population synthesis models even if 100% of the of the intrinsic Lyman continuum radiation escapes. However, the measurement of this break in the composite spectrum is extraordinarily difficult, and a substantial correction for IGM attenuation is required to derive the intrinsic flux decrement of the composite galaxy spectrum. Even if the detection itself is real, there are concerns that the sample is biased toward the bluest of the Lyman-break galaxies.
There are seven galaxies in our STIS HDF field with spectroscopic redshifts . At the center of the FUV bandpass is at Å, and the integrated throughput from wavelengths longer than Å is less than 0.2% of the total throughput. To maximize the signal-to-noise ratio, UV fluxes and upper limits for the seven galaxies have been estimated using a fitting technique (TFIT) [15] on the STIS images after convolution to the resolution of the F450W HDF images.
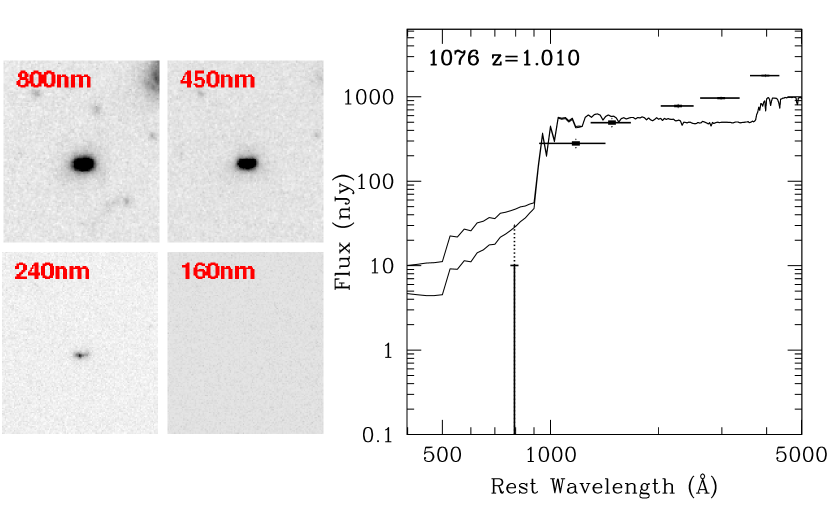
Figure 1 shows the photometry for one of the galaxies, superimposed on a typical star-forming galaxy spectral energy distribution with and without Madau [12] IGM attenuation. Only one of the seven galaxies in our sample is detected, and that one at only the 2.5 level.
For a galaxy at , the half-maximum points of the FUV bandpass are at rest-frame wavelengths 730 and 830 Å, hence a small correction is necessary to estimate F(900). We have so far done this only in a crude way, accounting for the typical IGM attenuation but assuming a flat spectrum in rather than a model stellar population. The resulting values of , displayed in Figure 2, should thus be regarded as preliminary, but are unlikely to change by more than a few percent.
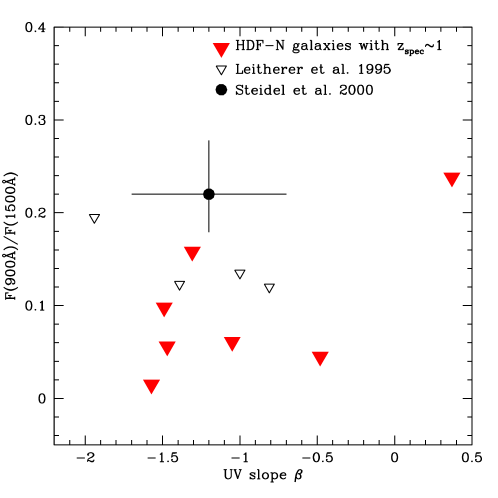
For unreddened star-forming objects, population synthesis models predict , which is roughly the minimum level of Lyman continuum jump consistent with the Leitherer et al. [11] spectra. Leitherer et al. used H measurements of the galaxies in their sample to set a lower limit on the total number of Lyman-continuum photons that must be present. Based on that analysis they derived upper limts on ranging from 1% to 15%. Lacking H fluxes for the HDF galaxies, we must adopt a model spectrum to infer from . For this preliminary analysis we adopt the model shown in Fig. 1; in the final analysis this will be refined by fitting models to each individual galaxy. For this model, if we assume that all the UV radiation produced by stars at rest-frame 1500 Å escapes from the program galaxies, then our upper limits translate into to 0.9 (depending on the galaxy). If we instead make the more reasonable assumption that there is some dust attenuation of the stellar radiation at both 900 Å and 1500 Å, then adopting a factor of 4.7 attenuation at 1500 Å [18] and a Calzetti [5] attenuation curve leads to upper limits to , significantly below the claimed detection [17], but compatible with the expectations from recent radiative transfer models [7]. In general, accounting for dust and gas attenuation, % for all galaxies with sufficiently deep measurements from both HUT and HST.
2 Star-formation in galaxies at
It is likely that the ionizing background inhibits the cooling of gas in low-density regions, and in particular in the halos of low-mass galaxies [8, 1, 19, 14]. This has led to suggestions that a large fraction of the faint-blue galaxies are dwarf galaxies undergoing starbursts at moderate redshifts. While the most extreme of these models are ruled out [9], it is still possible that dwarf galaxies undergoing some form of episodic star formation are a major contributor to faint-galaxy counts [4].
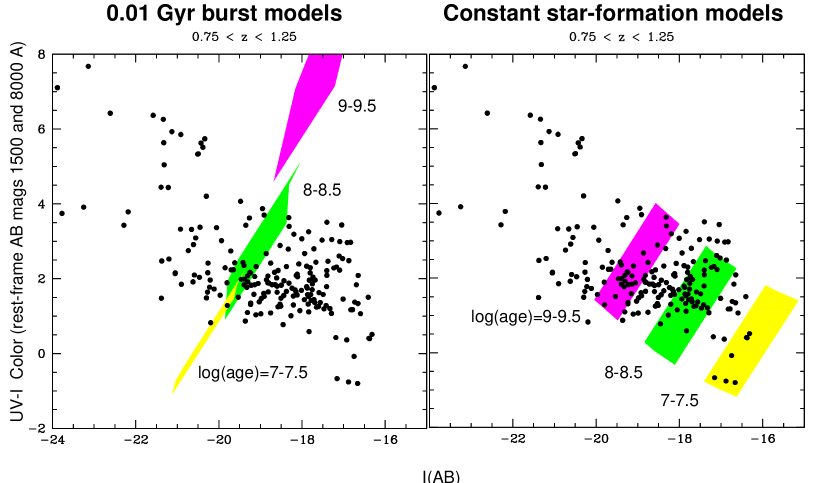
From the combined multi-wavelength HDF observations, it is possible to investigate whether starbursts or episodic star formation are ubiquitous or rare in the faint-galaxy population. The argument goes as follows: if dwarf galaxies are forming stars in bursts with star-formation timescales and with intervals between episodes , then provided this is roughly a steady-state process there ought to be 10 times as many galaxies with ages as there are galaxies with age . And there ought to be 100 times as many galaxies with ages provided is greater than . We can thus examine the “fading sequences” in color-magnitude or color-color space and see whether the galaxies are piling up in location expected if they are bursting and then fading.
Figure 3 shows a color–absolute-magnitude diagram of HDF galaxies with photometric redshifts , spanning a range of lookback times from 7 to 9.2 Gyr for a cosmology with The two panels of the figure show the regions that should be occupied by galaxies with stellar masses of for with Calzetti [5] extinctions and ages in three ranges of 0.5 dex. The left panel shows burst models and the right panel shows constant star-formation models. Now, given that the number of years spanned by the three regions increases by a factor of 10 as they move to older ages, any steady state process should have the galaxies bunching up at the older ages. The distribution of colors for the HDF galaxies is clearly inconsistent with most of them undergoing short bursts. Under these model assumptions the HDF galaxy colors cluster around ages of , but there is no increase of galaxy numbers toward older ages. In contrast, the loci of HDF points are reasonably consistent with that expected from roughly constant star-formation rates. From this type of analysis, a fairly robust conclusion is that star-formation in faint-blue galaxies at is a relatively quiescent process. Dwarf galaxies undergoing single bursts or episodic star formation with a duty cycle are not the dominant population. Alternatively, the bursting galaxies must fade more rapidly than expected from simple population-synthesis models, either because the IMF is top heavy, or because the stellar population expands when the gas is driven out, and the galaxies then drop below the HDF detection limit in surface brightness.
I would like to thank my collaborators on this project, particularly Tom Brown, Jon Gardner, Eliot Malumuth, and Casey Papovich. Support for this work was provided by NASA through grant number GO-07410.01-96A from the Space Telescope Science Insitute, which is operated by the Association of Universities for Research in Astronomy under NASA contract NAS5-26555.
References
- [1] Babul, A. & Rees, M. J. 1992, MNRAS, 255, 346
- [2] Bajtlik, S., Duncan, R. C. & Ostriker, J. P. 1988, ApJ, 327, 570
- [3] Brown, T. M., Kimble, R. A., Ferguson, H. C., Gardner, J. P., Collins, N. R. & Hill, R. S. 2000, AJ, 120, 1153
- [4] Campos, A. 1997, ApJ, 488, 606
- [5] Calzetti, D. 1997, AJ, 113, 162
- [6] Dickinson, M. E. et al. 2001, in preparation
- [7] Dove, J. B., Shull, J. M. & Ferrara, A. 2000, ApJ, 531, 846
- [8] Efstathiou, G. 1992, MNRAS, 256, 43P
- [9] Ferguson, H. C. & Babul, A. 1998, MNRAS, 296, 585
- [10] Gardner, J. P., Brown, T. M. & Ferguson, H. C. 2000, ApJ, 542, L79
- [11] Leitherer, C., Ferguson, H. C., Heckman, T. M. & Lowenthal, J. D. 1995, ApJ, 454, L19
- [12] Madau, P. 1995, ApJ, 441, 18
- [13] Madau, P., Haardt, F. & Rees, M. J. 1999, ApJ, 514, 648
- [14] Navarro, J. F. & Steinmetz, M. 1997, ApJ, 478, 13
- [15] Papovich, C. & Dickinson, M. E. 2000, in preparation
- [16] Steidel, C. & Sargent, W. L. W. 1989, ApJ, 343, L33
- [17] Steidel, C. C., Pettini, M. & Adelberger, K. L., 2000, astro-ph/0008283
- [18] Steidel, C. C., Adelberger, K. L., Giavalisco, M., Dickinson, M. & Pettini, M. 1999, ApJ, 519, 1
- [19] Thoul, A. A. & Weinberg, D. H. 1996, ApJ, 465, 608