Photometric and spectroscopic study of the young open cluster NGC 1893
Abstract
We present CCD photometry of the field of the open cluster NGC 1893. Our photometry is deep enough to cover the complete main sequence B spectral type. We identify very likely members of the cluster down to spectral type B9-A0, some of which have much higher reddenings than the average. We derive a color excess and a dereddened distance modulus . From the index, we identify several candidates as emission-line stars, for which we have obtained spectroscopy. Three of them display spectra corresponding to spectral type F, but showing H in emission. Photometric measurements in this and previous studies indicate strong variability. These characteristics show them to be pre-main-sequence stars of spectral type F. We also identify two likely Herbig Be stars. These results hint at the existence of a sizable pre-main-sequence population in NGC 1893.
1 Introduction
NGC 1893 is a very young cluster immersed in the bright diffuse nebulosity IC 410, associated with two pennant nebulae, Shain and Gaze 129 and 130, and obscured by several conspicuous dust clouds. photometry of NGC 1893 has been presented by Hoag et al. (1961), Cuffey (1973) and Massey et al. (1995). Tapia et al. (1991, henceforth T91) performed near-infrared and Strömgren photometry for 47 stars in the field of the cluster. They estimate the age of the cluster to be yr, derive a distance modulus , and an extinction to the cluster . Strömgren photometry for 50 stars in the field of NGC 1893 has also been reported by Fitzsimmons (1993), who confirms the distance and age found by T91. Vallenari et al. (1999) performed near-infrared photometry of the cluster and came to the conclusion that there could be many pre-main-sequence candidates in NGC 1893, though their method did not allow clear discrimination from field interlopers.
Even though the earliest spectral type stars in NGC 1893 are rather bright, spectroscopic work on cluster members is very scarce. Massey et al. (1995) obtained intermediate-resolution spectra of a few of the brightest stars in the cluster and derived their spectral classification. Rolleston et al. (1993) obtained higher resolution spectroscopy of eight stars whose photometric indices were consistent with an early B-type spectral classification and derived their astrophysical parameters and metal abundances.
This paper belongs to a series dedicated to the study of the B-star population of young Galactic open clusters. We use the photometric system H because it is the most adequate for the study of early-type stars, since it has been purposely designed to provide accurate measurements of their intrinsic properties. After identifying a large number of a likely B-type members, we have carried out a spectroscopic study of some stars showing interesting peculiarities.
2 Observations
2.1 Photometry
The data were obtained with the Jacobus Kapteyn Telescope (JKT), located at the Observatorio del Roque de los Muchachos, La Palma, Spain, in December 1997, using the 1024 x 1024 TEK 4 chip CCD and the four Strömgren and the narrow and wide H filters. Pixel size was in such a way that the whole field covered by each frame was x . Four frames covering the whole of the central core of the cluster were taken (central coordinates are displayed in Table 1). Figures 1(a)-1(d) show plots of the observed fields. The dot sizes are indicative of the relative instrumental magnitude. Each field was observed twice using different exposure times, so that the widest range of magnitudes possible was observed with good signal-to-noise ratio.
Throughout this paper the nomenclature used will be that of Cuffey (1973), where the whole cluster area was divided into smaller zones, using three rings and four sectors. Designation of a star is given by stating the sector, the ring, and the number of the star in that particular zone. For two stars that were not observed by Cuffey, a new nomenclature has been adopted, designating them by listing their number after a prefix “s5”(s5000 and s5001).
The reduction of all frames was done with the IRAF routines for the bias and flat-field corrections. The photometry has been obtained by PSF-fitting using the DAOPHOT package (Stetson 1987) provided by IRAF. In order to construct the PSF empirically, we manually select bright stars in the least-crowded areas (typically 712 in each frame) trying to cover the largest possible magnitude interval in each frame (typically an interval of 4-5 instrumental magnitudes). We preferentially choose stars with no or very few close neighbours as PSF stars, since this results in a simpler and faster process. Once we have the list of PSF stars, we determine an initial PSF by fitting Gaussian functions. Afterwards, we run the PSF-fitting photometry routine nstar, which fits PSF’s to all the groups (PSF star + neighbors) in a frame simultaneously. Most of these groups contain only the PSF star. When a PSF star has neighbors, we previously check that the FIT radii ( FWHM) of the neighbor stars do not merge into the PSF radius of the PSF star, so that we can apply the procedure without modifying any parameters. The routine substar is then used to subtract the PSF stars and their neighbors from the frames. We examine the subtracted image and make sure that they have been cleaned completely. Examination shows that there is no systematic pattern of PSF variability with position on the chip, and therefore the PSF is constant across the frame. Finally we run the routine allstar and obtain the instrumental magnitudes from all stars in each frame. Since our standard stars were selected from other program clusters in the same campaign and the aperture size used was the same in all campaign frames ( pixels), no aperture correction is necessary. The atmospheric extinction corrections were performed using the RANBO2 program, which implements the method described by Manfroid (1993). It has been shown the choice of standard stars for the transformation is a critical issue in photometry. Transformations made only with unreddened stars introduce large systematic errors when applied to reddened stars, even if the color range of the standards brackets that of the program stars (Manfroid & Sterken, 1987 and Crawford, 1994). Our data cover a very wide range of spectral types with a correspondingly wide range of intrinsic colors. Moreover, during this campaign several clusters with different interstellar reddenings were observed.
A preliminary list of standard stars was built by selecting a number of putatively non-variable non-peculiar stars in the clusters and Persei, NGC 2169, NGC 6910 and NGC 1039, which had been observed with the same Kitt Peak telescopes and instrumentation used to define the Crawford & Barnes (1970b) and H Crawford & Mander (1966) standard systems, so that there is no doubt that the photometric values are in the standard systems. Since the original and Persei observations (Crawford et al. 1970) do not include values, we used values given by Johnson & Morgan (1955), which were also taken with the same instrumentation, for the transformation. The list of standard stars used can be found in Table 2 along with their standard values, used for the transformation, taken from Crawford et al. (1970) and Johnson & Morgan (1955) for and Persei, Perry et al. (1978) for NGC 2169, Crawford et al. (1977) for NGC 6910 and Canterna et al. (1979) for NGC 1039. Spectral types, when available, have been taken from Schild (1965) and Slettebak (1968) for and Persei, Perry et al. (1978) for NGC 2169, Morgan & Harris (1956) and Hoag & Applequist (1965) for NGC 6910 and Canterna et al. (1979) for NGC 1039.
With the extinction corrected magnitudes, the following transformation is obtained using the equations from Crawford and Barnes (1970b), where the coefficients have been computed following the procedure described in detail by Grønbech et al.(1976) using the selected standard stars list:
where the subindex “i” stands for instrumental magnitudes.
The transformed values for the 41 standard stars used is given in Table 3, together with their precision and their deviation with respect to the cataloged standard values. Table 4 shows the mean catalog minus transformed values for the standard stars and their standard deviations, which constitute a measure of the accuracy of the transformation. From the mean differences between catalog and transformed values, it is clear that there is not a significant offset between our photometry and the standard system. Since the individual differences for a few stars seem to be rather high, an attempt was made to improve the transformation by removing these stars from the standard list, but it was found that the transformation coefficients and their precision did not improve.
The H instrumental system and transformation equations were computed following the procedure described in detail by Crawford & Mander (1966). The transformation coefficients are and . Transformed values and their differences with respect to mean catalog values are given in Table 3. The mean difference is with a standard deviation , which, as in the case of the transformation, indicates that there is no significant offset with respect to the standard system.
2.2 Spectroscopy
Spectroscopy of selected stars was taken on February 3 – 6, 2000, using the 1.52-m G. D. Cassini telescope, at the Loiano Observatory, Italy, equipped with the Bologna Faint Object Spectrograph and Camera (BFOSC). The detector was a 2048 x 2048 Loral CCD with a 15m pixel size, which covers a x field. Due to the sky conditions, only low-resolution spectroscopy could be performed for stars with . We used BFOSC grism#4, which gives a resolution of Å/mm over the 4700 – 8800 Å interval (the resolution element is Å). With this configuration, a 30-min exposure on one of the fainter () targets gave typically a Signal-to-Noise ratio per pixel in the wavelength direction (integrated over all columns) of on the red continuum. For brighter stars, we also took spectra using BFOSC grism#3, which gives Å/mm over the blue part of the spectrum (resolution Å). A log of the observations is presented in Table 5.
In addition, we have retrieved from the ING Archive all the observations used in the work of Rolleston et al. (1993), in order to derive spectral types for those stars by comparing them to spectra of MK standard stars observed at a similar resolution by Steele et al. (1999). Details for these data can be found in Rolleston et al. (1993).
All the data have been reduced following the standard procedure by using the Starlink software packages ccdpack (Draper, 1998) and figaro (Shortridge et al., 1997) and analysed using figaro and dipso (Howarth et al., 1997).
3 Results
3.1 Photometry
We have obtained CCD photometry for 111 stars, reaching a magnitude limit . In Table 6 we present the resulting values for and , together with the number of observations for each star and their pixel coordinates in the corresponding frame (when a star is present in more than one field, we give its coordinates in the frame in which it is better centered).
3.2 Member Stars and Reddening Slopes
The first step in the analysis is the estimate of membership for the stars measured in each field. Since previous authors have already shown that NGC 1893 is a young cluster in which B-type stars have not had time to leave the main sequence (T91) and our magnitude limit implies that cluster members can only be seen up to an absolute magnitude , all the cluster members in our sample must be OB stars. Therefore we can calculate the free reddening indices [], [] and [], where
| (1) |
| (2) |
| (3) |
and then use the [] – [] and – [] diagrams for the approximate spectral classification of cluster stars.
Figure 2 shows the [] – [] diagram for all observed stars. As already noted by T91, most members of NGC 1893 lie to the right of the average intrinsic color loci of field main sequence stars (determined using the standard relations from Perry et al. 1987). All the stars lying close to the B-type line in the [] – [] diagram fall along a narrow strip in the – [] diagram, which we interpret as the cluster main sequence (see Figure 3).
The only exceptions are S3R1N3, which is an emission line star (see below) and S3R1N4, which also has a much lower index than expected. Spectroscopy of this object will be necessary in order to establish whether it is a Be star or an evolved star (since its position in the diagram makes unlikely its being a non-member). The three stars in our sample previously classified (spectroscopically) as O-type members fall along the main sequence as well. The validity of the [] index as an approximate spectral classification indicator can be checked by comparing the values obtained with the spectral types derived spectroscopically (Table 7).
From the – [] diagram, we have selected all those stars falling along the B-star strip, those on the border area between B9 and A0 and those falling along the early A-type branch. The values for [] and [] and the value of [] are listed in Table 7. Due to the large uncertainties in the relationship between photometric indices and spectral types we have gone no further than dividing the stars in three large groups:O-Type, B-type and A-type.
Those stars that in the – diagram present a magnitude much higher than expected for their spectral type are branded as non-members. Since the index is less affected by extinction than the color , this is a much more secure diagnostic than the – diagram (see Figures 4 and 5). The star S3R1N13, which we have identified as a main-sequence B star from its position in the – [] diagram, lies away from all other cluster members in both diagrams and is therefore branded as non-member. Several stars lying to the right of other cluster members in the – diagram, grouped together with the members in the – diagram. Since NGC 1893 is known to present differential reddening, we identify these stars as members with particularly high local reddening, something which is confirmed by the reddening estimation (see below).
Most stars whose parameters in the – [] diagram identify as A-type stars present magnitudes in the – diagram much higher than expected for their spectral type and they turn out to be non-members. Only four stars lying close to the B9/A0 limit are considered likely members (S1R1N4, S2R2N25, S2R3N59 and S4R1N16). The list of all the stars that are identified as likely members is given in Table 8. For these stars we have calculated their color excess using the iteration procedure given by Crawford (1978). These values are also listed in Table 8.
In the – diagram (see Figure 6) most cluster members concentrate in the range, but there are several stars displaying much higher reddenings. All these stars come from a relatively small spatial area within the cluster, which must be affected by local extinction. Leaving out this group of more highly reddened stars (including only stars with ), we determine an average cluster reddening of from all the other members, where the uncertainty represents the standard deviation of the mean for the average. With this value we have calculated the intrinsic colors and magnitudes of all cluster members, which are listed in Table 8.
For all the stars classified as likely members, we have estimated a spectral type by using the temperature calibration from Napiwotzki et al. (1993). This calibration, based on the [] index, is valid for stars with K and should therefore be valid for all members. By using the expression
| (4) |
we find the temperatures listed in Table 7. Once we have this information, we derive approximate spectral types by correlating the estimated with the average values for each spectral type from Kontizas & Theodossiou (1980). All objects are supposed to be unevolved and main-sequence values have been adopted. Of the eight B-type stars with spectroscopic classification, only three show agreement with the derived photometric temperature, all the others having photometric temperatures too low for their spectral type. However, this effect is not very large and in all cases implies differences of approximately 1 spectral subtype. Given the magnitude range covered by our observations, we must suspect that the temperature calibration is more accurate for later spectral types, because the photometric temperatures correspond well to the derived absolute magnitudes, even though there are no spectroscopic spectral types available for comparison.
3.3 H–R Diagram
Figures 7 and 8 show the – and – diagrams respectively. Fabregat & Torrejón (2000) have investigated the different photometric indices which are commonly used as horizontal axis in the observational HR diagrams, with regard to the B star region of the main sequence and they conclude on the basis of four parameters (the span of values taken by the index over the B-star range, its intrinsic photometric accuracy, the ratio between the index variation and the accuracy and how the interstellar reddening affects the index) that the most efficient way to determine reliable ages for very young clusters is isochrone fitting to the observational HR diagram. As can be easily seen, the main sequence is far better defined in the – diagram, confirming that is a much better spectral class indicator than for early type stars. We have plotted the empirical ZAMS from Balona & Shobbrook (1984) obtained from the relation that represents analytically the adopted ZAMS in the diagram. Allowing for some uncertainty in the fit to the ZAMS, we find that the best value of the dereddened distance modulus is . This value, although higher than those given by T91 and Fitzsimmons (1993), which are 13.2 and 13.4 respectively, is compatible within the errors with the latter, but is not compatible with the value given by T91. This discrepancy is due mainly to the value of reddening adopted by Fitzsimmons (1993) being nearer to our value than the value adopted by T91.
A second method of determining the distance to the cluster is by using the procedure from Balona & Shobbrook (1984) to estimate the absolute luminosities of all members from their and indexes. We find that the values derived provide rather consistent values for the distance modulus. The average is , where the uncertainty is only due to the dispersion in the estimates and does not include the uncertainties in the determination of the individual ’s.
By using this procedure, we find two stars (in addition to S3R1N4, which has been discussed above) which have absolute magnitudes which not only give values of very far from the cluster average, but are inconsistent with their spectral types. These are S4R3N2, which is about one magnitude too bright for the B2V spectral type given by Hiltner (1966) – which is perfectly consistent with the photometric indices – and S3R3N11, which is more than one magnitude too faint. Though it is unlikely finding a field B2V lying just in front of the cluster and at a similar distance, we brand S4R3N2 as a possible non-member. S3R3N11 has one of the highest reddenings measured, but it lies very close to cluster members with similar high reddening. Therefore its membership is also uncertain. Removing these two stars does not change significantly the estimate of .
The values of obtained by fitting the ZAMS and by averaging the values derived from the individual estimation of for members are rather different, but compatible within the errors (which are much larger for the second method). We prefer the first determination, not only because of its smaller intrinsic error, but also because the ’s derived are more consistent with the spectral types. The four stars with higher effective temperature studied by Rolleston et al. (1993) all have in the range 25000 – 27500 K (and these values could be an underestimate according to Rolleston et al. 1993). Assuming , these stars would all have absolute magnitudes , while taking , they have ’s between and , which correspond well with the derived spectral types between B0.2V and B0.7V (Vacca et al. 1996).
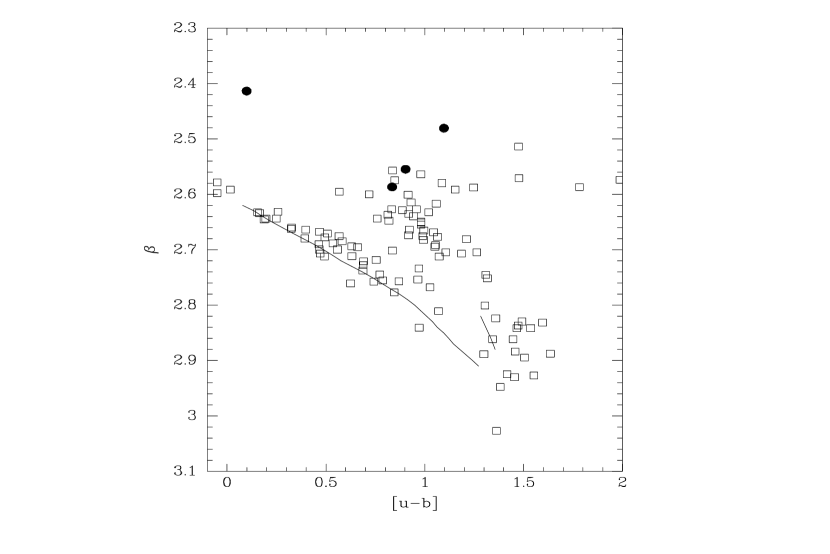
3.4 Emission-line candidates
We find several stars whose indices indicate that they could have the H line in emission. Their position in the – diagram is compatible with their being Be stars (Marco et al. 2000). These objects, together with their dereddened indices, have been listed in Table 9.
We performed spectroscopy of all emission-line candidates (except for S5001, which is too close to the brighter star S2R1N12 to allow separation unless seeing conditions are exceptional) and two other stars lying nearby in the – diagram and having indices close to the limiting , namely S4R2N14 and S2R1N16.
S4R2N15 was found to present no emission lines and a spectrum consistent with a K-type main sequence star and it is therefore not a cluster member. The spectrum of S4R2N14 shows no emission lines either, but strong H and H absorption. It is most likely an F main-sequence star and therefore not a cluster member.
The three remaining stars (S1R2N23, S2R1N16 and S2R1N26) were all found to display H in emission. Their spectra (which are presented in Fig. 9 have low signal-to-noise ratios due to their faintness and do not cover the classification region. However, comparison with the stars in the digital atlas of Jacoby et al. (1984) indicates that they are all approximately F-type stars.
The earliest spectrum is that of S1R2N23, which is close to F0. This star also displays the strongest H among the group, with an Equivalent Width (EW) of Å. This line, as well as H, probably displays inverse P-Cygni profiles, indicative of mass inflow, which are typically seen in many young stars. Also in emission is the Ca ii 8498, 8542, 8662 Å triplet. Measurements in previous studies (Hoag 1961; Cuffey 1973; Moffat & Vogt 1975; Massey et al. 1995) indicate strong variability, specially in the color.
The spectrum of S2R1N16 is that of a mid-F star and its H emission is rather weaker (EW=Å). The infrared Ca ii triplet is in absorption and there is no evidence for other strong emission lines. Measurements in previous studies indicate very strong variability.
The latest spectrum is that of S2R1N26, which is very late F or early G. Its H emission is also the weakest, with an EW=Å. There is no evidence for any other emission lines. Previous photometric measurements are consistent with little variability.
The presence of emission lines identifies all three objects as young (pre-Main Sequence) stars. They are probably massive T Tauri stars, with S1R2N23 coming within the group of Herbig AeBe stars according to the classification of Thé et al. (1994), and they are all likely members of NGC 1893. Their intrinsic luminosities must be therefore much higher than those of main-sequence stars of the same spectral type.
3.5 Previously cataloged Be stars
We also observed the two NGC 1893 stars cataloged by Massey et al. (1995) as Be stars, namely S1R2N35 and S3R1N3. Their spectra are presented in Fig. 10. Both stars display very strong emission in H and H, as well as in the upper Paschen lines (Pa14 to Pa17 are clearly seen in both stars). The O i 7773 Å and 8446 Å lines are also prominent. The yellow and red continuum is dominated by many strong permitted Fe ii emission lines, among which the complex dominated by Fe ii 5169, 5198, 5235, 5276 Å is particularly strong in S3R1N3.
The strength of the H emission line (EWÅ) and the overall emission spectrum is compatible with an extreme classical Be star, but more typical of a Herbig Be young stellar object. The photometric indices of this star indicate that this object has a spectral type close to B0. Therefore, with , it is much fainter than expected (for example, it is 2.3 mag fainter than the B0.2V star S3R1N17). This could be indicating that it is surrounded by a local nebulosity and it is indeed a pre-main-sequence Herbig Be star. Classical Be stars tend on average to be brighter than corresponds to their spectral type (Fabregat & Torrejón 1998).
The emission spectrum of S1R2N35 is still stronger, with the EW of H amounting to Å. Our blue spectrum of the source shows red-shifted emission components in H and H. The spectral type is B0 and again the star is at least one magnitude too faint for the spectral type, indicating the presence of substantial local extinction. Therefore this star is most likely a Herbig Be object as well. References in the literature indicate that this star has brightened from (Hoag 1961; Moffat & Vogt 1975) to ( Fitzsimmons 1993; Massey et al. 1995).
Schild & Romanishin (1976) list a third Be star in NGC 1983, which has been subsequently identified with S2R2N43 in the Webda database (Mermilliod 1999). However, we do not believe that this identification is correct. Massey et al. (1995) found no evidence of emission from S2R2N43. Rolleston et al. (1993) selected this star as a typical main-sequence early-B star from the photometric data of Fitzsimmons (1993) and studied its chemical composition using high-resolution spectroscopy without finding any indication of emission.
Our spectra of this star offer no evidence of emission in the whole optical range. We find a spectral type of B0.5V for S2R2N43, rather than the B1III derived by Massey et al. (1995). This spectral type is in agreement with the stellar parameters derived by Rolleston et al. (1993). Moreover, assuming that the reddening to the star is the average for the cluster, our measured implies an absolute magnitude , which is that expected for the spectral type (Vacca et al. 1996). Therefore if there is another emission line B star in the cluster, it is not S2R2N43.
4 Discussion
We find a distance modulus , moderately larger than that of previous authors. T91 give a rather lower . There are two main contributions to this discrepancy. On the one hand, our derived implies an extinction , compared to the from T91. Our determination of the reddening is based on a much larger sample of stars (but still leaving out all high-reddening members and all O-type stars). If the reddening of all member stars (including those with higher reddening, but leaving out O-type stars) is averaged, then a value , much closer to that from T91 is obtained. However, because of the spatial concentration of the highly reddened members and the obvious gap between them and the rest of the cluster in the – diagram (see Figure 6), we are confident that the lower value is a more accurate measurement of the true interstellar reddening to the cluster.
In addition, most of the discrepancy in the distance modulus estimate comes from the fact that a higher value is needed in order to fit the ZAMS to the observational data. Our data include a much larger number of members than the work by T91 and Fitzsimmons (1993). Stars in the mid- and late-B range were very scarce in previous work, allowing for a looser fit of the ZAMS. As can be seen in Figure 8, the ZAMS from Balona & Shobbrook provides a very good lower envelope to stars from B1 to late B, but lies above the earliest B-type stars. It could be argued that the ZAMS should be fit to these B0-type stars, which would mean increasing the distance modules by an extra mag. However, this would mean that all the stars later than B1 have not yet reached the ZAMS, implying an age for the cluster of less than 1 Myr, which is in contradiction with the fact that at least some of the O-type stars seem to be close to the end of the main-sequence. The weak He ii Å line in S3R2N15 has an EW very close to that considered the limit between main-sequence and giant stars (Mathys 1988), which would set the age of this star at Myr for an assumed at O5V (Vacca et al. 1996).
In any case, the presence of very massive Herbig Be stars indicates that star formation is still active in this cluster. Since stars in the mid-B range at least seem to have reached the main sequence, this should be indicating that star formation has been going on for some time in NGC 1893. Further observations are needed in order to explore the possible existence of a larger pre-main-sequence population. The observed spectral distribution of pre-MS stars in NGC 1893 is indeed unexpected, suggesting that not all the pre-MS objects in the cluster have been observed. Moreover, since at least one O-type star seems to have an age Myr, which is approximately the age assumed for the whole cluster by previous authors, good determinations of the ages of all the O stars are required in order to explore at which stage the most massive stars formed. Since massive stars are still forming, it may seem that massive stars can form both at the beginning or at end of the epoch of star formation. Knowing whether they can form at any given time will need in-depth study of the ages of all O-type stars in NGC 1893.
The identification of all emission-line objects as pre-MS stars means that there are no classical Be stars in NGC 1893. This is in agreement with the suggestion by Fabregat & Torrejón (2000) that there are no classical Be stars in clusters in which star formation is still active.
5 Conclusions
We have identified very likely members of NGC 1893 and therefore we have a sample of likely members larger than previous studies ( 24 members in T91 and 30 members in Fitzsimmons 1993) to determine the cluster astrophysical parameters.
We derive a reddening to the cluster . This value is similar to that obtained by Fitzsimmons (1993) but is incompatible with the value adopted by T91. We show that the reddening is variable across the face of the cluster and can reach much higher values than the average in some areas. If we include the highest values of individual reddenings in the calculation of the average, then our value would be rather closer to the value given by T91. We have not adopted this value, because all the high values belong to stars coming from a relatively small spatial area within the cluster, which must be affected by local extinction.
We derive a distance modulus of by fitting the ZAMS from Balona & Shobbrook (1984). We obtain a higher value than the 13.2 obtained by T91 and the 13.4 by Fitzsimmons (1993), both based on a smaller number of likely members.
Five emission-line stars are shown to be pre-main-sequence objects, extending from about B0 to very late F spectral type. This suggests that several other pre-main-sequence objects could be present in this cluster, specially at fainter magnitudes than those observed by us. Further photometric and spectroscopic work must be conducted to confirm this suggestion.
References
- Balona and Shobbrook (1984) Balona, L.A., and Shobbrook R.R. 1984, MNRAS, 211, 375
- Canterna et al. (1979) Canterna, R., Perry, C.L., and Crawford, D.L. 1979, PASP, 91, 263
- Crawford and Mander (1966) Crawford, D.L., Mander, J. 1966, AJ, 71, 114
- Crawford et al. (1970) Crawford, D.L., Glaspey, J.W., and Perry, C.L. 1970a, AJ, 75, 822
- Crawford and Barnes (1970) Crawford, D.L., and Barnes, J.V. 1970b, AJ, 75, 978
- Crawford et al. (1977) Crawford, D.L., Barnes, J.V., and Hill, G. 1977, AJ, 82, 606
- Crawford (1978) Crawford, D.L. 1978, AJ, 83, 48
- Cuffey (1973) Cuffey, J. 1973, AJ, 78, 747
- Draper (1998) Draper, P.W. 1998, Starlink User Note 139.7, R.A.L.
- Fabregat and Torrejón (1998) Fabregat, J., and Torrejón ,J.M. 1998, A&A, 332, 643
- Fabregat and Torrejón (2000) Fabregat, J., and Torrejón, J.M. 2000, A&A, 357, 451
- Fitzsimmons (1993) Fitzsimmons, A., 1993, A&AS, 99, 15
- Gronbech et al. (1976) Grønbech, B., Olsen, E.H., and Strömgren, B. 1976, A&AS, 26, 155
- Hiltner (1956) Hiltner, W.A. 1956, ApJS, 2, 389
- Hiltner (1966) Hiltner, W.A. 1966, IAU Symp.24, 373
- Hoag et al. (1961) Hoag, A.A., Johnson, H.L., Iriarte, B., Mitchell, R.J., Hallam, K.L., and Sharpless, S. 1961, Publ. U.S. Naval Obs. Sec. Ser. XVII, part VII
- Hoag and Applequist (1965) Hoag, A.A., and Applequist, L. 1965, ApJS, 12, 215
- Howarth et al. (1997) Howarth, I., Murray, J., Mills, D., and Berry, D.S. 1997, Starlink User Note 50.20, R.A.L.
- Jacoby et al. (1984) Jacoby, G.H., Hunter, D.A., and Christian, C.A. 1984, ApJS, 56, 257
- Johnson and Morgan (1955) Johnson, H.L., and Morgan, W.W. 1955, ApJ, 122, 429
- Kontizas et al. (1980) Kontizas, E., and Theodossiou, E. 1980, MNRAS, 192, 745
- Manfroid (1993) Manfroid, J. 1993, A&A, 271, 714
- Manfroid and Sterken (1987) Manfroid, J., and Sterken, C. 1987, A&A, 71, 539
- Marco et al. (2000) Marco, A., Bernabeu, G., Fabregat, J., and et al. 2000, In: Smith M., Henrichs H.F., Fabregat J. (eds.) IAU Colloq. 175, The Be Phenomenon in Early-Type Stars. ASP Conference Series, 2000, Vol. 214, 59, San Francisco
- Moffat and Vogt (1975) Moffat, A.F.J., and Vogt, N. 1975, A&AS, 20, 85
- Massey et al. (1995) Massey, P., Johnson, K.E., and DeGioia-Eastwood, K. 1995, ApJ, 454, 151
- Mathys (1988) Mathys, G. 1988, A&AS, 76, 427
- Mermilliod (1998) Mermilliod, J.C. 1998, WEBDA data base, http://obswww.unige.ch/webda/information.html
- Moffat and Vogt (1975) Moffat, A.F.J., and Vogt, N. 1975, A&AS, 20, 85
- Napiwotzki et al. (1993) Napiwotzki, R., Schönberner, and Wenske V. 1993, A&A, 268, 653
- Perry et al. (1977) Perry, C.L., Lee, P.D., and Barnes, J.V. 1978, PASP, 90, 73
- Perry et al. (1987) Perry, C.L., Olsen, E.H., and Crawford, D.L. 1987, PASP, 99, 1184
- Rolleston et al. (1993) Rolleston, W.R.J., Brown, P.J.F., Dufton, P.L., and Fitzsimmons A. 1993, A&A, 270, 107
- Schild et al. (1976) Schild, R.E, and Romanishin, W. 1976, ApJ, 204, 493
- Shobbrook (1983) Shobbrook, R.R. 1983, MNRAS, 205, 1215
- Shortridge et al. (1997) Shortridge, K., Meyerdicks, H., Currie, M., and et al. 1997, Starlink User Note 86.15, R.A.L
- Steele (1999) Steele, I.A., Negueruela, I., and Clark, J.S. 1999, A&AS, 137, 147
- Stetson (1987) Stetson, P.B. 1987, PASP, 99, 191
- Strömgren (1966) Strömgren, B. 1966, ARA&A, 4, 433
- Tapia et al. (1991) Tapia, M., Costero, R., Echevarría, J., and Roth, M. 1991, MNRAS, 253, 649 (T91)
- Thé et al. (1993) Thé, P.S., de Winter, D., and Pérez, M.R. 1993, A&AS, 104, 315
- Vacca et al. (1996) Vacca, W.D., Garmany, C.D., and Shull, J.M. 1996, ApJ, 460, 914
- Vallenari et al. (1999) Vallenari, A., Richichi, A., Carraro, G., and Girardi L. 1999, A&A, 349, 825
 |
 |
 |
 |


| Central Star | Coordinates (1950) | |
|---|---|---|
| #1 | S4R2N17 | =5h 19m 12.00s = |
| #2 | S4R1N17 | =5h 19m 23.24s = |
| #3 | S2R1N26 | =5h 19m 31.09s = |
| #4 | S3R2N15 | =5h 19m 22.63s = |
| Number | Spectral Type | |||||
|---|---|---|---|---|---|---|
| h Persei | ||||||
| 837 | 14.080 | 0.393 | 0.000 | 0.918 | 2.801 | |
| 843 | 9.320 | 0.277 | -0.050 | 0.166 | B1.5V | |
| 867 | 10.510 | 0.393 | 0.161 | 0.375 | 2.613 | |
| 869 | 2.700 | |||||
| 935 | 14.020 | 0.362 | -0.004 | 0.854 | 2.802 | |
| 950 | 11.290 | 0.318 | -0.048 | 0.214 | 2.642 | B2V |
| 960 | 2.767 | |||||
| 978 | 10.590 | 0.305 | -0.039 | 0.177 | 2.643 | B2V - B1.5V |
| 982 | 2.796 | |||||
| 1015 | 10.570 | 0.225 | 0.033 | 0.741 | B8V | |
| 1078 | 9.750 | 0.316 | -0.065 | 0.167 | 2.610 | B1V - B1Vn |
| 1181 | 12.650 | 0.372 | -0.034 | 0.379 | 2.718 | |
| Persei | ||||||
| 2133 | 2.676 | |||||
| 2139 | 11.380 | 0.255 | -0.033 | 0.196 | 2.649 | B2V |
| 2147 | 14.340 | 0.406 | -0.050 | 1.002 | 2.863 | |
| 2167 | 13.360 | 0.352 | -0.056 | 0.627 | 2.752 | |
| 2185 | 10.920 | 0.283 | -0.049 | 0.406 | 2.700 | B2Vn |
| 2196 | 11.570 | 0.250 | -0.006 | 0.210 | 2.670 | B1.5V |
| 2200 | 2.721 | |||||
| 2232 | 11.110 | 0.292 | -0.105 | 0.207 | 2.651 | B2V |
| 2235 | 9.360 | 0.316 | -0.088 | 0.150 | 2.611 | B1V |
| 2251 | 11.560 | 0.302 | -0.042 | 0.349 | 2.709 | B3V |
| NGC 2169 | ||||||
| 11 | 10.600 | 0.084 | 0.065 | 0.541 | 2.698 | B8V |
| 15 | 11.080 | 0.130 | 0.109 | 0.944 | 2.864 | B9.5V |
| 18 | 11.800 | 0.115 | 0.105 | 0.912 | 2.872 | B9.5V |
| NGC 6910 | ||||||
| 7 | 10.360 | 0.670 | -0.160 | 0.110 | 2.612 | B0.5V |
| 11 | 10.900 | 0.770 | 0.420 | 0.430 | 2.555 | |
| 13 | 11.720 | 0.660 | -0.140 | 0.220 | 2.647 | B1V |
| 14 | 11.730 | 0.590 | -0.100 | 0.220 | 2.652 | B1V |
| 15 | 12.220 | 0.590 | -0.110 | 0.330 | 2.679 | |
| 17 | 12.660 | 0.670 | -0.120 | 0.310 | 2.659 | |
| 18 | 12.810 | 0.750 | -0.140 | 0.290 | 2.680 | |
| 19 | 12.920 | 0.640 | -0.120 | 0.380 | 2.662 | |
| 20 | 12.980 | 0.610 | -0.130 | 0.420 | 2.692 | |
| NGC 1039 | ||||||
| 92 | 11.960 | 0.303 | 0.138 | 0.481 | 2.678 | |
| 96 | 9.740 | 0.086 | 0.176 | 0.973 | 2.890 | |
| 97 | 11.820 | 0.144 | 0.198 | 0.900 | 2.855 | |
| 102 | 10.760 | 0.151 | 0.194 | 0.894 | 2.848 | |
| 105 | 11.220 | 0.176 | 0.204 | 0.796 | 2.817 | |
| 109 | 10.030 | 0.066 | 0.152 | 1.013 | 2.916 | |
| 111 | 9.950 | 0.055 | 0.163 | 1.021 | 2.908 | |
| Star | |||||||||||||||
|---|---|---|---|---|---|---|---|---|---|---|---|---|---|---|---|
| h Persei | |||||||||||||||
| 869 | - | - | - | - | 2.724 | - | - | - | - | - | - | - | - | - | -024 |
| 837 | 14.095 | 0.411 | -0.031 | 0.907 | 2.789 | 3 | 006 | 009 | 024 | 024 | -016 | -019 | 032 | 011 | 012 |
| 843 | 9.330 | 0.319 | -0.151 | 0.240 | - | 1 | - | - | - | - | -010 | -042 | 101 | -074 | - |
| 867 | 10.572 | 0.376 | 0.177 | 0.379 | 2.666 | 5 | 006 | 008 | 013 | 025 | -063 | 016 | -015 | -005 | -053 |
| 935 | 14.051 | 0.411 | -0.076 | 0.856 | 2.781 | 6 | 018 | 007 | 018 | 038 | -031 | -049 | 073 | -003 | 021 |
| 950 | 11.297 | 0.337 | -0.079 | 0.221 | 2.630 | 1 | - | - | - | - | -007 | -019 | 031 | -007 | 012 |
| 960 | - | - | - | - | 2.727 | - | - | - | - | - | - | - | - | - | 040 |
| 978 | 10.646 | 0.328 | -0.070 | 0.194 | 2.634 | 5 | 016 | 013 | 016 | 023 | -056 | -023 | 031 | -017 | 009 |
| 982 | - | - | - | - | 2.779 | - | - | - | - | - | - | - | - | - | 017 |
| 1015 | 10.573 | 0.223 | 0.029 | 0.677 | - | 2 | 037 | 023 | 006 | 030 | -003 | 003 | 005 | 064 | - |
| 1078 | 9.775 | 0.317 | -0.043 | 0.138 | 2.611 | 3 | 008 | 021 | 042 | 036 | -025 | -002 | -021 | 030 | -001 |
| 1181 | 12.655 | 0.352 | -0.008 | 0.338 | 2.703 | 6 | 022 | 022 | 044 | 030 | -006 | 020 | -025 | 041 | 015 |
| Persei | |||||||||||||||
| 2133 | - | - | - | - | 2.658 | - | - | - | - | - | - | - | - | - | 018 |
| 2139 | 11.351 | 0.298 | -0.097 | 0.235 | 2.641 | 2 | 011 | 024 | 030 | 007 | 029 | -043 | 064 | -039 | 008 |
| 2147 | 14.359 | 0.392 | -0.083 | 1.022 | 2.783 | 5 | 023 | 034 | 051 | 051 | -019 | 013 | 033 | -020 | 080 |
| 2167 | 13.364 | 0.347 | -0.080 | 0.616 | 2.733 | 6 | 012 | 008 | 012 | 024 | -004 | 005 | 025 | 011 | 019 |
| 2185 | 10.926 | 0.275 | -0.018 | 0.412 | 2.688 | 3 | 008 | 013 | 038 | 044 | -006 | 008 | -031 | -006 | 012 |
| 2196 | 11.549 | 0.304 | -0.066 | 0.246 | 2.632 | 6 | 012 | 013 | 023 | 023 | 021 | -052 | 056 | -034 | 038 |
| 2200 | - | - | - | - | 2.707 | - | - | - | - | - | - | - | - | - | 014 |
| 2232 | 11.052 | 0.238 | -0.029 | 0.177 | 2.639 | 4 | 013 | 013 | 041 | 035 | 058 | 054 | -077 | 030 | 012 |
| 2235 | 9.365 | 0.311 | -0.071 | 0.131 | 2.575 | 3 | 012 | 015 | 046 | 039 | -005 | 005 | -016 | 018 | 036 |
| 2251 | 11.563 | 0.297 | -0.028 | 0.367 | 2.689 | 6 | 009 | 011 | 027 | 030 | -004 | 004 | -013 | -018 | 020 |
| NGC 2169 | |||||||||||||||
| 11 | 10.538 | 0.076 | 0.061 | 0.545 | 2.719 | 1 | - | - | - | - | 062 | 008 | 004 | -004 | -021 |
| 15 | 11.023 | 0.122 | 0.092 | 0.939 | 2.856 | 1 | - | - | - | - | 057 | 008 | 017 | 005 | 008 |
| 18 | 11.733 | 0.053 | 0.260 | 0.813 | 2.883 | 1 | - | - | - | - | 067 | 062 | -155 | 099 | -011 |
| NGC 6910 | |||||||||||||||
| 7 | 10.320 | 0.667 | -0.150 | 0.092 | 2.652 | 2 | 011 | 004 | 012 | 016 | 041 | 003 | -011 | 018 | -040 |
| 11 | - | - | - | - | 2.639 | - | - | - | - | - | - | - | - | - | -084 |
| 13 | 11.681 | 0.619 | -0.082 | 0.211 | 2.661 | 2 | 004 | 023 | 038 | 004 | 039 | 041 | -058 | 009 | -014 |
| 14 | 11.730 | 0.569 | -0.053 | 0.201 | 2.678 | 2 | 004 | 028 | 040 | 018 | 001 | 021 | -048 | 019 | -026 |
| 15 | 12.193 | 0.609 | -0.134 | 0.359 | 2.698 | 2 | 007 | 006 | 014 | 002 | 027 | -019 | 024 | -029 | -019 |
| 17 | 12.635 | 0.700 | -0.149 | 0.294 | 2.688 | 2 | 008 | 010 | 025 | 040 | 025 | -030 | 029 | 017 | -029 |
| 18 | 12.816 | 0.755 | -0.132 | 0.296 | 2.705 | 2 | 014 | 004 | 006 | 048 | -006 | -005 | -009 | -006 | -025 |
| 19 | 12.897 | 0.610 | -0.065 | 0.402 | 2.709 | 2 | 025 | 035 | 037 | 047 | 023 | 031 | -056 | -022 | -047 |
| 20 | 12.920 | 0.619 | -0.118 | 0.446 | 2.730 | 2 | 016 | 001 | 019 | 006 | 060 | -009 | -013 | -026 | -038 |
| NGC 1039 | |||||||||||||||
| 92 | 11.928 | 0.282 | 0.150 | 0.520 | 2.709 | 1 | - | - | - | - | 032 | 021 | -012 | -039 | -031 |
| 96 | 9.703 | 0.063 | 0.219 | 0.976 | 2.887 | 1 | - | - | - | - | 037 | 023 | -043 | -003 | 003 |
| 97 | 11.782 | 0.129 | 0.215 | 0.934 | 2.838 | 1 | - | - | - | - | 038 | 015 | -017 | -034 | 017 |
| 102 | 10.724 | 0.150 | 0.193 | 0.893 | 2.851 | 1 | - | - | - | - | 036 | 001 | 001 | 001 | -003 |
| 105 | 11.166 | 0.167 | 0.232 | 0.971 | 2.832 | 1 | - | - | - | - | 054 | 009 | 028 | -175 | -015 |
| 109 | 10.034 | 0.040 | 0.178 | 1.018 | 2.960 | 1 | - | - | - | - | -004 | 026 | -026 | -005 | -044 |
| 111 | 9.900 | 0.025 | 0.249 | 0.964 | 2.927 | 1 | - | - | - | - | 050 | 030 | -086 | 057 | -019 |
| m(V) | m(by) | m(m1) | m(c1) | m() |
|---|---|---|---|---|
| Star | Observation Date(s) | Resolution |
|---|---|---|
| S1R2N23 | 3/2 | Å/mm |
| S1R2N35 | 3/2 | Å/mm, Å/mm |
| S2R1N16 | 3/2 | Å/mm |
| S2R1N18 | 4/2 | Å/mm |
| S2R1N26 | 3/2, 6/2 | Å/mm |
| S2R2N43 | 3/2, 4/2 | Å/mm, Å/mm |
| S3R1N3 | 3/2 | Å/mm |
| S3R1N16 | 4/2 | Å/mm |
| S3R1N17 | 4/2 | Å/mm |
| S3R2N15 | 4/2 | Å/mm |
| S4R2N14 | 3/2 | Å/mm |
| S4R2N15 | 3/2 | Å/mm |
| Star | Frame | X Position | Y Position | V | by | m1 | c1 | Nuvby | Nβ | |
|---|---|---|---|---|---|---|---|---|---|---|
| S1R1N2 | #2 | 745.8 | 783.4 | - | - | - | - | 2.511 | - | 1 |
| S1R1N4 | #2 | 799.5 | 818.9 | 15.707 | 0.343 | 0.127 | 0.977 | 2.948 | 2 | 2 |
| S1R1N5 | #2 | 831.8 | 854.8 | - | - | - | - | 2.560 | - | 1 |
| S1R1N7 | #3 | 678.5 | 70.1 | 14.653 | 0.207 | 0.187 | 0.500 | 2.754 | 2 | 2 |
| S1R1N8 | #3 | 699.0 | 114.2 | - | - | - | - | 2.891 | - | 1 |
| S1R1N9 | #3 | 715.8 | 131.2 | 14.946 | 0.540 | 0.207 | 0.267 | 2.636 | 2 | 2 |
| S1R1N10 | #3 | 876.5 | 43.9 | 14.604 | 0.280 | 0.033 | 0.583 | 2.745 | 1 | 1 |
| S1R1N18 | #2 | 856.6 | 694.4 | 14.469 | 0.366 | 0.223 | 0.413 | 2.633 | 1 | 1 |
| S1R1N19 | #2 | 760.6 | 642.0 | 11.100 | 0.724 | 0.607 | 0.249 | 2.587 | 1 | 1 |
| S1R2N1 | #2 | 820.3 | 51.7 | 14.224 | 0.278 | 0.094 | 0.377 | 2.738 | 1 | 1 |
| S1R2N2 | #2 | 837.3 | 60.2 | 13.744 | 0.300 | 0.228 | 0.728 | 2.752 | 1 | 1 |
| S1R2N4 | #2 | 977.5 | 44.2 | 14.074 | 0.421 | 0.118 | 1.115 | 2.842 | 1 | 1 |
| S1R2N6 | #2 | 835.0 | 145.8 | 15.214 | 0.313 | 0.072 | 0.788 | 2.811 | 1 | 1 |
| S1R2N19 | #2 | 903.4 | 267.7 | 14.020 | 0.418 | 0.256 | 0.900 | 2.832 | 1 | 1 |
| S1R2N20 | #2 | 964.6 | 279.9 | 13.330 | 0.356 | 0.068 | 0.175 | 2.668 | 1 | 1 |
| S1R2N21 | #2 | 996.3 | 224.2 | - | - | - | - | 2.621 | - | 1 |
| S1R2N22 | #2 | 892.7 | 417.7 | 14.183 | 0.361 | 0.183 | 0.520 | 2.669 | 1 | 1 |
| S1R2N23 | #2 | 923.6 | 386.0 | 15.344 | 0.655 | 0.256 | 0.297 | 2.481 | 1 | 1 |
| S1R2N25 | #2 | 1013. | 462.9 | 15.031 | 0.398 | 0.262 | 0.356 | 2.692 | 1 | 1 |
| S2R1N1 | #3 | 933.5 | 182.2 | 14.257 | 0.272 | 0.091 | 0.724 | 2.768 | 1 | 1 |
| S2R1N2 | #3 | 872.2 | 206.2 | 12.148 | 0.199 | 0.092 | 0.055 | 2.660 | 1 | 1 |
| S2R1N3 | #3 | 844.4 | 230.7 | 14.526 | 0.267 | 0.060 | 0.633 | 2.757 | 1 | 1 |
| S2R1N4 | #3 | 872.5 | 167.0 | 15.737 | 0.589 | 0.127 | 0.560 | 2.713 | 1 | 1 |
| S2R1N7 | #3 | 727.8 | 190.3 | 13.441 | 0.182 | 0.145 | 0.097 | 2.700 | 2 | 2 |
| S2R1N9 | #3 | 751.5 | 272.1 | 14.404 | 0.342 | 0.139 | 1.064 | 2.830 | 1 | 1 |
| S2R1N11 | #3 | 729.6 | 342.7 | 15.868 | 0.467 | 0.174 | 0.658 | 2.681 | 1 | 1 |
| S2R1N12 | #3 | 854.0 | 316.7 | 12.704 | 0.234 | 0.115 | 0.225 | 2.700 | 1 | 1 |
| S2R1N15 | #3 | 614.3 | 393.1 | 14.199 | 0.193 | 0.134 | 0.336 | 2.728 | 1 | 1 |
| S2R1N16 | #3 | 608.4 | 358.8 | 15.556 | 0.793 | -0.041 | 0.568 | 2.587 | 1 | 1 |
| S2R1N18 | #3 | 550.8 | 161.2 | 11.193 | 0.161 | 0.116 | -0.054 | 2.644 | 2 | 2 |
| S2R1N19 | #3 | 518.7 | 179.4 | 15.007 | 0.572 | 0.119 | 0.616 | 2.705 | 2 | 2 |
| S2R1N23 | #3 | 540.8 | 374.2 | 13.705 | 0.251 | 0.055 | 0.362 | 2.685 | 1 | 1 |
| S2R1N24 | #3 | 556.2 | 400.3 | 12.722 | 0.280 | 0.037 | 0.274 | 2.707 | 1 | 1 |
| S2R1N25 | #3 | 466.4 | 480.8 | 13.048 | 0.233 | 0.049 | 0.123 | 2.663 | 1 | 1 |
| S2R1N26 | #3 | 503.4 | 502.0 | 15.386 | 0.824 | 0.066 | 0.408 | 2.555 | 1 | 1 |
| S2R1N27 | #3 | 557.0 | 514.4 | 15.059 | 0.589 | 0.252 | 0.391 | 2.592 | 2 | 2 |
| S2R1N28 | #3 | 556.6 | 565.8 | 15.083 | 0.477 | 0.121 | 0.308 | 2.644 | 2 | 2 |
| S2R1N31 | #3 | 517.1 | 626.0 | 14.439 | 0.265 | 0.153 | 1.024 | 2.862 | 2 | 2 |
| S2R2N20 | #3 | 900.0 | 670.5 | 13.171 | 0.209 | 0.114 | 0.173 | 2.713 | 1 | 1 |
| S2R2N25 | #3 | 935.2 | 725.7 | 15.403 | 0.257 | 0.177 | 0.832 | 2.889 | 1 | 1 |
| S2R2N35 | #3 | 742.2 | 1002.1 | 14.860 | 0.383 | 0.275 | 0.274 | 2.683 | 1 | 1 |
| S2R2N40 | #4 | 745.9 | 306.7 | 13.826 | 0.322 | 0.014 | 0.490 | 2.696 | 3 | 3 |
| S2R2N41 | #3 | 714.7 | 768.4 | 11.995 | 0.163 | 0.077 | -0.030 | 2.656 | 3 | 3 |
| S2R2N42 | #3 | 672.0 | 825.7 | 12.383 | 0.186 | 0.092 | 0.128 | 2.680 | 3 | 3 |
| S2R2N43 | #3 | 659.1 | 854.0 | 11.465 | 0.167 | 0.068 | -0.054 | 2.633 | 3 | 3 |
| S2R2N45 | #4 | 840.0 | 432.7 | 14.483 | 0.329 | 0.166 | 0.981 | 2.884 | 2 | 2 |
| S2R2N46 | #4 | 778.1 | 534.2 | 12.514 | 0.525 | 0.112 | 0.461 | 2.601 | 2 | 2 |
| S2R3N59 | #4 | 773.6 | 824.1 | 15.251 | 0.396 | 0.085 | 1.073 | 2.925 | 1 | 1 |
| S3R1N1 | #3 | 387.5 | 614.5 | 12.269 | 0.258 | -0.004 | 0.151 | 2.632 | 3 | 3 |
| S3R1N2 | #3 | 355.5 | 554.5 | 13.664 | 0.246 | 0.040 | 0.348 | 2.689 | 3 | 3 |
| S3R1N3 | #3 | 305.8 | 488.8 | 13.612 | 0.603 | -0.161 | 0.156 | 2.414 | 1 | 1 |
| S3R1N4 | #3 | 422.6 | 510.5 | 13.948 | 0.284 | 0.060 | 0.323 | 2.596 | 3 | 3 |
| S3R1N6 | #3 | 424.5 | 440.5 | 12.485 | 0.293 | 0.012 | 0.341 | 2.678 | 1 | 1 |
| S3R1N8 | #3 | 425.1 | 370.7 | 13.738 | 0.284 | 0.028 | 0.573 | 2.719 | 1 | 1 |
| S3R1N9 | #3 | 221.7 | 552.0 | - | - | - | - | 2.644 | - | 1 |
| S3R1N12 | #3 | 147.8 | 339.0 | 12.472 | 0.373 | 0.013 | 0.780 | 2.734 | 1 | 1 |
| S3R1N13 | #3 | 151.3 | 243.4 | 13.151 | 0.425 | -0.059 | 0.673 | 2.758 | 1 | 1 |
| S3R1N16 | #3 | 340.5 | 242.3 | 10.273 | 0.257 | -0.052 | -0.060 | 2.598 | 1 | 1 |
| S3R1N17 | #3 | 369.5 | 211.5 | 11.339 | 0.213 | 0.077 | -0.083 | 2.634 | 2 | 2 |
| S3R2N1 | #4 | 681.2 | 506.1 | 10.774 | 0.148 | 0.168 | 1.072 | 2.837 | 3 | 3 |
| S3R2N2 | #4 | 700.4 | 322.4 | 12.579 | 0.234 | 0.047 | 0.370 | 2.676 | 3 | 3 |
| S3R2N4 | #4 | 631.4 | 372.6 | 13.530 | 0.282 | 0.020 | 0.466 | 2.694 | 3 | 3 |
| S3R2N5 | #4 | 536.2 | 366.4 | 14.420 | 0.395 | -0.003 | 0.463 | 2.712 | 2 | 2 |
| S3R2N6 | #3 | 435.0 | 659.4 | 14.756 | 0.604 | 0.052 | 0.894 | 2.705 | 2 | 2 |
| S3R2N7 | #3 | 443.7 | 646.0 | 14.336 | 0.428 | 0.026 | 1.123 | 3.027 | 2 | 2 |
| S3R2N8 | #4 | 484.3 | 443.6 | 15.049 | 0.490 | -0.037 | 0.566 | 3.348 | 2 | 2 |
| S3R2N9 | #4 | 516.0 | 446.0 | 15.245 | 0.493 | -0.033 | 0.637 | 2.756 | 2 | 2 |
| S3R2N13 | #4 | 420.1 | 616.5 | 15.286 | 0.450 | -0.095 | 0.837 | 2.777 | 1 | 1 |
| S3R2N15 | #4 | 469.5 | 506.1 | 10.161 | 0.420 | -0.073 | -0.023 | 2.592 | 3 | 3 |
| S3R2N16 | #4 | 338.5 | 509.6 | 14.738 | 0.624 | -0.001 | 1.279 | 2.927 | 2 | 2 |
| S3R2N17 | #4 | 374.1 | 468.6 | 15.063 | 0.481 | 0.153 | 0.404 | 2.664 | 2 | 2 |
| S3R2N18 | #4 | 364.2 | 341.9 | 12.907 | 0.404 | -0.071 | 0.152 | 2.646 | 3 | 3 |
| S3R2N26 | #3 | 66.2 | 570.1 | 13.456 | 0.321 | 0.099 | 0.965 | 2.801 | 3 | 3 |
| S3R2N27 | #4 | 282.9 | 50.8 | 14.204 | 0.371 | 0.065 | 0.526 | 2.648 | 1 | 1 |
| S3R3N7 | #4 | 505.9 | 867.2 | 13.293 | 0.419 | 0.154 | 0.559 | 2.695 | 2 | 2 |
| S3R3N11 | #4 | 532.4 | 682.9 | 14.502 | 0.474 | -0.070 | 0.438 | 2.671 | 1 | 1 |
| S3R3N12 | #4 | 242.0 | 726.8 | 14.383 | 0.551 | 0.050 | 0.376 | 2.600 | 1 | 1 |
| S3R3N13 | #4 | 211.8 | 832.9 | 15.177 | 0.540 | -0.119 | 0.625 | 2.761 | 1 | 1 |
| S4R1N1 | #2 | 555.1 | 866.2 | 14.712 | 0.519 | 0.173 | 0.312 | 2.629 | 2 | 2 |
| S4R1N4 | #2 | 478.1 | 772.8 | 13.956 | 0.345 | 0.231 | 0.450 | 2.677 | 1 | 1 |
| S4R1N8 | #2 | 461.5 | 649.8 | 13.184 | 0.386 | 0.163 | 0.422 | 2.674 | 3 | 3 |
| S4R1N10 | #2 | 559.0 | 608.7 | 14.905 | 0.265 | 0.109 | 0.637 | 2.841 | 2 | 2 |
| S4R1N11 | #2 | 588.8 | 608.5 | 14.793 | 0.398 | 0.230 | 0.346 | 2.650 | 1 | 1 |
| S4R1N13 | #2 | 714.7 | 613.4 | 14.388 | 0.420 | 0.243 | 0.387 | 2.617 | 1 | 1 |
| S4R1N16 | #2 | 337.2 | 595.2 | 15.519 | 0.285 | 0.141 | 0.936 | 2.862 | 2 | 2 |
| S4R1N17 | #2 | 480.9 | 478.2 | 11.780 | 0.225 | 0.233 | 0.794 | 2.824 | 3 | 3 |
| S4R2N3 | #1 | 226.5 | 950.8 | 14.475 | 0.249 | 0.262 | 0.820 | 2.930 | 1 | 1 |
| S4R2N7 | #1 | 373.9 | 951.7 | 14.239 | 0.424 | 0.111 | 1.226 | 2.888 | 1 | 1 |
| S4R2N9 | #2 | 97.7 | 747.9 | 14.985 | 0.488 | 0.200 | 0.375 | 2.676 | 2 | 2 |
| S4R2N12 | #2 | 106.4 | 494.5 | 15.333 | 0.504 | 0.032 | 0.550 | 2.702 | 2 | 2 |
| S4R2N14 | #1 | 430.3 | 572.3 | 15.482 | 0.518 | 0.123 | 0.374 | 2.575 | 1 | 1 |
| S4R2N15 | #1 | 381.2 | 549.0 | 14.488 | 0.592 | 0.447 | 0.320 | 2.514 | 1 | 1 |
| S4R2N17 | #1 | 500.0 | 500.0 | 9.036 | 0.266 | -0.022 | -0.123 | 2.579 | 1 | 1 |
| S4R2N18 | #2 | 247.7 | 506.7 | 12.297 | 0.253 | 0.028 | 0.230 | 2.664 | 3 | 3 |
| S4R2N19 | #2 | 337.0 | 452.5 | 12.284 | 0.161 | 0.204 | 1.026 | 2.895 | 3 | 3 |
| S4R2N20 | #2 | 403.7 | 424.0 | 14.606 | 0.448 | 0.188 | 0.384 | 2.627 | 2 | 2 |
| S4R2N22 | #2 | 579.6 | 340.6 | 13.856 | 0.342 | 0.192 | 0.652 | 2.707 | 3 | 3 |
| S4R2N23 | #2 | 289.3 | 333.1 | 15.613 | 0.488 | 0.065 | 0.468 | 2.637 | 2 | 2 |
| S4R2N24 | #2 | 466.2 | 256.1 | 15.820 | 0.424 | 0.213 | 0.220 | 2.627 | 1 | 1 |
| S4R2N27 | #2 | 659.7 | 183.4 | 13.702 | 0.401 | 0.208 | 0.351 | 2.640 | 1 | 1 |
| S4R2N28 | #2 | 716.8 | 204.1 | 13.286 | 1.022 | 0.583 | 0.372 | 2.574 | 1 | 1 |
| S4R2N29 | #1 | 598.3 | 380.9 | 14.490 | 0.591 | 0.408 | 0.401 | 2.571 | 2 | 2 |
| S4R2N30 | #1 | 647.2 | 334.4 | 13.645 | 0.291 | 0.166 | 0.849 | 2.746 | 3 | 3 |
| S4R2N32 | #1 | 826.7 | 364.7 | 14.255 | 0.411 | 0.168 | 0.464 | 2.655 | 2 | 2 |
| S4R2N33 | #1 | 783.0 | 286.6 | 14.646 | 0.291 | 0.181 | 0.976 | 2.842 | 1 | 1 |
| S4R2N34 | #1 | 818.0 | 285.3 | 14.037 | 0.386 | 0.182 | 0.461 | 2.666 | 2 | 2 |
| S4R3N2 | #1 | 81.6 | 971.3 | 11.728 | 0.192 | 0.076 | 0.229 | 2.690 | 2 | 2 |
| S4R3N20 | #1 | 323.2 | 466.0 | 13.174 | 0.555 | 0.320 | 0.363 | 2.588 | 2 | 2 |
| S4R3N23 | #1 | 171.4 | 158.0 | 14.544 | 0.844 | 0.177 | 0.362 | 2.580 | 1 | 1 |
| S4R3N24 | #1 | 134.2 | 108.6 | 14.695 | 0.509 | 0.191 | 0.374 | 2.564 | 1 | 1 |
| S4R3N29 | #1 | 602.6 | 138.9 | 12.782 | 0.493 | 0.140 | 0.434 | 2.615 | 2 | 2 |
| S4R3N32 | #1 | 654.2 | 297.3 | - | - | - | - | 2.690 | - | 1 |
| S5000 | #3 | 426.2 | 361.6 | 14.149 | 0.270 | 0.036 | 0.499 | 2.721 | 1 | 1 |
| S5001 | #3 | 859.1 | 309.1 | 15.116 | 0.565 | 0.157 | 0.274 | 2.557 | 1 | 1 |
| Star | [c1] | [m1] | [ub] | Teff | ||
|---|---|---|---|---|---|---|
| OType | ||||||
| S3R1N16 | O8V(f)1,2, O7V((f))3,5 | |||||
| S4R2N17 | O6V(f)1, O54 | |||||
| S3R2N15 | O82, O63, O5V(f)5 | |||||
| BType | ||||||
| S2R2N43 | 0.121 | 0.155 | 23710 | B1 | B1III1, B0.5V5 | |
| S3R1N17 | 0.145 | 0.164 | 23436 | B1 | B0.5V1, B0.2V5 | |
| S3R2N18 | 0.071 | 0.058 | 0.188 | 22736 | B1.5 | B1.5V1 |
| S2R2N41 | 0.129 | 0.196 | 22512 | B1.5 | B1.5V1,5 | |
| S2R1N18 | 0.168 | 0.249 | 21140 | B2 | B1V1, B0.7V5 | |
| S3R1N1 | 0.099 | 0.079 | 0.257 | 20948 | B2 | B2.5V1, B2V5 |
| S2R1N25 | 0.076 | 0.124 | 0.324 | 19476 | B2 | |
| S2R1N2 | 0.015 | 0.156 | 0.327 | 19415 | B2 | B1V5 |
| S2R2N42 | 0.091 | 0.152 | 0.394 | 18156 | B3 | |
| S4R2N18 | 0.179 | 0.109 | 0.397 | 18104 | B3 | |
| S4R3N2 | 0.191 | 0.137 | 0.465 | 16999 | B4 | B2V3 |
| S2R1N7 | 0.061 | 0.203 | 0.467 | 16969 | B4 | |
| S1R2N20 | 0.104 | 0.182 | 0.468 | 16954 | B4 | |
| S2R1N24 | 0.218 | 0.127 | 0.471 | 16909 | B4 | |
| S2R2N20 | 0.131 | 0.181 | 0.493 | 16585 | B4 | |
| S3R1N6 | 0.282 | 0.106 | 0.494 | 16571 | B4 | |
| S3R3N11 | 0.343 | 0.082 | 0.507 | 16387 | B4 | |
| S3R1N2 | 0.299 | 0.119 | 0.536 | 15991 | B5 | |
| S2R1N12 | 0.178 | 0.190 | 0.558 | 15704 | B5 | |
| S3R2N2 | 0.323 | 0.122 | 0.567 | 15590 | B5 | |
| S2R1N23 | 0.312 | 0.135 | 0.582 | 15404 | B5 | |
| S3R2N4 | 0.410 | 0.110 | 0.630 | 14840 | B6 | |
| S3R2N5 | 0.384 | 0.123 | 0.631 | 14829 | B6 | |
| S2R2N40 | 0.426 | 0.117 | 0.660 | 14510 | B6 | |
| S1R2N1 | 0.321 | 0.183 | 0.687 | 14226 | B6 | |
| S2R1N15 | 0.297 | 0.196 | 0.689 | 14206 | B6 | |
| S5000 | 0.445 | 0.122 | 0.690 | 14195 | B7 | |
| S3R1N13 | 0.588 | 0.077 | 0.742 | 13684 | B8 | |
| S3R1N8 | 0.516 | 0.119 | 0.754 | 13572 | B8 | |
| S1R1N10 | 0.527 | 0.123 | 0.772 | 13408 | B8 | |
| S3R2N9 | 0.538 | 0.125 | 0.788 | 13265 | B8 | |
| S3R2N13 | 0.747 | 0.049 | 0.845 | 13784 | B9 | |
| S2R1N3 | 0.580 | 0.145 | 0.870 | 12585 | B9 | |
| S1R1N7 | 0.459 | 0.253 | 0.965 | 11888 | B9 | |
| S4R1N10 | 0.584 | 0.194 | 0.972 | 11840 | B9 | |
| S2R1N1 | 0.670 | 0.178 | 1.026 | 11485 | B9 | |
| S1R2N6 | 0.725 | 0.172 | 1.070 | 11213 | B9 | |
| AType | ||||||
| S2R2N25 | 0.781 | 0.259 | 1.299 | 10007 | A0 | |
| S4R1N16 | 0.879 | 0.232 | 1.343 | 9809 | A0 | |
| S1R1N4 | 0.908 | 0.237 | 1.382 | 9641 | A1 | |
| S2R3N59 | 0.994 | 0.212 | 1.417 | 9496 | A1 | |
References. — 1Massey et al. (1995); 2Hoag et al. (1965); 3Hiltner (1966); 4Hiltner (1956); 5This work
| Star | E(by) | V0 | (by)0 | c0 | MV() | V0MV() |
|---|---|---|---|---|---|---|
| S1R1N4 | 0.371 | 14.287 | 0.013 | 0.911 | 1.674 | 12.613 |
| S1R1N7 | 0.280 | 13.233 | -0.123 | 0.434 | -0.216 | 13.449 |
| S1R1N10 | 0.346 | 13.184 | -0.050 | 0.517 | -0.305 | 13.489 |
| S1R2N1 | 0.365 | 12.804 | -0.052 | 0.311 | -0.529 | 13.333 |
| S1R2N6 | 0.360 | 13.794 | -0.017 | 0.722 | 0.475 | 13.319 |
| S1R2N20 | 0.464 | 11.911 | 0.026 | 0.109 | -1.874 | 13.784 |
| S2R1N1 | 0.324 | 12.837 | -0.058 | 0.658 | -0.030 | 12.867 |
| S2R1N2 | 0.316 | 10.728 | -0.131 | -0.011 | -2.478 | 13.206 |
| S2R1N3 | 0.328 | 13.106 | -0.063 | 0.567 | -0.148 | 13.254 |
| S2R1N7 | 0.294 | 12.021 | -0.148 | 0.031 | -1.757 | 13.778 |
| S2R1N12 | 0.335 | 11.284 | -0.096 | 0.159 | -1.292 | 12.576 |
| S2R1N15 | 0.282 | 12.779 | -0.137 | 0.270 | -0.711 | 13.490 |
| S2R1N18 | 0.288 | 9.773 | -0.169 | -0.120 | -3.389 | 13.162 |
| S2R1N23 | 0.338 | 12.285 | -0.079 | 0.296 | -1.276 | 13.561 |
| S2R1N24 | 0.377 | 11.302 | -0.050 | 0.208 | -1.085 | 12.387 |
| S2R1N25 | 0.344 | 11.628 | -0.097 | 0.057 | -2.127 | 13.755 |
| S2R2N20 | 0.314 | 11.751 | -0.121 | 0.107 | -1.304 | 13.055 |
| S2R2N25 | 0.298 | 13.983 | -0.073 | 0.766 | 1.213 | 12.770 |
| S2R2N40 | 0.398 | 12.406 | -0.008 | 0.424 | -1.057 | 13.463 |
| S2R2N41 | 0.287 | 10.575 | -0.167 | -0.096 | -3.034 | 13.609 |
| S2R2N42 | 0.295 | 10.963 | -0.144 | 0.062 | -1.869 | 12.832 |
| S2R2N43 | 0.294 | 10.045 | -0.163 | -0.120 | -3.593 | 13.638 |
| S2R3N59 | 0.410 | 13.831 | 0.066 | 1.007 | 1.479 | 12.352 |
| S3R1N1 | 0.366 | 10.849 | -0.072 | 0.085 | -2.585 | 13.434 |
| S3R1N2 | 0.335 | 12.244 | -0.084 | 0.282 | -1.223 | 13.467 |
| S3R1N4 | 0.376 | 12.528 | -0.046 | 0.257 | -3.771 | 16.299 |
| S3R1N6 | 0.383 | 11.065 | -0.037 | 0.275 | -1.412 | 12.477 |
| S3R1N8 | 0.351 | 12.318 | -0.046 | 0.507 | -0.690 | 13.008 |
| S3R1N16 | 0.386 | 8.854 | -0.073 | -0.126 | -4.405 | 13.258 |
| S3R1N17 | 0.344 | 9.919 | -0.117 | -0.149 | -3.767 | 13.686 |
| S3R2N2 | 0.320 | 11.159 | -0.096 | 0.304 | -1.429 | 12.588 |
| S3R2N4 | 0.360 | 12.110 | -0.048 | 0.400 | -1.089 | 13.199 |
| S3R2N5 | 0.475 | 13.000 | 0.065 | 0.397 | -0.795 | 13.795 |
| S3R2N9 | 0.558 | 13.825 | 0.163 | 0.571 | -0.162 | 13.987 |
| S3R2N13 | 0.494 | 13.866 | 0.120 | 0.771 | 0.019 | 13.847 |
| S3R2N15 | 0.549 | 8.742 | 0.090 | -0.089 | -4.289 | 13.030 |
| S3R2N18 | 0.515 | 11.487 | 0.074 | 0.086 | -2.308 | 13.795 |
| S3R3N11 | 0.558 | 13.082 | 0.144 | 0.372 | -1.526 | 14.608 |
| S3R3N13 | 0.607 | 13.757 | 0.210 | 0.559 | -0.095 | 13.852 |
| S4R1N10 | 0.326 | 13.485 | -0.065 | 0.571 | 0.740 | 12.745 |
| S4R1N16 | 0.316 | 14.099 | -0.045 | 0.870 | 0.959 | 13.140 |
| S4R2N17 | 0.402 | 7.617 | -0.064 | -0.189 | -5.555 | 13.171 |
| S4R2N18 | 0.354 | 10.877 | -0.077 | 0.164 | -1.802 | 12.679 |
| S4R3N2 | 0.291 | 10.308 | -0.138 | 0.163 | -1.411 | 11.719 |
| S5000 | 0.344 | 12.729 | -0.060 | 0.433 | -0.652 | 13.381 |
| Star | V0 | (by)0 | c0 |
|---|---|---|---|
| S1R2N23 | 13.924 | 0.325 | 0.231 |
| S2R1N16 | 14.136 | 0.463 | 0.502 |
| S2R1N26 | 13.966 | 0.494 | 0.342 |
| S3R1N3 | 12.192 | 0.273 | 0.090 |
| S4R2N14 | 14.062 | 0.188 | 0.308 |
| S4R2N15 | 13.068 | 0.262 | 0.254 |
| S5001 | 13.696 | 0.235 | 0.208 |