Immersive 4D Interactive Visualization of Large-Scale Simulations
Abstract
In dense clusters a bewildering variety of interactions between stars can be
observed, ranging from simple encounters to collisions and other
mass-transfer encounters. With faster and special-purpose computers like
GRAPE, the amount of data per simulation
is now exceeding 1TB. Visualization of such data
has now become a complex 4D data-mining problem, combining space and time,
and finding interesting events in these large datasets. We have recently
starting using the virtual reality simulator, installed in the Hayden
Planetarium in the American Museum for Natural History, to tackle some of
these problem. This work111http://www.astro.umd.edu/nemo/amnh/;
reports on our first “observations”,
modifications needed for our specific experiments, and perhaps field ideas
for other fields in science which can benefit from such immersion. We also
discuss how our normal analysis programs can be interfaced with this kind of
visualization.
Astronomy Department, University of Maryland, College Park, MD
Institute for Advanced Study, Princeton, NJ
National Center for Supercomputing Applications, University of Illinois Urbana-Champaign, Urbana, IL
Department of Astronomy, The University of Tokyo, Bunkyo-ku, Tokyo 113-0033, JAPAN.
Department of Physics and Atmospheric Science Drexel University, Philadelphia, PA
Massachusetts Institute of Technology, Cambridge, MA
American Museum of Natural History, New York, NY
1. NEMO, Starlab and GRAPE
NEMO222http://www.astro.umd.edu/nemo/;
(Teuben 1994) and
Starlab333http://www.manybody.org;
are traditional programming environments with which
N-body simulations can be setup, run and analyzed. NEMO also has
a number of tools to import and export data in tables, CCD type images,
FITS files and a large number of other N-body formats. NEMO is more
geared towards collisionless stellar dynamics, while Starlab has
more sophisticated programs to deal with close encounters, and can
now also incorporate stellar evolution through the
SEBA package (Portegies Zwart et al. 2001).
NEMO and Starlab present themselves to a user as a large set of programs,
often glued together using pipes in shell scripts to set up and
run complex simulations. For the programmer, a large set of classes and
functions are available to construct new integrators and analysis programs.
For example, in the following Starlab
example an anisotropic King model with 2048
particles has been evolved with 50% binaries (i.e. 3096 actual stars)
and stellar evolution:
mk_aniso_king -i -n 2048 -u -w 4 -F 3                      |\
  mkmass -i -u 100 -l 0.1 -f 3                             |\
  mksecondary -f 0.5 -l 0.1                                |\
  addstar -Q 0.5 -R 2.5                                    |\
  scale -M 1 -E -0.25 -Q 0.5                               |\
  mkbinary -f 2 -l 1 -u 1000000 -o 2                       |\
  kira -a 0.1 -d 1 -D 25 -n 25 -t 4000 -Q -G 2 -u -B -z 1 > run001
The GRAPE special purpose hardware (Hut and Makino, 1999), now running at 100 TerraFlops speed, has been successfully interfaced with Starlab, and now is starting to produce massive datasets. Analysis and visualization techniques of those dataset are becoming increasingly challenging.
2. AMNH, Virtual Director and Partiview
The American Museum for Natural History (AMNH) in New York City has
recently renovated its planetarium, and converted it into a
state-of-the-art digital planetarium with capabilities for scientific
visualization. Their computer system consists
of an Onyx2, with 28 CPUs, 14 GB of memory, 2 TB diskspace and
7 graphics pipes. Each graphics pipe controls one of 7
projectors which illuminate the dome in a dodecahedral pattern.
The software that drives most visualization is an NCSA product called
Virtual Director444http://virdir.ncsa.uiuc.edu/virdir/virdir.html; (virdir),
that we have now
been using during a number of night sessions in the dome, much
like optical observers (during daytime the planetarium is of course
used for public viewing). It allows us to “fly” through
the data, in space and time.
By adding complete orbital information for a select number
of stars we have started fully interactive data mining of our
4D spacetime histories of these star cluster simulations runs.
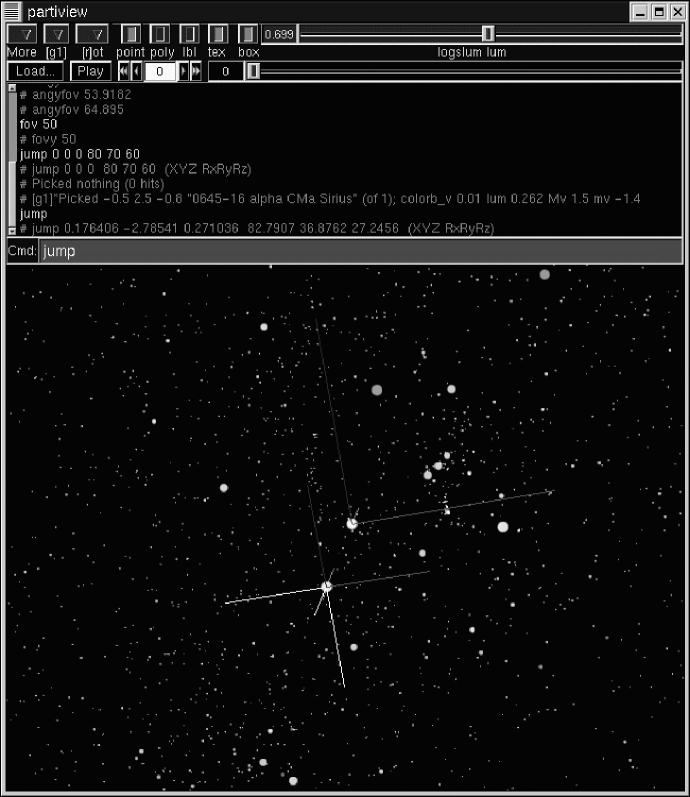
In order for us to test new visualization techniques, algorithms and interfaces with the Starlab environment, we used an existing program partiview, which had been derived from virdir, and which can be run on a normal workstation or laptop. It uses the FLTK and MESA/OpenGL libraries for its user interface and fast graphics. A screenshot of partiview in action can be seen in Figure 1. We have modified partiview to understand our Starlab simulatation data, and added interfaces that allow this workstation version to animate and move in time and space. partiview comes with a small but powerful set of commands with which dataselections and viewing can be made, and we hope to expand this into a more mature scripting language. It is also fairly straightforward for other packages to benefit from using partiview.
3. Future Plans
In the spirit of the federated model of archiving observational data, recently proposed by the NVO (National Virtual Observatory) initiative, we will develop a Starlab-based archive. A simulation of a globular cluster with a million stars stars for ten billion years will generate 100 Tbytes of raw data, of which we would like to store at least 1 Tbyte, and preferably more, for 4D visualization of the full history of the evolution of a star cluster. Although our main goal will be to enable rapid and intelligent access to our simulation output files, we will simultaneously develop a flexible and transparent interface with the NVO databace and protocols. Our Starlab policy will be to make all simulation results freely and publicly available to ‘guest observers’.
Acknowledgments.
Part of this paper was written while we were visiting the American Museum of Natural History. We acknowledge the hospitality of their astrophysics department and visualization group. We thank the Alfred P. Sloan Foundation for a grant to Hut for observing astrophysical computer simulations in the Hayden Planetarium at the Museum. NCSA’s Virtual Director group comprises of Donna Cox, Robert Patterson and Stuart Levy.
References
Hut, P., and Makino, J. 1999, Science 283, 64.
Portegies Zwart, S.F., McMillan, S.L.W., Hut, P. & Makino, J., 2000, MNRAS, Star Cluster Ecology: IVa Dissection of an open star cluster—photometry (astro-ph/0005248)
Teuben, P.J. 1994, in ASP Conf. Ser., Vol. 77, Astronomical Data Analysis Software and Systems IV, ed. R. A. Shaw, H. E. Payne, & J. J. E. Hayes (San Francisco: ASP), 398