Signal Characteristics from Electromagnetic Cascades in Ice
Abstract
We investigate the development of electromagnetic cascades in ice using a GEANT Monte Carlo simulation. We examine the Cherenkov pulse that is generated by the charge excess that develops and propagates with the shower. This study is important for the RICE experiment at the South Pole, as well as any test beam experiment which seeks to measure coherent Cherenkov radiation from an electromagnetic shower.
I Introduction
Ultra high energy neutrinos can travel a long distance without scattering. By detecting the sources of these particles, we can probe the physics of the standard model (and beyond) at energies un-obtainable at current accelerators. An ultra high energy neutrino can interact via a charge current interaction, giving most of its energy to the secondary electron, which can then initiate an electromagnetic cascade or shower. Askaryan askaryan62 predicted a negative charge imbalance in the cascade which gives rise to coherent Cherenkov radiation at radio frequencies. The predicted flux of ultra high energy neutrinos is small and model dependent Stecker96 ; halzen97 ; rachen99 . An experiment to detect ultra high energy neutrinos using radio antennas requires a large volume because of the small flux. A dense, radio-transparent target is needed for the small shower size needed for coherence and small signal attenuaton. Antarctic ice is suitable for this purpose. A detailed analysis of such an experiment was done fmr96 which concluded that a modest array of antennas can detect many events per year. The Radio Ice Cherenkov Experiment (RICE) at the South Pole rice99 is a prototype designed to detect neutrinos with energy using this method. A reliable Monte Carlo simulation tool is needed to study the shower development, Cherenkov radiation, detector, and data acquisiton system. One can also test the idea of coherent Cherenkov emission at accelerator facilities by dumping bunches of electrons or photons in a dense target like sand or salt or any other suitable medium gorham00 . Zas, Halzen and Stanev (ZHS) zhs92 developed a Monte Carlo simulation to study electromagnetic showers and Cherenkov emission in ice. Buniy and Ralston roman00 have also developed a method to estimate the coherent Cherenkov signal by parametrizing the cascades.
We have developed a GEANT Monte Carlo simulation primarily to study the coherent Cherenkov emmission in ice but it can easily be modified for other similar studies with different materials. GEANT geantman is a well known and widely used detector simulation package in particle physics. It allows access to all details of the simulation such as controls of various processes, definition of target and detector media, and a complete history of all events simulated. It can be used to simulate all dominant processes in the energy range. Cross sections of electromagnetic processes are reproduced in GEANT within a few percent up to a hundred . We use GEANT to simulate electromagnetic cascades inside materials from which we extract track information. We take this track information and determine the resulting radio pulse using standard electrodynamics calculations. We also calculate other shower parameters using the track and energy information from GEANT.
II Shower Description
When a high energy electron () or photon () hits a material target, an electromagnetic cascade is created inside the material. Bremmstrahlung and pair production are the dominant high energy processes at the beginning of the shower development. Due to bremmstrahlung, an loses of it’s energy on average over a distance , the radiation length. The secondary can then produce an pair. The number of particles thus grows exponentially. and lose energy due to ionization as they travel inside the material. After reaching a critical energy(), when the energy loss due to bremmstrahlung is equal the energy loss due to ionization, , lose their energy mostly due to ionization and the cascade eventually stops. A rough estimate of the critical energy is which can be obtained by equating the radiation and the ionization loss formulae. is the atomic number of the medium.
All models of an electromagnetic cascade, including a simplified model developed by Heitler heitler , and a more realistic model developed by Carlson and Oppenheimer oppenheimer37 , show similar basic features which include linear scaling of the track lengths and logarithmic scaling of the maximum position with primary energy.
The cascade is concentrated near an axis along the direction of the primary. Multiple Couloumb scattering is responsible for the transverse spread of the cascade. A quantity called Moliere radius () is determined by the average angular deflection per radiation length at the critical energy () and is used to estimate the transverse spread. One can also look at the fraction of energy that escapes transverse to the shower axis nelson66 ; bathow70 to get a good estimate of . About of the primary energy is contained inside a tube of radius along the shower axis. A relationship between the Moliere radius, the critical energy and the radiation length is where is the scale energy.
Low energy processes like Compton, Moller and Bhabha scatterings and positron annihilation build up a net charge (more than ) in the cascade, as atomic electrons in the target medium are swept up into the forward moving shower.
III Electromagnetic Pulse
High energy and in the cascade can travel faster than the speed of light in the medium and give rise to Cherenkov radiation. The electric field due to a single charge moving uniformly from position to in the Fraunhoffer limit, is given by
| (1) |
where is the relative permeability and is the refractive index of the medium. The condition defines the Cherenkov angle as . At or very close to the Cherenkov angle or at low frequency, the equation (1) can be reduced to the form
| (2) |
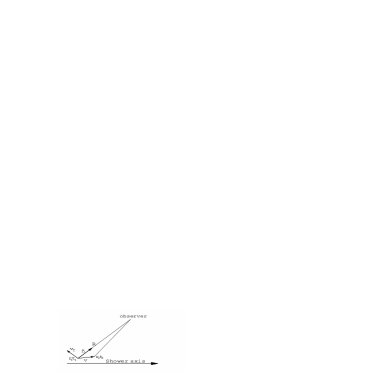
See Fig. 1 for a description of various quantities in equations (1, 2).
IV Monte Carlo Results
Since on average, the electrons lose of their energy in each radiation length due to bremmstrahlung, one can fit an exponential to the energy loss data generated by the Monte Carlo and find a value for the radiation length (). This will serve as an internal consistency check to ensure that we are tracking all the particles along with their energies. We generated showers of electrons and recorded the energy loss due to bremsstrahlung. A fit to this gives a radiation length of . Given the molecular composition, GEANT also calculates the medium’s radiation length. For ice it is , which is in agreement with the value we calculated.
| Table I GEANT consistency checks | |||
|---|---|---|---|
| Parameters | Iron | Lead | Ice |
| () (from ref pdg96 ) | |||
| () | |||
| () | |||
| () | |||
To calculate the Moliere radius () we construct an imaginary cylinder centered on the shower axis (up to the physical length of the shower). We add the energy (), of all the tracks that leave the cylinder without re-entering. By varying the radius of the cylinder we arrive at which is the radius of the cylinder when the fraction is equal to , being the initial energy of the cascade. We have checked for lead, iron and ice (see table I). One can also calculate the critical energy () using two different formulae quoted earlier.


Shower depth () is measured in units of radiation length () as . We have simulated electron-induced cascades in iron. The longitudinal profile was obtained by adding the number of particles with total energy greater than crossing planes at every half radiation length perpendicular to the shower axis as shown in Fig. 2a. The number of particles agrees reasonably with EGS4 simulation of the same shower pdg96 . The Greisen-Rossi distribution for total number of particles (electrons and positrons) is shown by the dashed line. A least squares fit to the GEANT data with Greisen-Rossi distribution gives about confidence level.
We used the same method to study the longitudinal profile of showers in ice. Simulation shows the correct scaling behavior of the number of particles with the initial energy of the shower. The position of the shower maximum also shows the correct logarithmic scaling with the initial energy. The charge excess () is defined as where and are the number of electrons and positrons respectively as functions of shower depth. According to our simulations, the net charge imbalance is at the shower max. Note that there is no direct experimental data on this.
A comparison of shower (averaged over 20 showers) with threshold from GEANT to the same from ZHS Monte Carlo (Fig. 2b) shows about a discrepancy for the total number of particles at the shower max. The discrepancy between the two simulations remains the same at higher energies.
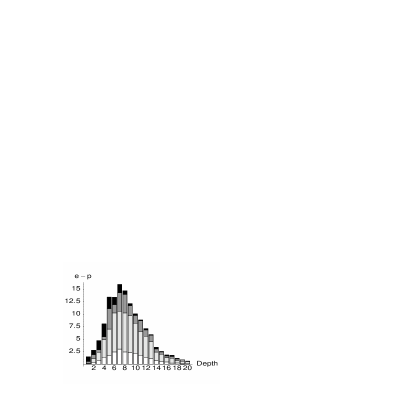
In Fig. 3, we show the charge excess in a shower from GEANT with kinetic energy threshold . This is an average of showers and the charge excess is broken down to different energy bins. It shows that most of the contributions to charge excess come from the energy range to .
The Cherenkov pulse from a cascade is proportional to the total track length (energy deposition) of the cascade. Our results show the correct scaling behavior of the track lengths with the initial energy (). If we consider all processes to be elastic except ionization, then an upper bound for the total track length is where is the average ionization energy loss per unit length. To determine () we generated of tracks and kept a record of the rate at which energy was lost due to ionization. Fig.4a shows the average () for the tracks. It can be seen that the average value matches theoretical Bethe-Bloch result reasonably well. The average ionization loss in the relativistic rise region is approximately .
V Pulse Calculation
To calculate the electric pulse from the cascade, we added up the contributions (1) from all charged tracks. There are two assumptions we made to evaluate pulse (1) and (2) from GEANT track information. First, we assume an azimuthal symmetry about the shower axis, which allows us to evaluate pulse equations in 2-dimensions. This is a good approximation as long as we have many tracks in the shower. A typical shower has thousands of tracks and the number goes up as we increase the energy. We checked this approximation on a shower-by-shower basis and did not find any noticeable difference between the pulses evaluated in the plane and in the plane ( - is the shower axis). Second, we evaluate the times and in (1) and (2) assuming that the particles travel at the speed of light. This is a good approximation if the frequency is not too high as can be seen from (1).


In Fig. 4b, we calculate pulses111we use different normalization here for the field, which requiring that one multiply (1) and (2) by from and showers at and frequencies. The pulse height at the Cherenkov peak () scales with the energy of the shower, and the Gaussian half width is inversely proportional to the frequency which is analogous to a slit diffraction pattern.
VI Conclusion
We find distinctive, coherent, Cherenkov radio frequency emission from simulated electromagnetic cascades in ice with energies in the to range. The multi-purpose, detector simulation package GEANT provides a suitable modelleing of electromagnetic shower details for this purpose, with the flexibility to include hadronic cascades in future studies. This work also serves as an independent treatment of the problem, which has been studied previously zhs92 . The GEANT generated showers are qualitatively in agreement with those in zhs92 . The showers differ in several details; however our far-field calculation of the pulse from a shower gives the same result up to a frequency as that of zhs92 when both are applied to the same shower simulation. This has been checked explicitly by calculating the field using our field code and the track informtions from ZHS code with the direct field output from ZHS code for the same shower. The differences between a GEANT and a ZHS shower of initial energy is summarized in Table II. The origin of differences between the two Monte Carlos is under study.
Our direct calculation of Moliere radius, critical energy and shower population as a function of shower depth using GEANT all agree within a few percent with measurements or with published EGS4 simulations for iron and lead pdg96 . The extension to ice is straightforward and we expect the same level of reliability here.
Our results agree with the theoretically expected rossi linear scaling of number of particles at shower maximum and logarithimic scaling of depth at shower maximum with energy. These are not straightforward results, since the theoretical predictions are based on inclusion of bremmstrahlung and pair production only, while the physics at the shower maximum is not dominated by these processes. It includes important contributions from Compton, Bhabha and Moller processes as well, which give rise to charge imbalance and, consequently, coherent radio Cherenkov field emission.
| Table II Comparisons between GEANT and ZHS Monte Carlos | ||
| (averaged over 20 showers each) | ||
| Quantity | GEANT | ZHS |
| Primary Energy () | ||
| Total Energy Threshold () | ||
| Total absolute track length () | ||
| Total projected () track length () | ||
| (sum of electron and positron track lengths | ||
| projected along the shower axis) | ||
| Total projected () track length () | ||
| (difference of electron and positron track lengths | ||
| projected along the shower axis) | ||
| Position of the shower max. (radiation length) | 7 | 7 |
| Number of particles () at shower max. | ||
| Excess electrons () at shower max. | ||
| Fractional charge excess at the shower max | ||
| Cherenkov peak at () | ||
Acknowledgement Thanks to J. Alvarez-Muñiz, T. Bolton, R. Buniy, G. Frichter, F. Halzen, J. Ralston, D. Seckel and E. Zas for help and advice at various stages. This work is supported in part by the NSF, the DOE, the University of Kansas General Research Fund, the RESEARCH CORPORATION and the facilities of the Kansas Institute for Theoretical and Computational Science.
References
- (1) G. A. Askar’yan. Sov. Phys., JETP14:441, 1962.
- (2) S. W. Stecker and M. H. Solomon. Space Sci. Rev., 75:341, 1996.
- (3) F. Halzen and E. Zas. astrophys. J., 488:669, 1997.
- (4) J. Rachen, R. Protheroe, and K. Mannheim. astro-ph/99080301, 1999.
- (5) G. Frichter, D. W. McKay, and J. P. Ralston. Phys. Rev., D53:1684, 1996.
- (6) RICE Collaboration. ICRC proceedings, 1997.
- (7) D. Saltzberg et al. hep-ex/0011001, 2000.
- (8) E. Zas, F. Halzen, and T. Stanev. Phys. Rev., D45:362, 1992.
- (9) R. V. Buniy and J. P. Ralston. astro-ph/0003408, 2000.
- (10) CERN. GEANT-Detector Description and Simulation Tool, 1994.
- (11) W. Heitler. The Quantum Theory of Radiation. Clarendon, 1954.
- (12) J. F. Carlson and J. R. Oppenheimer. Phys. Rev., 51:220, 1937.
- (13) W. R. Nelson et al. Phys. Rev., 149:201, 1966.
- (14) G. Bathow et al. Nucl. Phys., B20:592, 1970.
- (15) Particle Data Group. Phys. Rev., D54:136, 1996.
- (16) B. Rossi. High Energy Particles. Prentice Hall, 1952.