Molecular Gas in Infrared-Excess, Optically-Selected QSOs and the Connection with Infrared Luminous Galaxies
Abstract
The initial results of a millimeter (CO) survey of infrared-excess, optically-selected quasars from the Palomar-Green (PG) Bright Quasar Survey (BQS) with redshifts in the range are presented. These observations represent the first step towards establishing with a complete sample whether or not quasi-stellar objects (QSOs) reside in molecular gas-rich galaxies, as well as towards determining how the infrared and molecular gas properties of QSOs compare with those of ultraluminous infrared galaxies (ULIGs), which are a possible evolutionary precursor of QSOs. The sample consists of QSOs having absolute blue magnitudes, , and infrared excesses, , where the contribution to the bolometric luminosity of infrared thermal dust emission for all PG QSOs is typically 20–40%. Six out of 10 of the QSOs observed are detected in the CO() emission line; two detections confirm previous, less sensitive detections of CO() in PG 1613+658 and PG 0838+770, and four additional QSOs are detected for the first time (PG 1119+120, PG 1351+640, PG 1415+451, and PG 1440+356). These six detections, plus two previous detections of CO in IZw1 and Mrk 1014, bring the total number of infrared-excess PG QSOs detected in CO to date to eight, and provide possible evidence that, in addition to fueling star formation, molecular gas may also serve as a primary source of fuel for QSO activity.
Both the eight QSOs detected in CO and the four QSOs with non-detections have high infrared-to-CO luminosity ratios, , relative to most infrared luminous galaxies of the same . The placement of these QSOs on the plane may be due to significant contributions to dust heated by the QSO in their host galaxies, due to dust heated by massive stars formed with high efficiency (i.e., per unit molecular gas mass) relative to most infrared luminous galaxies, or a combination of both. If the observed high values of are primarily due to dust heating by QSOs, a significant fraction of ULIGs with similar values of may also contain buried AGN. Alternatively, if high is due primarily to star formation, then an enhanced star formation rate may be intimately connected to the QSO phenomenon.
A comparison of the infrared and CO luminosities of the eight detected and four undetected QSOs with the optical morphologies of their host galaxies shows that the three QSOs with and similar to ULIGs appear to reside in morphologically disturbed galaxies (i.e., ongoing major mergers involving two or more gas-rich disk galaxies), whereas the host galaxies of the remaining eight QSOs with lower and appear to be a mixture of barred spiral host galaxies, elliptical galaxies, galaxies with an indeterminant classification, and at least one ongoing major merger.
Subject headings:
quasars: general—galaxies: ISM—infrared: galaxies—ISM: molecules—radio lines: galaxies—galaxies: active1. Introduction
There exists substantial evidence that the bulges of nearby massive galaxies contain quiescent supermassive nuclear black holes ( M⊙: Magorrian et al. 1998; van der Marel 1999; Kormendy et al. 1998). The almost ubiquitous presence of such objects, in combination with the possibility that nuclear black hole mass scales with stellar bulge mass (i.e., the Magorrian Relation: Magorrian et al. 1998), indicates that supermassive black holes are an essential part of spheroid formation, and that mass accretion onto nuclear black holes during stellar bulge formation likely resulted in periods of AGN activity.
There also exists growing observational evidence that core111We define the “core” to be the region of a galaxy internal to the radius at which the projected surface brightness is half its central brightness. This differs from the “bulge” of a galaxy, which is the region internal to the radius which encloses half the total luminosity of a galaxy. formation and AGN activity may be linked with ultraluminous infrared galaxy (ULIG)222ULIGs are defined as galaxies with L⊙. mergers, lending support to the evolutionary connection between ULIGs and QSOs first proposed by Sanders et al. (1988a). The evidence can be summarized as follows: First, observations of massive concentrations of molecular gas in the nuclear regions of local ULIGs relative to that observed in normal galaxies (e.g. Kormendy & Sanders 1992; Downes & Solomon 1998; Bryant & Scoville 1999) support the highly dissipative nature of ULIGs. Second, spectroscopic evidence that a significant fraction of ULIGs, most of which have “warm” infrared colors (i.e., 25m to 60m flux density ratio, ), have Seyfert-like emission line spectra (Veilleux et al. 1995; Veilleux, Kim, & Sanders 1999) may indicate that merger events are intimately connected with AGN activity. Third, recent CO() observations show the association of molecular gas with the AGN nucleus of several double nucleus ULIGs (Evans et al. 1999; Evans et al. 2000), supporting the necessity of dissipative material for fueling AGN activity. Fourth, the recent evidence of similarities in the space densities of high-redshift submillimeter (SCUBA) galaxies (e.g., Smail, Ivison, & Blain 1997; Barger et al. 1998; Hughes et al. 1998; Barger, Cowie, & Sanders 1999) and local giant elliptical galaxies has been used to infer that ULIGs are connected with massive galaxy formation (Barger et al. 1999; Trentham 2000).333This assumes that high-redshift infrared luminous galaxies are distant analogs of local infrared galaxies.
From the above, it seems reasonable to assume that a significant fraction of QSOs may have molecular gas rich hosts and that molecular gas may play an important role in fueling not only circumnuclear starbursts, but also AGN activity in galaxies experiencing dissipative collapse. As a first step towards establishing the presence of abundant reservoirs of molecular gas in QSOs, a survey of CO() emission in a complete sample of low-redshift, optically-selected QSOs has been initiated. In addition to detecting the possible fueling source for both AGN and star formation activity, these observations provide a major missing link in comparing the properties of low-redshifts QSOs and infrared luminous galaxies with both “cool” (i.e., 25m to 60m flux density ratio, ) and “warm”, Seyfert-like () mid-to-far infrared flux density ratios. Specifically, these data make it possible to determine whether the relative molecular gas properties of PG QSOs and ULIGs are consistent with the hypothesis that cool and warm ULIGs represent successive stages in the evolution toward UV-excess QSOs (Sanders et al. 1988a). The CO data presented here are complemented by previous studies of the far-infrared properties (Sanders et al. 1989a) and host galaxy morphologies (Bahcall et al. 1997; Surace 1998; Surace & Sanders 2000: hereafter SS00) of optical QSOs, and thus facilitate a more well-rounded comparison with the wealth of data available of low-redshift () infrared luminous galaxies.
This paper is divided into 6 sections. Section 2 is a summary of the sample selection. In §3, the general observing procedure is discussed, followed by the results in §4. A comparison of the CO and infrared properties of the PG QSOs with those of local infrared luminous galaxies and high redshift QSOs is provided in §5, along with a summary of molecular gas and infrared properties of the PG QSOs relative to the optical morphologies of their host galaxies. Finally, §6 summarizes the paper. Throughout this paper, km s-1 Mpc-1 and are assumed.
2. Sample Selection
The QSOs observed as part of this CO study were selected from a complete sample of 18 QSOs defined by SS00. The reader is referred to SS00 for a detailed discussion of the sample selection, but it is briefly summarized here for completeness. The selection criteria consisted of all QSOs from the Palomar–Green Bright Quasar Survey (PG BGS: Schmidt & Green 1983) having infrared-to-“big blue bump” luminosities, and absolute blue magnitudes, . The former criteria selects QSOs with infrared excesses that overlap with warm infrared luminous galaxies (see §5.2).
There are two advantages to using the SS00 sample. First, the far-infrared flux densities of these QSOs have been measured using the Infrared Astronomical Satellite (IRAS) data (Sanders et al. 1989a), making direct comparisons of their infrared and molecular gas properties with those of infrared luminous galaxies possible. Second, the molecular gas properties of these QSOs can be compared with pre-existing optical images of the QSO host galaxies to search for correlations of with the morphology of the host galaxies.
While QSOs with infrared excesses may at first seem to be unrepresentative of optical QSOs, it must be remembered that at least two-thirds of all the PG QSOs in the Bright Quasar Survey show clear evidence of infrared emission consistent with thermal dust emission, with the infrared components contributing 20-40% of their total bolometric luminosity (Sanders et al. 1989a). Thus, the sample selected for this survey is simply the optical QSOs with the highest probable dust content.
Of the 18 QSOs in the SS00 sample, two of them (IZw1 and Mrk 1014) have previous confirmed CO() detections (e.g. Sanders, Scoville, & Soifer 1988; Barvainis et al. 1989; Solomon et al. 1997; Schinnerer, Eckart, & Tacconi 1998) and two others (PG 0838+770 and PG 1613+658) have unconfirmed CO detections (Alloin et al. 1992). In addition to observing PG 0838+770 and PG 1613+658, eight PG QSOs with ratios in the range of 0.36–1.1 were selected for CO observations. The sample is listed in Table 1.
3. Observations
Aperture synthesis maps of CO() emission in the sample of PG QSOs were made with the Owens Valley Radio Observatory (OVRO) Millimeter Array during 21 observing periods from 1999 April to 2000 October. The array consists of six 10.4m telescopes, and the longest observed baseline was 103m. Each telescope was configured with 1204 MHz digital correlators. All but one of the observations were done in the low-resolution configuration, providing a (full width at half the maximum intensity, or FWHM) synthesized beam with natural weighting. For each QSO, the receivers were tuned to the expected frequency of the redshifted CO emission line. These redshifts were estimated from published optical emission line redshifts compiled by the NASA Extragalactic Database (NED); typically, the average or the most common redshift was adopted. During the observations, nearby quasars were observed every 25 minutes to monitor phase and gain variations, and several brighter quasars were observed to determine the passband structure. Observations of Uranus were also made for absolute flux calibration; typical uncertainties in the flux calibration are 15-20%. A journal of observations is provided in Table 2.
4. Results
The data were reduced and calibrated using the standard Owens Valley array program MMA (Scoville et al. 1992). The data were then exported to the mapping program DIFMAP (Shepherd, Pearson, & Taylor 1995) and to the NRAO software package AIPS for spectral line extraction.
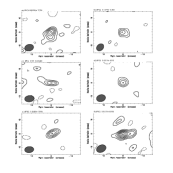
Figure 1 shows the integrated CO() intensity maps for the detected PG QSOs (integrated intensity values are listed in Table 3). Six out of the ten QSOs observed were detected in CO; all of the detections have a signal-to-noise ratio, S/N, greater than 4.5. A comparison was done between the CO beam centroid positions and the optical QSO positions, the latter of which were extracted from the USNO-A2.0 Catalog. With the exception of PG 1351+640 (1.44″ offset) and PG 1613+658 (1.05″ offset), all the CO centroid and optical positions agreed to within 0.9″. Of the four non-detections, two are of the QSOs with the highest redshifts in the sample (PG 1402+261 and PG 1202+281). For all four non-detections, the 1.0 GHz continuum channel data was examined to search for CO emission over a broader (albeit less sensitive) bandwidth than covered by the spectrometer. Such searches yielded null results.
In the present sample of ten QSOs, PG 0007+106 is the only one having detectable 3mm continuum emission. The unresolved continuum emission is observed to be at RA = 00:10:30.98 dec = +10:58:29.8 (J2000.0), which is within 0.75 of the USNO-A2.0 optical position, and the continuum flux density is measured to be 0.1 Jy.
Figure 2 shows the CO() spectra of the six detected QSOs. The CO emission line widths are varied, ranging from FWHM of km s-1 for PG 1415+451 and PG 0838+770 to km s-1 for PG 1613+658. All of CO emission line centroids are within 300 km s-1 of the adopted optical redshifts, indicating that the optical emission lines are only moderately red/blueshifted relative to the systemic velocity. Both PG 0838+770 and PG 1613+658 are detected in CO; the emission line widths and redshifts are similar to those reported by Alloin et al. (1992), however, the integrated CO line intensity of PG 0838+770 is only 40% of that reported by Alloin et al. (1992). By comparison, the CO line intensity of PG 1613+658 agrees with the Alloin et al. (1992) measurement to within 12% (i.e. within the error of the OVRO measurements).
While the CO emission line of PG 1415+451 was detected with a signal-to-noise of 5.2, the narrow appearance of the emission feature may be an indication that the “line” is actually an artifact; i.e., a spurious interference spike created at the phase center of the interferometer. We believe that the emission feature is authentic based on a combination of the following three facts: First, the emission feature spans five independent (i.e., unbinned) channels. Second, while the phase center of the PG 1415+451 observations is within the beam of the emission feature, and the centroid position of the feature is closer to the optical QSO position (obtained from the USNO–A2.0 catalog) than the phase center is to the optical QSO position. Third, the CO observation of PG 0838+770, which has a CO line width less than a factor of two wider than the emission feature observed for PG 1415+451, was a confirmation of prior observations reported by Alloin et al. (1992), and is thus authentic. It is thus likely that the host galaxies of both QSOs simply have molecular disks that are being observed nearly face-on.
4.1. CO Line Luminosities and Molecular Gas Masses
Table 3 summarizes the emission line properties of the ten PG QSOs. The luminosity distance for a source at a given redshift is,
Given the measured flux, , the CO luminosity of a source at redshift is,
where is the speed of light, is the Boltzmann constant, and is the observed frequency. In terms of useful units, can be written as,
To calculate the mass of molecular gas in the PG QSOs, the reasonable assumption is made that the CO emission is optically thick and thermalized (see Discussion Section), and that it originates in gravitationally bound molecular clouds. Thus, the ratio of the H2 mass and the CO luminosity is given by,
where H and are the density of H2 and brightness temperature for the CO(10) transition (Scoville & Sanders 1987; Solomon, Downes, & Radford 1992). Multitransition CO surveys of molecular clouds in the Milky Way (e.g. Sanders et al. 1993), and in nearby starburst galaxies (e.g. Güsten et al. 1993) have shown that hotter clouds tend of be denser such that the density and temperature dependencies tend to cancel each other. The variation in the value of is approximately a factor of 2 for a wide range of kinetic temperatures, gas densities, and CO abundance (e.g. [K km s-1 pc: Radford, Solomon, & Downes 1991). More recent dynamical mass estimates of a low-redshift infrared galaxy sample observed in CO with the Plateau de Bure Interferometer indicate that can be as low as 1 [K km s-1 pc (Downes & Solomon 1998). We adopt a value of 4 (K km s-1 pc for , which is similar to the value determined for the bulk of the molecular gas in the disk of the Milky Way (Scoville & Sanders 1987; Strong et al. 1988).
In the four cases where only upper limits to the CO flux were determined, the average FWHM velocity of all the PG QSOs detected in CO to date was adopted (280 km s-1). Conservative upper limits to the CO luminosity and molecular gas mass were then calculated from the 3 upper limits to the CO flux density.
5. Discussion
The detection of CO emission in the host galaxies of these PG QSOs provides direct evidence that these infrared-excess QSOs live in host galaxies containing significant supplies of molecular gas. It also supports the hypothesis that galaxies with a molecular gas-rich interstellar medium (ISM) may be capable of igniting and sustaining both AGN and star formation activity in QSO host galaxies. The measured CO luminosities for the six detected QSOs in Table 3 translate into molecular gas masses of M⊙, which, along with the additional two QSOs IZw1 and Mrk 1014, span the full range of masses derived for luminous infrared galaxies (LIGs)444LIGs are defined as galaxies having L⊙. and ULIGs.
These six PG QSOs are among the faintest CO() sources yet detected at redshifts . An interesting issue is whether or not the CO luminosities of these sources, and perhaps the CO luminosities of other PG QSOs as well, could have been predicted apriori. Consider the plot of CO flux versus the 100m flux density of the PG QSO sample, in addition to a comparative sample of warm and cool ULIGs observed in CO to date (Figure 3). Solomon et al. (1997) use the tightness of this correlation, in combination with the small sizes of the CO emitting regions in ULIGs, to argue that the dust emission at 100m and the CO(10) emission is optically thick (see their Figure 4). The resolution of the present CO dataset is insufficient to determine how compact the CO emitting regions in these PG QSOs are (e.g., corresponds to kpc at ). For our purposes, the fact that all of the PG QSOs detected in CO to date also fall along this correlation indicates that the CO fluxes (and thus, the molecular gas masses) of optical QSOs may potentially be estimated from the 100m flux density, , to within a factor of a few if is known to high accuracy. Note, however, that the error in of any IRAS measurements exceeds 25% below 0.5 Jy; improved far-infrared measurements of QSOs will be possible via observations with the Space Infrared Telescope Facility (SIRTF).
With the detection of molecular gas in the six of the ten optical QSOs listed in Table 3, plus the previous detection of IZw1 and Mrk 1014, physically meaningful comparisons between QSOs and infrared-selected galaxies can be better addressed. The remainder of the discussion section will thus be focussed on comparing the infrared and CO luminosities of the eight QSOs detected in CO to date with infrared luminous galaxies, followed by a brief discussion of recent images of the host galaxies of these PG QSOs (Bahcall et al. 1997; SS00). The four QSOs with CO non-detections will be discussed where applicable.
5.1. Comparison with Infrared Luminous Galaxies
Figure 4 is a plot of CO luminosity versus redshift of the 12 QSOs. In order to examine how the CO luminosity of these PG QSOs compares with that of the most CO luminous galaxies presently known at any given redshift, the infrared luminous galaxies observed in CO() by the Sanders et al. (1989b), Sanders, Scoville, & Soifer (1991), and Solomon et al. (1997) surveys have also been plotted. All but eight of the infrared luminous galaxies at are ULIGs. Three features of Figure 4 are readily apparent. First, the CO luminosity range of all twelve QSOs spans more than an order of magnitude. This range is significantly more than that of the cool ULIGs, all of which have K km s-1 pc2 over the same redshift range. Second, the three QSOs with the highest (IZw1, PG 1613+658, and Mrk 1014) fall within the scatter of the cool ULIGs distribution, whereas the remaining nine QSOs form a distinct group with lower values of CO luminosity for their given redshift. Third, seven of the eight QSOs detected in CO have a range in similar to that of the warm ULIGs. Thus, while the values of the QSOs are diverse, there is also evidence of overlap in between these optically-selected and infrared-selected samples.
Consider now the infrared luminosity of both samples relative to the CO luminosity. Figure 5 shows two ways in which infrared and CO data of infrared luminous galaxies are commonly plotted. The top panel (Figure 5a) is a plot of versus , which shows the relationship between the fuel available for star formation and AGN activity () and the luminosity of the imbedded sources (). The bottom panel (Figure 5b) is a plot of versus . In starburst galaxies, is commonly referred to as the star formation efficiency, it is a measure of the number of high-mass stars (as traced by ) created per unit molecular gas mass (as traced by ). An examination of Figure 5a shows that the quantity increases as increases, and for any given CO luminosity bin, the QSOs are in the upper half of the distribution. In Figure 5b, the QSOs populate the upper half of the LIG-ULIG distribution of . Note also that, in general, the warm infrared galaxies and QSOs populate similar areas of both plots.
The interpretation of Figure 5 depends on whether the infrared emission in QSOs is due to dust heating by AGN or massive stars. First, consider the former possibility: Sanders et al. (1988a) proposed that ULIGs are dust-enshrouded QSOs; in this scenario, the optical QSO is revealed after most of the molecular gas is consumed by star formation and AGN activity, and after most of the dust is destroyed/blown out by winds associated with supernovae and AGN. During this process, ULIGs pass from a cool infrared phase where vigorous star formation and black hole creation/accretion has commenced, through a warm infrared phase (see also Sanders 1988b). This idea is further addressed by Sanders et al. (1989a), who propose that the infrared emission from PG QSOs is thermal emission from dust that has absorbed 20–40% of the emission emanating from the QSO (i.e., , where is the bolometric luminosity). Given this, the quantity is not a measure of the star formation efficiency in QSOs, but is an indication that the AGN is contributing significantly to heating the dust in QSOs (see also Evans et al. 1998).
If the dust-enshrouded quasar model of ULIGs is correct and the ratio for both ULIGs and QSOs is due to covering factor and not due to orientation effects (e.g. Barthel 1989), optically-selected QSOs must have had a covering factor of unity in their past ULIG phase. Consider now where the QSOs would be on Figure 5a and 5b if the QSO nuclei were completely enshrouded in dust (i.e. ). This increases of the QSOs by 0.3–0.5 in Figure 5a, and shows to first order a possible range in locations of enshrouded QSOs on this diagram. In Figure 5b, the quantity of the QSOs is increased to extreme values (). Note that, in both panels, ULIGs with high () occupy the region covered by the QSOs, similar to what would be expected if these ULIGs were dust-enshrouded QSOs.
As mentioned above, the second possible interpretation of the infrared emission in QSOs is that is primarily due to dust heating by massive stars. Thus, high values of (Figure 5a) and (Figure 5b) would result from an extremely efficient production of high-mass stars per unit molecular gas mass in QSOs relative to most LIGs and ULIGs. The attraction of this scenario is that both stars forming in the central regions of galaxies and AGN contribute significantly to the overall energy budget of their host galaxies, and that AGN activity is somehow strongly dependent on an accompanying starburst. Indeed, observed correlations between the masses of quiescent supermassive nuclear black holes and both the stellar bulge masses (e.g., Magorrian et al. 1998) and velocity dispersions (Ferrarese & Merritt 2000; Gebhardt et al. 2000) of nearby normal galaxies suggests that the accretion of mass onto nuclear black holes may accompany stellar bulge formation. However, whether or not a significant fraction of the stellar bulge population of the present sample of PG QSOs is in the process of being formed cannot be addressed with the present data set.
5.2. The Host Galaxies
An obvious issue to consider at this point is whether or not the diversity of and of these 12 QSOs is at all correlated with the galaxy type or evolutionary state of their host galaxies. An examination of optical and near-infrared images of all 12 QSOs (Bahcall et al. 1997; Surace et al. 1998; SS00) reveals that two of the QSOs with the highest (Mrk 1014 and PG 1613+658) have irregular morphologies consistent with an advanced merger of two molecular gas-rich disk galaxies (see simulations by Barnes & Hernquist 1996), and the other (IZw1) has asymmetric spiral arms, suggestive of a strong interaction with a much smaller mass companion. The remaining nine QSOs have host galaxies that appear to be a mixture of barred spiral galaxies, elliptical galaxies, galaxies with indeterminant features, and at least one ongoing merger (i.e., PG 0007+106).
The morphologies are suggestive of a diversity in paths that may ultimately lead to QSO activity (SS00). First, the QSOs having the highest values of appear to be ongoing major mergers (collisions of two or more molecular gas-rich disk galaxies where prominent tidal features are still visible). Thus, in terms of , , and host morphologies, these QSOs are similar to ULIGs. Second, the less CO-luminous QSOs with barred spiral galaxy hosts have a less clear origin, however, the bar likely acts as the means by which molecular gas in the spiral arms is torqued and drained of enough angular momentum to agglomerate in the nuclear regions (e.g. Sakamoto et al. 1999). These barred spiral galaxies may have lower because only one, massive molecular gas-rich galaxy is involved (though the bar instability may be triggered via an interaction with a satellite galaxy). Third, the QSOs having host galaxies with an indeterminant classification may be spiral galaxies with features too faint to discern with the sensitivity of the SS00 observations, fully evolved elliptical galaxies, or well-evolved major mergers which are evolving into elliptical galaxies (see simulations by Barnes & Hernquist 1996). Thus, these host galaxies may have low because the host galaxy is intrinsically molecular gas poor, or because the molecular gas has already been consumed via both circumnuclear star formation and the QSO. Finally, the QSOs with elliptical host galaxies may be the end stage of the merger one two disk galaxies, or elliptical host galaxies that have cannibalized a satellite galaxy (such as the galaxy IRAS PSC 09104+4109: e.g. Evans et al. 1998).
5.3. Comparison with High Redshift QSOs
A significant number of QSOs have been detected at high redshift (: Barvainis et al. 1994, 1998; Ohta et al. 1996; Omont et al. 1996; Guilloteau et al. 1997; Downes et al. 1999). These QSOs, many of which were initially selected for CO observations based on their strong rest-frame infrared luminosity, are likely among the most molecular gas rich QSOs at their redshift. Figure 6 is a plot of the CO luminosity of the eight PG QSOs detected in CO to date, as well as all of the moderate () and high-redshift CO luminous QSOs, versus the redshift. Several of the QSOs at high redshift are known to be gravitationally lensed; in these cases, both observed and the intrinsic CO luminosities are plotted. Based on the present sample, there is no convincing evidence for evolution of molecular gas mass of the most CO luminous QSOs at any given redshift as a function of increasing redshift. The ratio of of BRI 1335-0415 () to that of the most CO luminous low-redshift QSO (Mrk 1014: ) is three. However, given the uncertainty in the –to–H conversion factor, , the factor of three is also consistent with no evolution.
The derived molecular gas masses of the most CO luminous QSOs at any given redshift are significantly below the average stellar mass of present-day elliptical galaxies ( several M⊙). Given that massive elliptical galaxies are a likely end stage for many QSO host galaxies (e.g., as inferred from Bahcall et al. 1997 or the Magorrian Relation), the mass discrepancy can be rectified by concluding that present-day massive galaxies are created from the merger of smaller galaxies, and/or that galaxies with molecular gas masses in excess of several M⊙ quickly consume the gas by forming high mass stars (e.g. Evans et al. 1996, 1998).
6. Summary
Millimeter (CO) observations of 10 infrared-excess, optically-selected Palomar-Green QSOs with redshifts in the range have been presented. These observations represent the first step towards detecting molecular gas in a complete sample of optical QSOs. The following conclusions have been reached:
1) Six out of 10 QSOs in the sample were detected in CO. The CO detections in PG 1613+658 and PG 0838+770 confirm previously reported detections by Alloin et al. (1992). These detections, combined with previous detections of CO in the PG QSOs IZw1 and Mrk 1014, provide strong support for the possibility that molecular gas is a likely source of fuel for both AGN and star formation in QSO host galaxies.
2) All of the QSOs have high values of relative to most infrared luminous galaxies of the same . This is because QSOs contribute significantly to the heating of dust in their host galaxies, and/or because the dust is heated by massive stars formed with high efficiency (i.e., per unit molecular gas mass) relative to most infrared luminous galaxies. If large values of are achieved primarily through dust heating by QSOs, a significant fraction of ULIGs with similar values of may also contain buried AGN. Alternatively, if high is due primarily to star formation, then high-mass star formation may be intimately connected to the QSO phenomenon.
3) The warm infrared luminous galaxies, which by definition have Seyfert-like mid-to-far infrared flux density ratios (i.e., ), have similar ranges of and as the infrared-excess PG QSOs.
4) A comparison of the CO luminosities and optical morphologies of the QSO host galaxies indicates that QSOs with the highest infrared and CO luminosities reside in morphologically disturbed galaxies, whereas the rest have a mixture of barred spiral host galaxies and “featureless” host galaxies.
5) There is no convincing evidence of evolution in the molecular gas content of the most CO luminous QSOs in the redshift range . The most CO luminous high-redshift QSO (BRI 1335-0415) has an a factor of three greater than the most CO luminous low-redshift QSO (Mrk 1014). However, given the uncertainty in the –to–H conversion factor, , the factor of three is also consistent with no evolution.
References
- (1) Alloin, D., Barvainis, R., Gordon, M. A., & Antonucci, R. R. J. 1992, A&A, 265, 429
- (2) Bahcall, J. N., Kirhakos, S., Saxe, D. H., Schneider, D. P. 1997, ApJ, 479, 642
- (3) Barger, A. J. et al. 1998, Nature, 394, 248
- (4) Barger, A. J., Cowie, L. L., & Sanders, D. B. 1999, ApJ, 518, 5
- (5) Barnes, J. E. & Hernquist, L. 1996, ApJ, 471, 115
- (6) Barthel, P. D. 1989, ApJ, 336, 606
- (7) Barvainis, R., Alloin, D., & Antonnuci, R. 1989, ApJ, 337, L69
- (8) Barvainis, R., Alloin, D., Guilloteau, S. & Antonnuci, R. 1998, ApJ, 492, L13
- (9) Barvainis, R., Tacconi, L., Antonucci, R., Alloin, D., & Coleman, P. 1994, Nature, 371, 586
- (10) Bryant, P. M. & Scoville, N. Z. 1999, AJ, 117, 2632
- (11) Downes, D., Neri, R., Wiklind, T., Wilner, D. J., & Shaver, P. 1999, ApJ, 513, L1
- (12) Downes, D. & Solomon, P. M. 1998, ApJ, 507, 615
- (13) Evans, A. S., Kim, D.-C., Mazzarella, J. M., Scoville, N. Z., & Sanders, D. B. 1999, ApJ, 520, L107
- (14) Evans, A. S., Sanders, D. B., Cutri, R. M., Radford, S. J. E., Surace, J. A., Solomon, P. M., Downes, D., & Kramer, C. 1998, ApJ, 506, 205
- (15) Evans, A. S., Sanders, D. B., Mazzarella, J. M., Solomon, P. M., Downes, D., Kramer, C., & Radford, S. J. E. 1996, ApJ, 457, 658
- (16) Evans, A. S., Surace, J. A., Mazzarella, J. M., & Sanders, D. B. 2000, in preparation
- (17) Ferrarese, L. & Merritt, D. 2000, ApJ, 539, L9
- (18) Frayer, D. T., Ivison, R. J., Scoville, N. Z., Evans, A. S., Yun, M. S., Smail, I., Barger, A. J., Blain, A. W., & Kneib, J.-P. 1999, ApJ, 514, L13
- (19) Gebhardt, K. et al. 2000, ApJ, 539, L13
- (20) Guilloteau, S., Omont, A., McMahon, R. G., Cox, P., & Petitjean, P 1997, A&A, 328, L1
- (21) Güsten, R., Serabyn, E., Kasemann, C., Schinckel, A., Schneider, G., Schulz, A., & Young, K. 1993, ApJ, 402, 537
- (22) Hughes, D. H. et al. 1998, Nature, 394, 241
- (23) Kormendy, J., Bender, R., Evans, A. S., & Richstone, D. 1998, AJ, 115, 1823
- (24) Kormendy, J. & Sanders, D. B. 1992, ApJ, 390, L53
- (25) Magorrian, J. et al. 1998, AJ, 115, 2285
- (26) Ohta, K., Yamada, T., Nakanishi, K, Kohno, K., Akiyama, M., & Kawabe, R. 1996, Nature, 382, 426
- (27) Omont, A., Petitjean, P., Guilloteau, S., McMahon, R. G., Solomon, P. M., & Pecontal, E. 1996, Nature, 382, 428
- (28) Radford, S. J. E., Solomon, P. M., & Downes, D. 1991, ApJ, 368, L15
- (29) Sakamoto, K., Okumura, S. K., Ishizuki, S., & Scoville, N. Z. 1999, ApJ, 525, 691
- (30) Sanders, D. B., Scoville, N. Z., & Soifer, B. T. 1988, ApJ, 335, L1
- (31) Sanders, D. B., Scoville, N. Z., & Soifer, B. T. 1991, ApJ, 370, 158
- (32) Sanders, D. B., Scoville, N. Z., Tilanus, R. P. J., Wang, Z., & Zhou, S. 1993, in Back to the Galaxy, eds S. Holt and F. Verter (New York: AIP), 311
- (33) Sanders, D. B., Scoville, N. Z., Zensus, A., Soifer, B. T., Wilson, T. L., Zylka, R., Steppe, H. 1989b, A&A, 213, L5
- (34) Sanders, D. B., Phinney, E. S., Neugebauer, G., Soifer, B. T., & Matthews, K. 1989a, ApJ, 347, 29
- (35) Sanders, D.B., Soifer, B.T., Elias, J.H., Madore, B.F., Matthews, K., Neugebauer, G., & Scoville, N.Z. 1988a, ApJ, 325, 74
- (36) Sanders, D.B., Soifer, B.T., Elias, J.H., Neugebauer, G. & Matthews, K. 1988b, ApJ, 328, L35
- (37) Schinnerer, E., Eckart, A., & Tacconi, L. J. 1998, ApJ, 500, 147
- (38) Schmidt, M. & Green, R. F. 1993, ApJ, 269, 352
- (39) Scoville, N. Z., Carlstrom, J. C., Chandler, C. J., Phillips, J. A., Scott, S. L., Tilanus, R. P., & Wang, Z. 1992, PASP, 105, 1482
- (40) Scoville, N. Z., Padin, S., Sanders, D. B., Soifer, B. T., & Yun, M. S. 1993, ApJ, 415, 75
- (41) Scoville, N. Z. & Sanders, D. B. 1987, in Interstellar Processes, ed. D. Hollenbach & H. Thronson (Dordrecht: Reidel), 21
- (42) Smail, I, Ivison, R. J., & Blain, A. W. 1997, ApJL, 490, L5
- (43) Solomon, P. M., Radford, S. J. E., & Downes, D. 1992, Nature, 356, 318
- (44) Solomon, P. M., Downes, D., Radford, S. J. E., & Barrett, J. W. 1997, ApJ, 478, 144
- (45) Shepherd, M. C., Pearson, T. J., & Taylor, G. B. 1995, BAAS, 27, 903
- (46) Strong, A. W. et al. 1988, A&A, 207, 1
- (47) Surace, J. A. 1998, PhD Thesis, University of Hawaii
- (48) Surace, J. A. & Sanders, D. B. 2000, AJ, submitted (SS00)
- (49) Surace, J. A., Sanders, D. B., Vacca, W. D., Veilleux, S., & Mazzarella, J. M. 1998, ApJ, 492, 116
- (50) Trentham, N. 2000, MNRAS, in press
- (51) van der Marel, R. P. 1999, AJ, 117, 774
- (52) Veilleux, S., Kim, D.-C., & Sanders, D. B. 1999, ApJ, 522, 113
- (53) Veilleux, S., Kim, D.-C., Sanders, D. B., Mazzarella, J. M., & Soifer, B. T. 1995, ApJS, 98, 171
Figure Captions
Figure 1. Integrated intensity maps of the six PG QSOs detected in CO(). a) PG 0838+770 - contours are plotted as 1. The peak intensity is 0.017 Jy beam-1 and corresponds to the position RA=08:44:45.22 dec=+76:53:08.96 (J2000.0). b) PG 1119+120 - contours are plotted as 1. The peak intensity is 0.014 Jy beam-1, and corresponds to the position RA=11:21:47.12 dec=+11:44:18.30 (J2000.0). c) PG 1351+640 - contours are plotted as 1; the peak intensity is 0.0055 Jy beam-1, and corresponds to the position RA=13:53:15.62 dec=+63:45:45.72 (J2000.0). d) PG 1415+451 - contours are plotted as 1; the peak intensity is 0.051 Jy beam-1, and corresponds to the position RA=14:17:00.76 dec=+44:56:06.50 (J2000.0). e) PG 1440+356 - contours are plotted as 1; the peak intensity is 0.016 Jy beam-1, and corresponds to the position RA=14:42:07.48 dec=+35:26:22.33 (J2000.0). f) PG 1613+658 - contours are plotted as 1; the peak intensity is 0.012 Jy beam-1, and corresponds to the position RA=16:13:57.15 dec=+65:43:09.62 (J2000.0).
Figure 2. CO() spectra of the six detected PG QSOs. For PG 0838+770 and PG 1415+451, the data have been smoothed to a resolution of 16 MHz with a 8 MHz sampling. For PG 1119+120, the data have been smoothed to a resolution of 32 MHz with a 16 MHz sampling. For PG 1351+640, the data have been smoothed to a resolution of 40 MHz with a 20 MHz sampling. For PG 1440+356 and PG 1613+658, the data have been smoothed to a resolution of 24 MHz with a 12 MHz sampling.
Figure 3. A plot of the CO flux vs. the 100 m flux density for PG QSOs and ULIGs detected to date in CO. The CO data for IZw1 and Mrk 1014 were obtained from Barvainis et al. (1989) and Solomon et al. (1997), respectively. The ULIGs CO data were obtained from Sanders et al. (1989b), Sanders, Scoville, & Soifer (1988, 1991), Solomon et al. (1997), and Evans et al. (1999). The 100m flux densities were obtained from Sanders et al. (1989a, 1991) and Solomon et al. (1997). Arrows denote 3 upper limits on the CO luminosity of PG 1126-041, PG 1202+281, and PG 1402+261. Only upper limits on and currently exist for PG 0007+106, and thus PG 0007+106 is not included on the plot. Adapted from Figure 4 of Solomon et al. (1997).
Figure 4. A plot of versus redshift () for the low- PG QSO sample, a flux-limited sample ( Jy) of infrared luminous galaxies and a sample of ultraluminous infrared galaxies. The vertical dashed lines represent the upper and lower boundaries of the PG QSO sample. The LIG and ULIGs data have been obtained from the same sources as in Figure 3. Arrows denote 3 upper limits on the CO luminosity of PG 1126-041, PG 1202+281, and PG 1402+261.
Figure 5. a) A plot of vs. for the low- QSO sample, a flux-limited sample ( Jy) of infrared luminous galaxies and a sample of ultraluminous infrared galaxies. Arrows denote 3 upper limits on the CO luminosity of PG 1126-041, PG 1202+281, and PG 1402+261. b) A plot of vs. for the low- QSO sample, a flux-limited sample ( Jy) of infrared luminous galaxies and a sample of ultraluminous infrared galaxies. Arrows denote 3 lower limits on of PG 1126-041, PG 1202+281, and PG 1402+261. For simplicity, all of the cool infrared luminous galaxies are plotted as plus signs.
Figure 6. A plot of versus redshift () for the low- PG QSO sample and the high-redshift QSOs detected in CO to date. The moderate and high-redshift QSO data have been obtained from the following references: 3C 48 (: Scoville et al. 1993), H1413+117 (: Barvainis et al. 1994), MG 0414+0534 (: Barvainis et al. 1998), APM 08279+5255 (: Downes et al. 1999), BRI 1335-0415 (: Guilloteau et al. 1997), and BR 1202-0725 (: Omont et al. 1996). For gravitationally lensed QSOs, is plotted in terms of both the observed value and the intrinsic value. For MG 0414+0534, the amplification is unknown, thus MG 0414+0534 is plotted with a solid line extending downward from the observed . Adapted from Figure 3 of Frayer et al. (1999).
| Optical Coordinatesa (J2000.0) | ||||||
|---|---|---|---|---|---|---|
| Source | R.A. | Decl. | () | () | ||
| PG 0007+106 = IIIZw2 | 00:10:30.98 | +10:58:29.8 | 0.089 | 11.63 | 12.21 | 0.36 |
| PG 0838+770 | 08:44:45.36 | +76:53:09.2 | 0.131 | 11.60 | 12.01 | 0.63 |
| PG 1119+120 = Mrk 734d | 11:21:47.15 | +11:44:19.0 | 0.050 | 11.17 | 11.47 | 1.00 |
| PG 1126-041 = Mrk 1298 | 11:29:16.72 | -04:24:07.6 | 0.060 | 11.47 | 11.94 | 0.50 |
| PG 1202+281 | 12:04:42.12 | +27:54:11.8 | 0.165 | 11.78 | 12.07 | 1.05 |
| PG 1351+640 | 13:53:15.83 | +63:45:45.6 | 0.088 | 11.82 | 12.37 | 0.40 |
| PG 1402+261 = Ton182 | 14:05:16.21 | +25:55:34.1 | 0.164 | 11.85 | 12.33 | 0.49 |
| PG 1415+451 | 14:17:00.84 | +44:56:06.5 | 0.114 | 11.48 | 11.83 | 0.80 |
| PG 1440+356 = Mrk 478 | 14:42:07.48 | +35:26:23.1 | 0.079 | 11.62 | 11.95 | 0.87 |
| PG 1613+658 = Mrk 876 | 16:13:57.21 | +65:43:10.6 | 0.129 | 11.99 | 12.20 | 1.58 |
Note. — Two additional PG QSOs were previously detected as part of a survey of CO emission in “warm” ULIGs. They are PG 0157+001 (= Mrk 1014), which has L⊙, L⊙, and , and PG 0050+124 (= IZw1), which has L⊙, L⊙, and .
| Phase/Gain Calibrator | ||||||
|---|---|---|---|---|---|---|
| Source | Dates | J2000.0 | Flux | Passband | ||
| Calibrator | R.A. | Decl. | (Jy) | Calibrator | ||
| PG 0007+106 | 2000 Oct 11 | 0106+013 | 01:08:38.72 | +01:35:00.38 | 1.82 | 3c454.3,3c84 |
| 2000 Oct 12 | ||||||
| PG 0838+770 | 2000 April 24 | 1044+719 | 10:48:27.63 | +71:43:35.84 | 1.36 | 3C 273 |
| 2000 April 25 | ||||||
| PG 1119+120 | 2000 March 24 | 1055+018 | 10:58:29.57 | +01:33:58.83 | 2.11 | 3C 273 |
| 2000 April 19 | ||||||
| PG 1126-041 | 1999 May 30 | 1055+018 | 10:58:29.57 | +01:33:58.83 | 2.14 | 3C 273 |
| 1999 May 31 | ||||||
| PG 1202+281 | 1999 May 02 | 1156+295 | 11:59:31.80 | +29:14:43.37 | 3.41 | 3C 273 |
| 1999 May 03 | 3C 84,3C 273,3C 454.3 | |||||
| PG 1351+640 | 1999 May 15 | 1044+719 | 10:48:27.63 | +71:43:35.84 | 0.62 | 3C 273 |
| 1999 May 18 | ||||||
| 1999 May 20 | ||||||
| PG 1402+261 | 2000 May 21 | 1308+326 | 13:10:28.62 | +32:20:43.42 | 0.74 | 3C 273 |
| 2000 Oct 11 | 0.68 | 3c273,3c345 | ||||
| 2000 Oct 18 | 0.68 | 3c273 | ||||
| PG 1415+451 | 2000 May 07 | 1308+326 | 13:10:28.62 | +32:20:43.42 | 0.67 | 3C 273 |
| PG 1440+356 | 1999 May 22 | 1611+343 | 16:13:40.99 | +34:12:47.67 | 1.80 | 3C 273,3C 454.3 |
| 1999 June 03 | 3C 84,3C 111,3C 273, 3C 345 | |||||
| PG 1613+658 | 1999 April 19 | 1803+784 | 18:00:45.48 | +78:28:03.85 | 1.69 | 3C 273 |
| 1999 April 25 | ||||||
| Source | (H | |||||
|---|---|---|---|---|---|---|
| (Mpc) | (km s-1) | (Jy km s-1) | (K km s-2 pc2) | () | ||
| PG 0007+106 | 360 | |||||
| PG 0838+770 | 540 | 0.132 | 90 | 3.4 | ||
| PG 1119+120 | 200 | 0.050 | 260 | 4.5 | ||
| PG 1126-041 | 240 | |||||
| PG 1202+281 | 685 | |||||
| PG 1351+640 | 360 | 0.088 | 230 | 4.6 | ||
| PG 1402+261 | 680 | |||||
| PG 1415+451 | 470 | 0.114 | 50 | 3.3 | ||
| PG 1440+356 | 320 | 0.078 | 370 | 8.7 | ||
| PG 1613+658 | 530 | 0.129 | 490 | 8.5 |
Note. — Also, for Mrk 1014, K km s-1 pc2, and for IZw1, K km s-1 pc2.