The blazar GB1428+4217: a warm absorber at z=4.72?
Abstract
SAX observations of the high redshift () blazar GB 1428+4217 confirm the presence of a complex soft X–ray spectrum first seen with the ROSAT PSPC. Flattening below a rest frame energy of 5 keV can be accounted for by absorption from an equivalent column density of (cold) gas with cm-2. Below 2 keV a (variable) excess of a factor above the extrapolated absorbed spectrum is also detected. These findings are consistent with and extend to higher redshifts the correlation between increasing soft X–ray flattening and increasing , previously pointed out for large samples of radio–loud quasars. We propose that such features, including X–ray absorption, soft excess emission as well as absorption in the optical spectra, can be satisfactorily accounted for by the presence of a highly–ionized nuclear absorber with column cm-2, with properties possibly related to the conditions in the nuclear regions of the host galaxy. High energy X–ray emission consistent with the extrapolation of the medium energy spectrum is detected up to keV (rest frame).
keywords:
galaxies: active - galaxies: individual: GB 1428+4217 - X-ray: galaxies.1 Introduction
High redshift Active Galactic Nuclei (AGN) are powerful tools to study the physical and cosmological evolution of massive black holes and their relationship with their galaxy hosts. A particularly interesting class is formed by several high redshift (), X-ray bright, radio–loud quasars (Fabian et al. 1997, 1998; Moran & Helfand 1997; Zickgraf et al. 1997; Hook & McMahon 1998) which present characteristics typical of blazars. Interestingly, their X–ray spectra have been recently found to systematically show the presence of spectral flattening in the soft X–ray band. In GB 1428+4217 (Boller et al 2000), RXJ1028.6-0844 (Yuan et al 2000) and PMN 0525-3443 (Fabian et al 2000) such flattening implies, if interpreted as due to intrinsic X-ray absorption by cold gas, column densities of cm-2, cm-2and cm-2, respectively. These results appear to extend to higher redshift the trend already found in nearer (up to ) radio–loud quasars observed by ASCA and ROSAT (Cappi et al 1997, Fiore et al. 1998, Reeves & Turner 2000), the origin of which is still unclear.
In particular for the most distant object, GB 1428+4217 at , previous observations in the X–ray and radio bands have convincingly shown that this AGN is indeed a blazar (Fabian et al. 1997, 1998). Its spectral energy distribution (SED) appears similar, although more extreme, to those of lower redshift blazars of similar power and no strong evidence for different nuclear or jet conditions has been found.
Here we present the results of SAX observations of this source. They were in particular focused on: a) determining the amount and shape of the flattening and thus its nature, as the MECS allows a good determination of the medium energy X–ray spectrum; b) the detection of the high energy PDS component, which constrains the position of the –ray (inverse Compton) peak, which for GB 1428+4217 is predicted – by current models – to be at or below MeV.
In the next section we present the analysis and results of the SAX data, which are then discussed in Section 3.
2 BeppoSAX data
GB 1428+4217 was observed by SAX on 1999, Feb 4-7 (see Table 1). Signal has been detected in all three main instruments, the two imaging instruments (LECS + MECS) and the PDS one (a collimator), with exposure times of 27.3 (LECS), 90.3 (MECS) and 46.0 (PDS) ks.
A fit over the (1–10 keV) band with a simple power–law statistically agrees with the previous ASCA results (Fabian et al. 1997), both in spectral slope and in absolute flux. No evidence has been found of spectral features associated with Fe emission around keV. However, SAX data provide us with interesting information at both the lower and higher energies.
2.1 Low energy spectrum
The extrapolation of such a power–law below 1 keV (and down to 0.4 keV) is well above the data, thus indicating either absorption in excess of the Galactic one (column density cm-2) or an intrinsic flattening of the spectrum (see Fig. 1). In Table 2 we report the results of the best fits with such additional components: if intrinsic to the source the corresponding column density is cm-2. Errors are at the 90 per cent confidence level for one parameter. The quality of the data does not allow to statistically distinguish among these two possibilities. The spectral slope and intensity are marginally consistent (at 2) with those inferred from the ASCA and ROSAT data (Fabian et al 1997, Boller et al 2000).
However, below 0.4 keV, there appears to be an excess above the model (see Fig. 1). As this might be due to residuals in the background subtraction, we performed a more careful analysis and in particular re-extracted the spectrum by considering the local background. The low energy excess is still present at the 2 level and we therefore consider it, with reasonable probability, to be a real feature. This emission has not been detected in the ROSAT data, taken 2 months before, suggesting that this component might be variable on intrinsic timescales days. Note that (marginal) indications of variability were also present during the ROSAT observation itself (Boller et al 2000).


| Object | Start time | End time |
|---|---|---|
| GB 1428+4217 | 99-Feb-04 18:04:47 | 99-Feb-07 01:26:40 |
| 1ES1426+428 | 99-Feb-08 20:48:57 | 99-Feb-09 21:14:39 |
| Model | /d.o.f. | ||||
|---|---|---|---|---|---|
| (1022 cm-2) | (keV) | ||||
| Power-law + free intrinsic (0.4-10 keV) | – | – | 37.4/47 | ||
| Broken power–law (0.4-10 keV) | 36.7/46 |
2.2 PDS data
A strong signal has been also detected in the PDS band. However the flux is well above the extrapolation of the LECS+MECS power–law (see Fig. 2). We thus checked for possible contamination in the PDS field of view, and indeed found the presence of the BL Lac object 1ES1426+428 which, fortuitously, has been observed by SAX four days after GB 1428+4217 (see Table 1). In collaboration with the 1ES1426+428 proposing team, we thus tried to disentangle the contributions of the two sources in the PDS.
Also the spectrum of 1ES1426+428 is well described by a power-law below 10 keV (Costamante et al 2000), with a photon index steeper than that of GB1428+4217, . The two observed PDS spectra are however very similar and significantly flatter than 1.9 (the data from the 1ES1426+428 dataset are even slightly harder). Therefore this implies that either the dominant contribution in the PDS comes from GB1428+4217 (assuming its spectrum can be extrapolated from the LECS+MECS power–law) or that at higher X–ray energies a flatter component dominates in 1ES1426+428.
In the former case, a joint spectral fit to the datasets for GB1428+4217 and 1ES1426+428 with simple power-law models requires GB1428+4217 to vary a factor of between the two observations, i.e. over a timescale as short as 2 d, while the high redshift quasar did not show such strong and fast flux variations in the previous observations (note that they correspond to an intrinsic timescale of 8.4 hr).
In the second case, the hard PDS spectrum of the 1ES1426+428 dataset is presumed to intrinsically flatten, similarly to that observed in other BL Lac objects (e.g. PKS2155–304, Chiappetti et al 1999), where the (flat) inverse Compton component starts dominating over the (steep) synchrotron one. We then estimated the contribution from 1ES1426+428 to the PDS data of the GB1428+4217 observation iteratively, by assuming that the fluxes from the two sources are constant between the observations and that the spectrum of GB1428+4217 is a single power-law across the SAX energy range (from 0.5 to 100 keV). Uncertainties in the relative normalization factors between PDS and MECS are a problem: in order to reduce the number of free parameters and, consistent with the assumption of constant fluxes, we fixed these factors to 0.8 for both datasets.
Fig. 3 shows the 1ES1426+428 data with the best-fit power-law model for the LECS+MECS extrapolated to the PDS energy range and with a contribution from GB1428+4217 derived from its spectral fit (as in Fig. 2) 111We adopted a transmission efficiency of 46 per cent in the PDS field of view during the 1ES1426+428 observation.. Excess flux is still present in the PDS band. The surplus emission is attributed to a flat spectral component emerging above 10 keV from 1ES1426+428, i.e. the entire broad band spectrum of the BL Lac is represented by a broken power-law. Once the estimated contribution from GB1428+4217 () is added this model gives a good fit to the data ( for 263 d.o.f., see Fig. 4). Photon indices below and above the break energy of 9.26 keV are and , respectively. The corresponding spectrum for GB1428+4217 is well fitted with the single power-law ( for 54 d.o.f., Fig. 5). Although the contribution from 1ES1426+428 may be slightly overestimated (see the residuals in the PDS band in Fig. 5), the PDS data in the GB1428+4217 observation appear to be dominated by the contamination from 1ES1426+428.
The observer frame 2–10 keV fluxes for the two sources are erg cm-2 s-1 for GB1428+4217 and erg cm-2 s-1 for 1ES1426+428 (compatible with the results from the ASCA observation of 1994 Feb 6 by Kubo et al. 1998). The 20–100 keV fluxes are erg cm-2 s-1 and erg cm-2 s-1 for GB1428+4217 and 1ES1426+428, respectively.


3 Discussion
We have presented the results of the SAX observations of the most distant radio–loud X–ray luminous quasar GB 1428+4217. This has allowed us to study and reveal interesting features at the extremes of the SAX X–ray energy window.
At the higher energy end of the SAX broad band spectrum, the contamination of the PDS data from 1E1426+428 unfortunately does not allow us to determine the spectrum of GB 1428+4217 with sufficient accuracy to constrain any curvature which might indicate the position of the high energy –ray peak. However, from the decontamination we performed, the spectrum appears consistently to extend to the higher detected intrinsic energies, i.e. 280 keV in the blazar rest frame.
3.1 Low energy spectrum
At the lowest energies, keV, the SAX observations robustly confirmed the presence of a flattening in the spectrum found in the ROSAT PSPC spectrum (Boller et al. 2000). Secondly, below 0.4 keV emission a factor 20 in excess of the flattened spectrum has been found (see Fig. 1).
The origin of the flattening has been discussed in some detail by several authors (Cappi et al 1997, Fiore et al 1998, Elvis et al 1998, Boller et al 2000, Yuan et al 2000, Fabian et al 2000, Reeves & Turner 2000), but no definite conclusion could be drawn. Certainly, the detection of such feature by different instruments (ROSAT, ASCA, SAX) argues against any systematic mis-calibration effect.
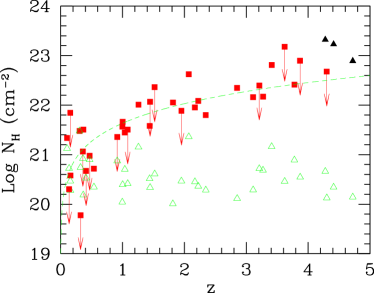
The first interesting point which has been made is that the flattening seems to be associated only with radio–loud objects, therefore suggesting its origin to be intrinsic. The number of good quality X-ray spectra of radio–quiet quasars at is unfortunately limited. However, the recent results by Vignali et al (2000), combined with the findings by Reeves & Turner (2000), imply that in only 2 out of 15 radio–quiet quasars (in the range ) a positive detection of flattening corresponding to cm-2 has been established, despite the biased selection of X–ray loud sources. For comparison, 5 out of 6 radio–loud objects in the same redshift range have equivalent cm-2 (see Fig. 6). We therefore favour the possibility that the flattening is due to an intrinsic property of the source, possibly associated with the radio–loudness phenomenon. Nevertheless we note that radio-loud objects tend to be more X–ray luminous and so yield the best spectra at a given redshift and therefore in the following we also discuss the possible role of absorption of intergalactic origin.
We consider it unlikely that large (galactic) scale gas is responsible for the X–ray absorption, given the large masses of gas implied by such hypothesis as well as the lack of any clear connection with the radio–loud phenomenon. Therefore in the following we concentrate on the nuclear and/or cosmological properties which could account for such feature.
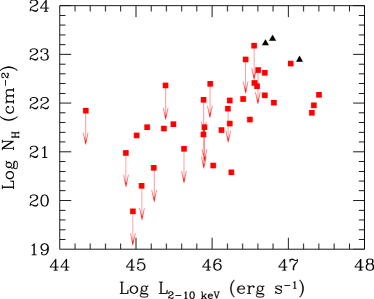
A further key piece of information is the presence of a systematic trend of the flattening in the spectra of radio–loud quasars to increase with redshift (Cappi et al 1997, Fiore et al. 1998, Reeves & Turner 2000). The inclusion of the recent results on RXJ1028.6-0844 (Yuan et al 2000), PMN0525-3343 (Fabian et al 2000) and GB1428+4217 itself strengthens and extends this behavior up to , as shown in Fig. 6. Although no correlation between the flattening and other spectral property has been previously found, we stress the possible presence of a significant trend of increasing with increasing hard X–ray (intrinsic 2–10 keV band) luminosity, as can be argued from Fig. 7. Unfortunately small statistics do not allow us to disentangle the redshift and luminosity dependences.
In Fig. 6 we also show the line-of-sight value of due to the intergalactic medium (IGM) assuming solar abundances. If the IGM was enriched by redshifts of about 4 to the same metallicity as clusters of galaxies then the correlation with redshift could be explained. As discussed in the ROSAT PSPC work on GB 1428+4217 (Boller et al 2000) this conclusion does not agree with observations of the metallicity of the Lyman forest. Only if there was a strong correlation between enrichment and temperature of the IGM phase might some agreement occur, but even then the enrichment requirements would be huge.
A more plausible interpretation of the apparent correlation shown in Fig. 6 would then be that it arises from the detection limit for absorption in present X-ray detectors. For example, a limit of a few times cm-2 at would corresponds to a few times cm-2 at redshift , which roughly scales with the points in Fig. 6.


Let us now examine the alternative hypothesis of an intrinsic origin of the flattening. As discussed by Fabian et al (2000), on nuclear scales this might arise because of: a) the characteristic shape of the energy distribution of particles and/or photons which are believed to be responsible – through inverse Compton scattering on soft external photon field – for the high energy spectral component in blazars; b) absorption by nuclear, highly ionized, gas.
Let us therefore consider in turn how these two possibilities can account for the spectral characteristics discussed so far. These, including the results of the present analysis on GB 1428+4217, can be summarized as: a spectral flattening below 5 keV, soft excess emission below 2.3 keV, a possible connection with radio–loudness/jets and with the redshift and/or X–ray luminosity, an optical spectrum showing evidence for absorption features (Ly -NV and CIV) (Hook & McMahon 1998; see Fabian et al 2000 for the similar case of PMN 0525-3433). We recall that the latter (optical) feature is indeed typically seen in outflows (Brandt, Laor & Wills 2000).
Within scenario a), which implicitly links the observed properties with blazar–type sources, the flattening could be caused by several effects, such as: an intrinsic break in the low energy part of the non–thermal electron distribution (e.g. caused by incomplete cooling) which would require a break energy few c2; a paucity in the (relative) amount of synchrotron photons which are scattered at higher energies (synchrotron self–Compton emission) and thus typically contribute to the soft-to-medium X–ray band flux, filling the ‘depression’ between the synchrotron and inverse Compton components in blazars (e.g. Sikora, Begelman & Rees 1994) 222Note that an increase in the dominance of the external Compton component would be also naturally associated with an increase in the source X–ray luminosity.; the intrinsic flattening of the external soft photon energy distribution below its peak, which translates into a flattening in the scattered inverse Compton component at soft X–ray energies. Also the presence of a soft X–ray excess, as seen in GB 1428+4217 and RXJ1028.6-0844 could be consistent with this scenario as due to either Comptonization of a cold electron component in the jet (bulk Compton emission, Sikora et al. 1994) or the high energy tail of the soft radiation field.
Nevertheless a serious problem arises with this scenario, if the soft X–ray spectrum is produced by low energy electrons. In fact, while the uncertainties in the determination of the spectral shape/absorption in the high redshift objects does not allow the presence of any spectral variation to be found, soft X–ray flux variability has been established for GB1428+4217 on timescales 1 d (Fabian et al. 1999). Although strong and fast variability is of course expected in blazars thanks to the enhancement caused by relativistic beaming, the cooling timescales of electrons emitting at soft X–ray energies - as discussed in scenario a) - would greatly exceed the observed variability timescale.
In scenario b), i.e. absorption by small scale gas, such as nuclear absorbing winds/outflows, the flattening and the soft X–ray excess can be successfully accounted for by the presence of a warm/highly ionized absorber with a column density of the order of cm-2 and (where the ionization parameter is defined as ; is the ionizing luminosity from 1 to 1000 Ryd). In Fig. 8 we report the results of the spectral fitting to the SAX data with such a model, as calculated using the photoionization code CLOUDY C90.04 (Ferland et al. 1998). The predicted model spectrum (see Fig. 8) clearly shows the presence of edges at 1.5 keV (FeXX-FeXXIV) and keV (Mg). Most absorption is due to oxygen. Solar metallicity has been assumed in these nuclear regions. .
We further explored the viability of such scenario by considering previous observations of GB 1428+4217. In Fig. 9 the contour plots for the two critical parameters of the model – the gas column density and the ionization state – are shown for the BeppoSAX, ASCA and ROSAT PSPC data (Fabian et al. 1997, 1998). A common range of (marginally consistent) parameters, around and column densities , can be found for the three datasets. Some of the variation may be due to spectral variability among the observations.
Note that if this picture is correct the lack of significant extinction in the optical–UV bands (similar to what seen in PMN 0525-3433) also requires that the absorbing gas is highly ionized and/or rich in metals and lacking of dust. (The observed intense and fast variability is inconsistent with being caused by the postulated warm absorber itself and therefore has to be ascribed to the primary emission from relativistic plasma.)
The ionization parameter , column density and luminosity along our line of sight to GB 1428+4217 require the warm absorber to be located at an estimated distance from the nucleus of less than about 200 pc. The increase of the amount of absorption with redshift but also with luminosity, argues for an even larger increase in the amount of gas, plausibly associated with a large (super–Eddington) accretion rate of infalling gas in the early stages of nuclear activity, and/or outflows possibly confining powerful radio jets. The warm absorber may also be the inner part of the dense interstellar medium of the young host galaxy (see Fabian 1999 for a more general discussion).
If this gas completely envelopes the source then its mass is , where the radius is pc. It is possible that in directions well away from the axis of the blazar jet the surrounding gas is of low ionization and so opaque to all but hard X-rays and that only in the jet direction the X-ray intensity is powerful enough to ionize the gas. Therefore in more extreme/high sources, such gas might completely hide the presence of activity in the soft-to-medium X–ray band. Under such conditions of high optical depths also the nuclear disk radiation might be partly reflected back by the gas, thus enhancing the nuclear radiation energy density. The high amount of scattering gas should also allow significant detection of nuclear emission in the most powerful radio galaxies.
The decrease in absorption seen in objects below a redshift (see Fig. 6) may be associated with this gas being consumed by star formation, or having been blown out of the host by a quasar wind. The predominance of absorption in radio–loud objects could be related to them having more massive host galaxies (and thus it being more difficult to blow the gas away) and/or to the radio phase being associated with the quasar youth.
Observations of GB 1428+4217 and similar high redshift blazars with high sensitivity and energy resolution instruments, such as those provided by XMM, will soon allow us to determine whether these conditions are ubiquitous in high sources. They should robustly test the proposed warm absorber scenario by detecting the edges predicted in Fig. 8 and so enable us to infer the physical conditions in the active nuclear regions of primeval galaxies.
4 Acknowledgments
We thank Gary Ferland for the use of his code CLOUDY. The Royal Society (ACF) and the Italian MURST and ASI grant ARS-99-74 (AC) are thanked for financial support.
References
- [1] Boller Th., Fabian A.C., Brandt W.N., Freyberg M.J., 2000, MNRAS, 315, L23
- [2] Brandt W.N., Laor A., Wills B., 2000, ApJ, 528, 637
- [3] Cappi M., Matsuoka M., Comastri A., Brinkmann W., Elvis M., Palumbo G.G.C., Vignali C., 1997, ApJ, 478, 492
- [4] Chiappetti L., et al, 1999, ApJ, 521, 552
- [5] Costamante L., et al., 2000, A&A, submitted
- [6] Elvis M., Fiore F., Giommi P., Padovani P., 1998, ApJ, 492, 91
- [7] Fabian A.C., 1999, MNRAS, 308, L39
- [8] Fabian A.C., Brandt W.N., McMahon R.G., Hook I., 1997, MNRAS, 291, L5
- [9] Fabian A.C., Iwasawa K., McMahon R.G., Celotti A., Brandt W.N., Hook I.M., 1998, MNRAS, 295, L25
- [10] Fabian A.C., Celotti A., Iwasawa K., Carilli C.L., McMahon R.G., Brandt N.W., Ghisellini G., Hook I.M., 2000, MNRAS, in press
- [11] Fabian A.C., Celotti A., Pooley G., Iwasawa K., Brandt N.W., McMahon R.G., Hoenig M.D., 2000, MNRAS, 308, L6
- [12] Ferland G.J, Korista K.T., Verner D.A., ferguson J.W., Kingdon J.B., Verner E.M., 1998, PASP, 110, 761
- [13] Fiore F., Elvis M., Giommi P., Padovani P., 1998, ApJ, 492, 79
- [14] Hook I., McMahon R.G., 1998, MNRAS, 294, L7
- [15] Kubo H., Takahashi T., Madejski G., Tashiro M., Makino F., Inoue S., Takahara F., 1998, ApJ, 504, 693
- [16] Moran E.C., Helfand D.J., 1997, ApJ, 484, L95
- [17] Reeves J.N., Turner M.J.L., 2000, MNRAS, in press (astro-ph/0003080)
- [18] Sikora M., Begelman M., Rees M.J., 1994, ApJ, 421, 153
- [19] Vignali C., Comastri A., Cappi M., Palumbo G.G.C., Matsuoka M., 2000 (astro-ph/0007163)
- [20] Yuan W., Matsuoka M., Wang T., Ueno S., Kubo H., Mihara T., 2000, ApJ, submitted (astro-ph/0006148)
- [21] Zickgraf F.-J., Voges W., Krautter J., Thiering I., Appenzeller I., Mujica R., Serrano A., 1997, A&A, 323, L21