Circumnuclear kinematics in NGC 5248: the origin of nuclear spiral arms
Abstract
We present for the first time a two-dimensional velocity field of the central region of the grand-design spiral galaxy NGC 5248, at 0.9 arcsec spatial resolution. The H velocity field is dominated by circular rotation. While no systematic streaming motions are seen in the area of the nuclear grand-design spiral or the circumnuclear ring, the amplitude of residual velocities, after subtracting a model circular velocity field, reaches 20 km s-1 in projection. The rotation curve levels out at around 140 km s-1, after a well-resolved and rather shallow rise. We have generated an analytical model for the nuclear spiral and fitted it to our observations to obtain estimates of the pattern speed of the spiral and the sound speed in the central region of NGC 5248. Our results are consistent with a low pattern speed, suggesting that the nuclear spiral rotates with the same rate as the main spiral structure in NGC 5248, and thus that the spiral structure is coupled from scales of a few hundred parsecs to several kiloparsecs. We have also compared the observed structure and kinematics between the nuclear regions of NGC 5248 and M100. Several similarities and differences are discussed, including the location of the peak emission regions on major and minor axes, and the spiral arm streaming motions. We find no kinematic evidence for a presence of a nuclear bar in NGC 5248.
keywords:
galaxies: individual: NGC 5248 – galaxies: ISM – galaxies: kinematics and dynamics – galaxies: spiral – galaxies: structure.1 MOTIVATION
During the past 40 years considerable progress has been made in understanding the origin, nature and influence of spiral structure in disc galaxies. The most commonly accepted theories now include the density wave theory (Lin & Shu 1964; Lin, Yuan & Shu 1969) and its modal version (Bertin et al. 1989a,b), which can generate spiral structures from about 1 kpc to the outskirts of the disc. If dynamical (Lindblad) resonances exist, the spiral structure in the collisionless stellar component is permitted to exist between the inner and outer resonances. The dissipative gas component is not subject to these boundary conditions. Therefore, gaseous spiral structure may extend to much smaller spatial scales.
The lack of spatial resolution both in observations and numerical models of disc galaxies has hitherto hampered the study of spiral structure in the central regions. The advent of near-infrared (NIR) and optical imaging with the Hubble Space Telescope (HST) and adaptive optics (AO) on 4-meter class ground-based telescopes is now breaking the resolution barrier, allowing us to resolve galaxies within about 15 Mpc down to scales of 10 pc or less. One of the main results from the increasing resolving power has been the discovery of nuclear spirals (e.g., Ford et al. 1994; Rouan et al. 1998; Phillips et al. 1996; Grillmair et al. 1997; Devereux, Ford & Jacoby 1997; Dopita et al. 1997; Elmegreen et al. 1998; Carollo, Stiavelli & Mack 1998; Malkan, Gorjian & Tam 1998; Laine et al. 1999; Regan & Mulchaey 1999; Martini & Pogge 1999). At the same time, the availability of powerful computers allows us to create detailed numerical models which can resolve the spiral structure down to 1–10 pc scales (e.g., Englmaier & Shlosman 2000).
As an example of the recent breakthroughs, Laine et al. (1999) reported the first detection of grand-design nuclear spiral structure on scales of a few hundred pc in the nuclear region of the spiral galaxy NGC 5248. In fact, spiral structure exists in this galaxy on at least four different spatial scales, extending from the few hundred pc scale minispiral to the 10 kpc scale weak, outer arms. In between, there are the classical optically bright spiral arms, and at the inner end of these, but outside the circumnuclear starburst ring, red spiral arms which are seen in NIR colour index maps. These arms are reminiscent of the dust lanes often found along galactic bars. Since our discovery of grand-design nuclear spiral arms, a few more have been found, e.g., by Martini & Pogge (1999; UGC 12138 and NGC 7682). A few galaxies in the sample of Regan & Mulchaey (1999) possess nuclear spiral dust lanes reminiscent of grand-design spirals.
Spiral patterns in the nuclear region can be formed by at least three processes. First, a spiral density wave mode can grow in the inner disc. In this case, the spiral density wave can exist between the Lindblad resonances corresponding to the spiral pattern speed. Such a wave would be formed by long wavelength density waves in the stellar and gaseous component. To avoid perturbations from the dynamically independent spiral pattern at larger scales, the nuclear spiral pattern must exist inside the inner Lindblad resonance (ILR) of the outer spiral pattern, thus requiring a much higher pattern speed for the nuclear spiral pattern. Second, the spiral pattern can be driven by the outer spiral pattern, as described and modelled by Englmaier & Shlosman (2000). In this case, the potential well must be shallow enough to prevent the spiral from becoming too tightly wound and destroyed by dissipation. The pattern speeds of the large and nuclear spirals are equal. Finally, the nuclear spiral may be formed by an acoustic instability (Elmegreen et al. 1998), but this leads to irregular spiral patterns with multiple arms.
We have obtained high resolution (0.9 arcsec), two-dimensional line of sight velocity data for the central region of the spiral galaxy NGC 5248. In the following sections we discuss the similarities and differences between the H morphology and kinematics in the core regions of NGC 5248 and M100, and use the kinematical data, in conjunction with the earlier high resolution NIR colour index image (Laine et al. 1999), to obtain estimates of the pattern speed of the nuclear spiral and the sound speed of the ISM.
2 OBSERVATIONS
We used the TAURUS II instrument in Fabry–Pérot (FP) mode on the 4.2m William Herschel Telescope on La Palma during the nights of 1998 September 2 and 3. We windowed the TEK2 CCD camera to a size of pixels with a scale of 0.28 arcsec pixel-1. The nights were photometric with sub-arcsecond seeing. We used the appropriately redshifted narrow-band H filter (=6589Å, =15Å, using the galaxy’s systemic velocity =1153 km s-1; NED) as an order-sorting filter. We performed wavelength and phase calibration by observing a calibration lamp before and after each science exposure. We subtracted the background sky value from each separate plane, and shifted the planes to the same position using fits to foreground stars. This produced two data cubes of 300 pixels 55 ‘planes’ in wavelength, separated by 0.414 Å, or 18.9 km s-1.
We combined the two individual datasets by placing the two cubes at the same grid position using fits to the positions of foreground stars in the original cubes and averaging the individual planes in the data cubes. Astrometry was performed by comparing the position of a bright foreground star to its position in the HST Guide Star Catalog.

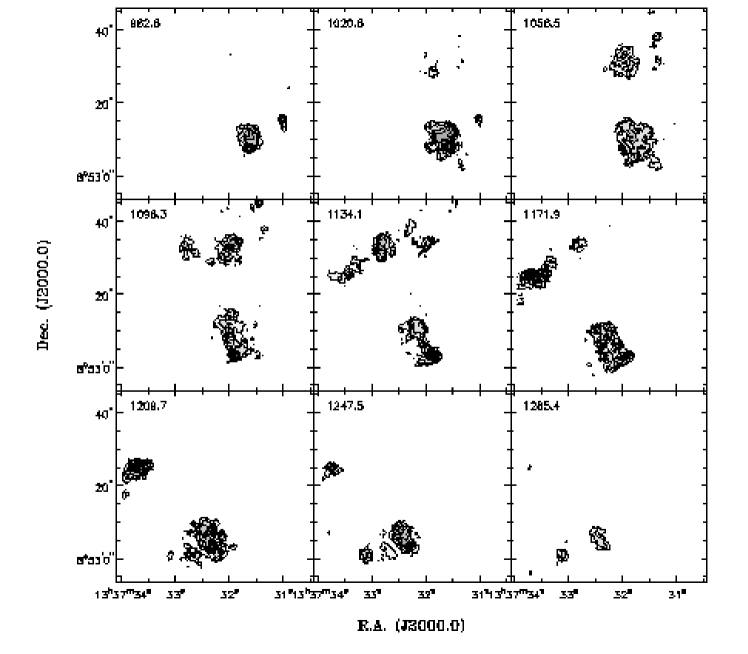
We determined which channels of the dataset were free of H line emission after smoothing the data cube to a resolution of 4 arcsec 4 arcsec. Subsequently, we subtracted the continuum emission after fitting the continuum to the 24 line-free channels in the data cube. The H emission as a function of increasing wavelength, or velocity, is shown in a way equivalent to the standard channel maps in radio astronomy in Fig. 1. Only the circumnuclear area is shown, including the starburst ring.
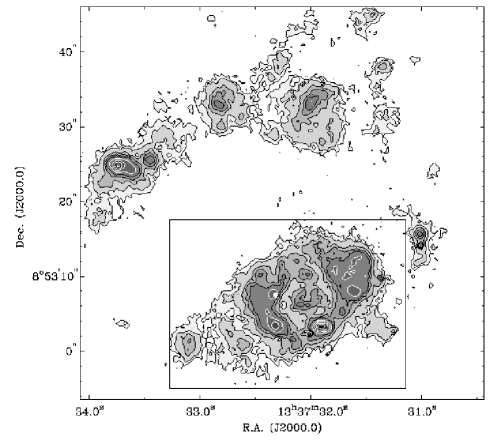
We have performed both a Gaussian fitting of the spectra in the cube and a moment analysis in the central region of NGC 5248. We choose to display the moment maps here after comparing them to the map made by fitting Gaussians, because the first moment map shows smoother velocity contours than the velocity map derived by Gaussian fitting. We also made sure that the fitted spectra were symmetrical and single-valued. The resulting moment 0 map (H emission distribution) is shown in Fig. 2. After smoothing the data cube to 2.5 arcsec spatial resolution, we created another set of moment maps. The resulting smoothed velocity field is shown in Fig. 3. The detailed procedure used to produce the moment maps is described in Knapen (1997) and Knapen et al. (2000).
3 RESULTS
3.1 H distribution

The dominating feature in the H distribution of Fig. 2 is the circumnuclear ring with a major axis diameter of 14 arcsec. An HST image of this ring (Maoz et al. 1996) shows that it consists of several tightly-packed ‘super star clusters’. Our H image shows that inside the ring at about 1 arcsec radius another pseudo-ring encircles the nucleus. This pseudo-ring is probably associated with the dusty nuclear grand-design spiral (Laine et al. 1999). However, a detailed comparison with the dust spiral is not possible because of the spatial resolutions that differ by almost a factor of 10. We note, however, that the emission is clumpy, and that there is an apparent break in the north side of both the main ring and the nuclear pseudo-ring. Since no reliable measures of the two-dimensional distribution of extinction are available, we are unable to say whether such a break corresponds to an asymmetric distribution of dust. Assuming that the spiral arms in NGC 5248 are trailing, and considering that the southwest side of the ring is receding with respect to the systemic velocity (see Section 3.2), the north-eastern side of the ring will be the far side if the ring is in the plane of the main galaxy disc. Therefore, the optical depth may be larger in the northern side, which would lead to weaker observed emission.
The most intense peaks of H emission occur near the major axis, towards southeast and northwest, and also on the minor axis towards southwest. This situation is reminiscent of the morphology found in M100 by Knapen et al. 2000. They found peaks near the major and minor axis of the ring and argued that these locations represent regions of crowding of the gas orbits in the vicinity of the inner inner Lindblad resonance (IILR).
Outside the circumnuclear ring, most of the detected emission comes from the northern section of the main spiral arm, which is also bright in the optical broad-band images of NGC 5248. Since we are mostly interested in the circumnuclear region, we will not discuss the detected H emission coming from the main optical spiral arms any further.
3.2 H kinematics

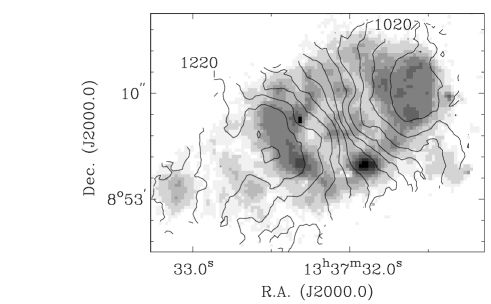
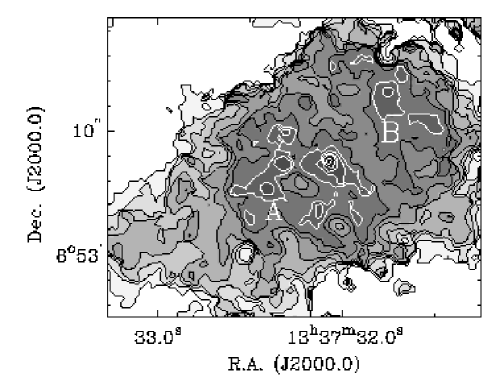
Figure 3 shows the velocity field of the nuclear region of NGC 5248, smoothed to a resolution of 2.5 arcsec. The regular velocity contours in the Figure indicate a relatively undisturbed velocity field without any strong noncircular streaming motions. The velocity contours in the first moment image are closing on both sides of the nucleus, implying that the rotation curve is declining. To study the significance of noncircular (e.g., streaming) motions, we made an image showing the difference between our best fitting purely circular rotation model (see Section 4) and the observed velocity field. The resulting image is shown in Figure 4. The largest regions of noncircular motion have amplitudes of around 30 km s-1 (in the north-eastern corner) and 15 – 20 km s-1 towards south and west. Deprojected, these velocities correspond to deviations from pure circular motions with a magnitude up to 50 km s-1. The regions towards the northeast and west coincide with areas where spiral arms, coming in from the outer disc, merge with the circumnuclear ring, and therefore they could indicate the motions of gas coming in to the ring along the spiral arms. Indeed, if we assume that the spiral arms are trailing, the northeastern side of the galaxy is the far side, and negative residual velocities on that side mean inflow, whereas the positive residual velocities towards the west also imply inflow. This is consistent with the kinematical density wave theory which predicts inward streaming motions along the spiral arms inside the corotation resonance (Rohlfs 1977). This claim is supported by the smoothed (to 2.5 arcsec) second moment map (Fig. 5) which shows increased velocity dispersions in two regions labelled ‘A’ and ‘B’ in Figure 5. These two regions closely coincide with the peak noncircular motions in Fig. 4 and with the peak H intensity.
The lack of systematic noncircular streaming motions is strikingly different from what was found in M100 (Knapen et al. 2000). There, characteristic S-shaped contours of constant velocities were explained with the help of the (nuclear) bar and additional velocity components indicating streaming motions near the spiral armlets. An S-shaped signature is not recognizable in Fig. 3, most likely because bars in NGC 5248 are absent or weak (not recognized on images). However, there is a hint of streaming motions connected with the incoming arms, as discussed above, towards west-southwest at about 10 arcsec radius and perhaps towards east-northeast at a comparable radius. The physical sense of these deviations was discussed above. Therefore, the incoming spiral arms are most likely part of a grand-design density wave system and not flocculent spiral arms.
The rotation curve was made from the unsmoothed data (with 0.9 arcsec resolution) to avoid smoothing out the rise near the nucleus. We followed the procedure of tilted ring fitting described by Begeman (1989). We used only points within 60∘ of the kinematical major axis (to ignore radial motions which are best seen near the kinematical minor axis) and cosine weighting (where is the azimuthal distance from the kinematical major axis in the plane of the galaxy). We fixed the inclination at 50∘, the position angle at 120∘, the systemic velocity at 1125 km s-1, and the position of the centre at R.A. (J2000.0) = 13h 37m 3205, Dec. (J2000.0) = 8°53′702, all obtained from runs in which the parameter in question was left as a free parameter. The rotation curve itself is shown in Figure 7, where the distances have been converted into parsecs, assuming that 1 arcsec = 75 pc (obtained using a distance of 15 Mpc, which in turn was obtained from the Hubble law with = 75 km s-1 Mpc-1).

The rotation curve shows a relatively shallow rise, which is spatially clearly resolved. The peak rotation velocity occurs at about 145 km s-1 at 7 arcsec or 0.55 kpc distance from the centre and then the rotation velocity starts a gradual decline. The shallow rise in NGC 5248 is in sharp contrast to the rotation curve derived for M100 from similar Fabry–Perot observations by Knapen et al. (2000), which most likely implies a smaller mass in the central region of NGC 5248 compared to M100. There are hints that a shallow rise in the rotation curve may be directly related to the presence of nuclear spiral arms (Knapen, Laine & Relaño 1999). No recently observed large-scale rotation curve is available for comparison with the kinematic behaviour of the large-scale disk of NGC 5248.
In order to obtain an estimate for the pattern speed of the spiral, we generated an analytical model using the description of Englmaier & Shlosman (2000). The following section gives a detailed description of the modeling.
4 MODEL FOR THE NUCLEAR SPIRAL
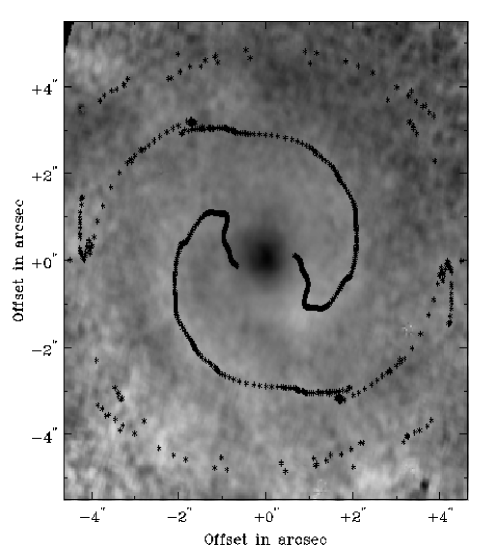
Recently, Englmaier & Shlosman (2000) calculated analytical models, based on the density wave theory, for nuclear spiral structure which is an extension of the main spiral structure of a disc galaxy, inwards of the dynamical inner Lindblad resonances (ILRs) which typically occur in the inner kiloparsec of a galaxy. The main free parameters in the models are the pattern speed of the spiral (or bar) and the sound speed of the interstellar medium (ISM), where the sound speed is a measure of the turbulent kinematic motions. Cowie (1980) has shown that this approach, which is wide-spread in the literature, is in fact a fair description of the ISM. Any given combination of those two parameters, together with a specified rotation curve (or mass distribution) will produce a model with a unique run of the spiral pitch angle. To test this theory in the context of a grand-design nuclear spiral galaxy, we have used the imaging data from Laine et al. (1999; Figure 6) and the kinematical data from the current paper to investigate whether the pattern speed of the nuclear spiral is consistent with the pattern speed of the main spiral structure at larger radii, and whether the sound speed of the ISM is close to the values measured at radii larger than 1 kpc in disc galaxies (typically 10 km s-1). Since the contrast of the observed dusty spiral arm pattern to its background is extremely low (0.05 mag in the image of Laine et al. 1999), we assume that the mass of the nuclear spiral is very small and thus the self-gravity of the spiral arm can be neglected in our models.
To compare the density wave theory prediction with our kinematical (current paper) and morphological (Laine et al. 1999) observations, we calculated the pitch angle of the spiral arms as a function of radius in two ways. First, we measured the pitch angle by eye-ball fitting a logarithmic spiral at the radii where the pattern is well defined (from about 1.8 arcsec to 3.4 arcsec). Second, we computed the phase angle for the mode as a function of radius. While the former method concentrated on fitting the dark dust lanes, the latter method tried to fit a sine curve to the azimuthal variation of the spiral in the colour index image. The eye-ball fits were in agreement with the =2 phase angle but less reliable. Therefore, in the following we only use the latter fit. From the fitted phase angle we computed the pitch angle shown in Fig. 9 by the solid line with filled dots. While we can recognize a grand-design spiral between 0.13 and 0.25 kpc, a few perturbations are visible as waves in the curve. At larger radii the spiral is lost in noise, while at smaller radii the emission is dominated by the central bulge-like component. As can been seen in Fig. 9, the pitch angle is in good agreement with the theoretical prediction for all the considered fits to the rotation curve data (the three model curves in Fig. 9).
To calculate the density wave theory prediction we made a non-parametric fit to the H velocity data using the Wahba & Wendelberger method (Wahba & Wendelberger 1980; Arnaboldi et al. 1998). With this algorithm we minimize the quantity
| (1) |
where N is the number of data points, is the measured rotation velocity of the ith data point and is its measurement error. The linear operator decribes the Gaussian seeing. The resulting intrinsic velocity field is represented by ; is the field as it would be observed with Gaussian seeing. Therefore the first term of is a in the observational space. The second term of is a regularising functional in intrinsic space which prevents artificial amplification of noise in the solution. The smoothing parameter was determined using a Fourier analysis of the recovered intrinsic velocity field.
The advantage of this method is that the result is not biased towards a prescribed model. Individual errors in the rotation curve were taken into account. Figure 7 shows three such model fits. The first fit (long-dashed line) ignores the inner two points which are affected by the limited spatial resolution. The other two fits were obtained using all the data points but also taking into account a Gaussian-type point spread function corresponding to 0.9 arcsec seeing. Figure 7 shows the intrinsic rotation curves convolved with the Gaussian seeing functional with a low smoothing (solid line) and a higher smoothing (dotted curve). Both are consistent with the Fourier-determined smoothing parameter. From the intrinsic rotation curve, we calculated the linear resonance diagram shown in Fig. 8. The use of a linear resonance diagram in this galaxy is justified because a nonaxisymmetric bar perturbation in this galaxy is relatively weak. Since the calculation of the epicyclic frequency requires the first derivative of , small bumps in the rotation curve are amplified in the curve (or ‘ILR curve’). With enough smoothing allowed in the Wahba & Wendelberger method fit, we obtained a smooth ILR curve without any bumps (see Fig. 8, solid and dotted curves). Since the locations of ILRs are defined to be the radii where the ILR curves cross the bar/spiral pattern speed, the ILR curves in Fig. 8 are consistent with only one ILR inside the one at 1.2 kpc found by Patsis, Grosbøl & Hiotelis (1997), because the ILR curves rise inwards of 1.2 kpc and then dip only once to a feasible bar pattern speed value ( 20 km s-1). There may be another ILR inside of 0.15 kpc but the spiral also disappears there. Therefore, the use of the nuclear spiral theory developed by Englmaier & Shlosman (2000) is justified.
Finally, we computed the wave number for the = 2 mode from the linearized dispersion relation of non-self-gravitating gaseous discs embedded in an external frozen potential:
| (2) |
where is the circular velocity, the pattern speed, and the sound speed. Note that near a Lindblad resonance the dispersion relation is not applicable and formally the wave number becomes zero. The wave number can then be used to derive the pitch angle
| (3) |
which will be independent of time.
The resulting pitch angle depends on only two fit parameters: the pattern speed and the sound speed (Fig. 9). For the fit without the two innermost points, the pitch angle stays mostly constant over the radii where the spiral is observed. However, for fits which take all the points and the point spread function into account, the spiral opens up closer to the centre, i.e., the pitch angle increases rapidly. The best agreement with the observed pitch angle was obtained when the sound speed was within a narrow range of (9–16 km s-1), regardless of the inclusion or not of the innermost two data points in the rotation curve or smoothing, and assuming that the pattern speed (20 km s-1 kpc-1, which after correcting for our distance of 15.4 Mpc instead of 10.5 Mpc as used by Patsis et al. becomes 13 km s-1 kpc-1) found by Patsis et al. (1997) for the outer spiral also holds for the nuclear spiral. Inside 1.5 arcsec (or 110 pc) the predicted pitch angle depends strongly on the amount of smoothing applied and on how the two innermost data points are treated.
5 DISCUSSION AND CONCLUSIONS
As recent high spatial resolution observations have shown, nuclear spiral structure is abundant and at least in some cases takes on the morphology of grand-design spiral arms (Laine et al. 1999; Martini & Pogge 1999; Regan & Mulchaey 1999). Therefore, it is important to understand how such organized structures can survive in the circumnuclear region where the dynamical time scales are much shorter than in the outer disc. While flocculent spiral arms may be explained with the help of the acoustic instabilities (Elmegreen et al. 1998), grand-design structure may only form either in an independent, rapidly rotating component inside the inner ILR, or as a gaseous extension of the outer spiral structure, thus forming part of the overall spiral pattern that stretches from a few hundred pc scale up to several kpc. We can distinguish between the latter two possibilities by measuring the pattern speed of the nuclear spiral structure. NGC 5248 is a natural candidate for such a study.
In this paper we have shown that the circumnuclear velocity field of NGC 5248 is mostly regular, consistent with circular rotation, but inflow motion with amplitude up to 50 km s-1 is seen near the points where the outer spiral arms merge with the ring. Additional velocity perturbations are seen at the minor axis, but only on one side of the galaxy. The peak H emission areas occur on the major axis and on the minor axis, similarly to what was observed in M100. In contrast to M100, however, we do not see any systematic large-scale streaming motions which could be associated with a nuclear bar or tightly wound nuclear spirals. Bar streaming motions are probably absent because there is no obvious bar in NGC 5248 at any observed spatial scale. The absence of streaming motions in the ring may mean that the character of the ring is different from that of M100, which possesses tightly-wound pseudo-spirals that form a ring-like feature. Alternatively, it may reflect evolutionary and possibly even age differences in the circumnuclear rings.
We have also shown that the nuclear grand-design spiral structure may be driven by one spiral pattern rotating at the same speed and extending from scales of about 100 pc to several kiloparsecs. Galaxy structures which rotate with the same pattern speed over a factor of ten in radial distance have been seen before in barred spiral galaxies, where the bar and its associated ring system rotate with the same pattern speed (e.g., ESO 507–16; Byrd, Ousley & Dalla Piazza 1998). Our model for the spiral pattern holds for a pattern speed of 13 km s-1 kpc-1, which corresponds to the pattern speed derived by Patsis, Grosbøl & Hiotelis (1997), after correction for the difference in the galaxy distances that were used by them and by us. Specifically, high pattern speed values do not agree with the observed arm pitch angle. The acoustic spiral theory of Elmegreen et al. (1998) is not applicable to the nuclear spiral structure of NGC 5248 since the spirals produced by that mechanism are chaotic and consist of several branches ( 2).
Our best fit for the sound speed of the ISM, 9–16 km s-1, rules out any large increases in the sound speed in the nuclear few hundred parsec region of NGC 5248 and is consistent with values derived for the ISM in our Galaxy.
Acknowledgments
This research has made use of the NASA/IPAC Extragalactic Database (NED) which is operated by the Jet Propulsion Laboratory, California Institute of Technology, under contract with the National Aeronautics and Space Administration. The William Herschel Telescope is operated on the island of La Palma by the Isaac Newton Group in the Spanish Observatorio del Roque de los Muchachos of the Instituto de Astrofísica de Canarias.
References
- [Arnaboldi et al. 1998] Arnaboldi M., Freeman K. C., Gerhard O., Matthias M., Kudritzki R. P., Méndez R. H., Capaccioli M., Ford H., 1998, ApJ, 507, 759
- [Begeman 1989] Begeman K. G., 1989, A&A, 223, 47
- [Bertin et al. 1989a] Bertin G., Lin C. C., Lowe S. A., Thurstans R. P., 1989a, ApJ, 338, 78
- [Bertin et al. 1989b] Bertin G., Lin C. C., Lowe S. A., Thurstans R. P., 1989b, ApJ, 338, 104
- [Byrd et al. 1998] Byrd G. G., Ousley D., Dalla Piazza C., 1998, MNRAS, 298, 78
- [Carollo et al. 1998] Carollo C. M., Stiavelli M., Mack J., 1998, AJ, 116, 68
- [Cowie 1980] Cowie L. L., 1980, ApJ, 236, 868
- [Devereux et al. 1997] Devereux N., Ford H., Jacoby G., 1997, ApJ, 481, L71
- [Dopita et al. 1997] Dopita M. A., Koratkar A. P., Allen M. G., Tsvetanov Z. I., Ford H. C., Bicknell G. V., Sutherland R. S., 1997, ApJ, 490, 202
- [Elmegreen et al.1998] Elmegreen B. G. et al., 1998, ApJ, 503, L119
- [Englmaier & Shlosman 2000] Englmaier P., Shlosman, I., 2000, ApJ, 528, 677
- [Ford et al. 1994] Ford H. C. et al., 1994, ApJ, 435, L27
- [Grillmair et al. 1997] Grillmair C. J., Faber S. M., Lauer T. R., Hester J. J., Lynds C. R., O’Neil E. J., Jr., Scowen P. A., 1997, AJ, 113, 225
- [Knapen 1997] Knapen J. H., 1997, MNRAS, 286, 403
- [Knapen et al. 1999] Knapen J. H., Laine S., Relaño, M., 1999, Ap & SS, 269, 605
- [Knapen et al. 2000] Knapen J. H., Shlosman I., Heller C. H., Rand R. J., Beckman J. E., Rozas, M., 2000, ApJ, 528, 219
- [Laine 1999] Laine S., Knapen J. H., Pérez–Ramírez D., Doyon R., Nadeau D., 1999, MNRAS, 302, L33
- [Lin & Shu 1964] Lin C. C., Shu F. H., 1964, ApJ, 140, 646
- [Lin et al. 1969] Lin C. C., Yuan C., Shu F. H., 1969, ApJ, 155, 721
- [Malkan et al. 1998] Malkan M., Gorjian V., Tam, R., 1998, ApJS, 117, 25
- [Maoz et al. 1996] Maoz D., Barth A. J., Sternberg A., Filippenko A. V., Ho L. C., Macchetto F. D., Rix H.–W., Schneider D. P., 1996, AJ, 111, 2248
- [Martini & Pogge 1999] Martini P., Pogge R. W., 1999, AJ, 118, 2646
- [Patsis et al. 1997] Patsis P., Grosbøl P., Hiotelis N., 1997, A&A, 323, 762
- [Phillips et al. 1996] Phillips A. C., Illingworth G. D., MacKenty J. W., Franx M., 1996, AJ, 111, 1566
- [Regan & Mulchaey 1999] Regan M. W., Mulchaey J. S., 1999, AJ, 117, 2676
- [Rohlfs 1977] Rohlfs K., 1977, Lectures on Density Wave Theory, Springer, Berlin
- [Rouan et al. 1998] Rouan D., Rigaut F., Alloin D., Doyon R., Lai O., Crampton D., Gendron E., Arsenault R., 1998, A&A, 339, 687
- [Wahba & Wendelberger 1980] Wahba G., Wendelberger J., 1980, Monthly Weather Review, 108, 1122
This paper has been typeseet from a TeX/LaTeX file prepared by the author.