Discovery of a kHz QPO in 2S 0918–549
Abstract
We report the discovery of a kilohertz quasi–periodic oscillation (kHz QPO) in the low–mass X–ray binary (LMXB) 2S 0918–549. The kHz QPO has a frequency of 11569 Hz, a FWHM of 7020 Hz, and a fractional rms amplitude of 18%2%. We also detected for the first time a type I X–ray burst in this source. The compact object must therefore be a neutron star. Finally, we were able to classify the source as an atoll source exhibiting the full complement of spectral/timing states of this class (island and banana). From the peak burst flux an upper limit on the persistent luminosity can be derived of 0.5% of the Eddington luminosity, making 2S 0918–549 one of the least luminous LMXBs showing a kHz QPO. We compare the fractional rms amplitudes of the upper kHz QPO across the ensemble of LMXBs. We find a strong anticorrelation with luminosity. In LMXBs with luminosities 100 times lower than those of Z–sources, the fractional rms amplitude is a factor 10 larger.
1 Introduction
Observations with the Rossi X–ray Timing Explorer (RXTE) satellite have revealed the presence of several quasi–periodic phenomena in the Fourier power spectra of low–mass X–ray binaries (LMXBs). They occur on timescales similar to the dynamical timescale near a neutron star, i.e. at frequencies around 1000 Hz. Kilohertz quasi–periodic oscillations (kHz QPOs) have been discovered in more than 20 sources (van der Klis et al. 1996a,b; Strohmayer, Zhang, & Swank 1996; Strohmayer et al. 1996; see for the most recent review van der Klis 2000). In several LMXBs nearly coherent oscillations were discovered during type I X-ray bursts (Strohmayer et al. 1996; for a review see Swank 2000); these burst oscillations presumably occur at frequencies close to the neutron star spin frequency (Strohmayer et al. 1996). Recently, another high frequency quasi-periodic phenomenon was discovered in the power spectra of three LMXBs (Jonker, Méndez, & van der Klis 2000).
The kHz QPOs are nearly always found in pairs, although in a few sources so far only one kHz QPO has been found (Zhang et al. 1998; Marshall & Markwardt 1999; Homan & van der Klis 2000). Their frequencies vary over several hundred Hz on timescales of hours to days; in the best studied sources, it is found that the frequency separation of the twin kHz QPOs, , decreases monotonically by 50–100 Hz over the observed frequency range as the frequency of the kHz QPO increases (see e.g. van der Klis et al. 1997; Méndez et al. 1998; Méndez, van der Klis, & van Paradijs 1998; Méndez & van der Klis 1999); observations of the kHz QPO frequencies in the other sources are consistent with this trend (Jonker et al. 1998, Psaltis et al. 1998).
Various models exist for these QPOs. Immediately after their discovery a beat frequency model was proposed (Strohmayer et al. 1996), of which the sonic–point model is the most current (Miller, Lamb, & Psaltis 1998; revised by Lamb & Miller 2000). Later, Stella & Vietri (1999) proposed the relativistic precession model (but see Marković & Lamb 2000) and Osherovich & Titarchuk (1999) introduced the two–oscillator model. In the latter model the QPO at (the lower kHz QPO) occurs at the Keplerian frequency of material orbiting the neutron star, whereas in the other two models the QPO at (the upper kHz QPO) is the one that is Keplerian. Recently, Psaltis & Norman (2000) proposed the transition layer model in which the twin kHz QPO peaks arise due to disk oscillations at frequencies close to those predicted by the relativistic precession model.
In this Letter, we report the discovery of a kHz QPO and a type I X–ray burst in 2S 0918–549. The source turns out to be one of the least luminous kHz QPO sources, however, the fractional rms amplitude of the QPO is quite high. We study the dependence of the fractional rms amplitudes of the upper kHz QPO on source luminosity across the ensemble of LMXBs and show that they are strongly anticorrelated.
2 Observations and analysis
We have used observations obtained with the proportional counter array (PCA; Jahoda et al. 1996) onboard the RXTE satellite (Bradt, Rothschild, & Swank 1993). A log of the observations and the average source count rates at the time of the observation can be found in Table 1. In total 75 ksec of data were used in our analysis. Data were obtained in four different modes. The Standard 1 and 2 modes, which are always operational, respectively provide data with a time resolution of 0.125 seconds in just one energy bin and 16 seconds in 129 energy bins covering the effective PCA 2 to 60 keV range. Additionally, data were obtained using the mode providing the highest time resolution (), combined with the full energy resolution RXTE can provide (256 energy bins covering the 2 to 60 keV; the GoodXenon mode). This mode saturates on count rates higher than 8000 counts per second.
In order to follow spectral variations we created color–color diagrams (CDs) by plotting a soft color vs. a hard color. The soft color was defined as the ratio between the count rates in the 3.5–6.4 keV and 2–3.5 keV energy band; the hard color was defined as that between the 9.7–16.0 keV and 6.4–9.7 keV energy band. The data were background subtracted but no dead–time corrections were applied (the dead–time is less than 2%). The colors of the 1997 observations were corrected for PCA gain changes, using Crab observations obtained in May 1997, and May 2000. Assuming the Crab is constant, observed color changes of the Crab between the observations of May 1997 and May 2000 should reflect changes of the instrument’s spectral response. The observed changes in Crab were 6% in the soft color and 1% in the hard color. The colors were converted to those which would have been detected by the PCA on May 2000 (cf. di Salvo et al. 2000). Residual color errors due to the differences between the spectra of Crab and 2S 0918–549 are less than the statistical errors.
We calculated Fast Fourier Transforms with a Nyquist frequency of 4096 Hz of data segments of 16 seconds (2–60 keV). The power density spectra were averaged and fitted with a function consisting of Lorentzians (to represent peaks arising in the power spectrum due to QPOs), a constant to account for the power due to Poisson counting statistics, and an exponentially cutoff power law to represent the noise component apparent at low frequencies. Errors on the fit parameters were calculated using (1 single parameter). The 95% confidence upper limits were determined using .
3 Results
The color–color diagram of 2S 0918–549 (see Fig. 1; left) resembles that of an atoll source. The squares represent the average of 256 s of data from observations 1–10, the filled circles are 128 s averages from observation 11, and the open circles are 128 s averages from observations 12 and 13. Together with the timing properties (described below) it is clear that the squares represent the Island state and the open and filled circles the banana branch of an atoll source.

The average power spectrum of observations 1–10 combined (see Fig. 1, right, top) shows a strong band limited noise component, which could be described using an exponentially cutoff power law with a fractional rms amplitude of 26%1% (integrated over 0.1–100 Hz, 2–60 keV), a power law index of 0.470.05, and a cutoff frequeny of 216 Hz. We derived a 95% confidence upper limit on the presence of a kHz QPO with a full-width at half maximum (FWHM) 100 Hz in the range of 300–1200 Hz of 30% (rms).
We discovered a kHz QPO at 11569 Hz, with a FWHM of 6823 Hz, and a fractional rms amplitude of 18%2% (2–60 keV) in the average power spectrum of observation 11 (see Fig. 2). In addition, the average power spectrum of observation 11 (Fig. 1, right, bottom) shows a peaked noise component at a frequency of 252 Hz, with a fractional rms amplitude of 17%2%, and a FWHM of 226 Hz. To investigate the peak noise component and the kHz QPO further, we also calculated power spectra using data in the 4.0–18.0 keV energy band. The values measured in the 4.0–18.0 keV energy band are the same within the errors, although the significance of the detection of the kHz QPO is somewhat higher (6.1 compared to 5.7 in the 2–60 keV band). We subdivided the 4.0–18.0 keV power spectra of observation 11 in two parts. The frequency of the kHz QPO increased from 11269 Hz in the first part of observation 11 to 1218 Hz at the end. The source moved further up the banana branch, from an average hard and soft color of 0.4520.003 and 2.490.01 to 0.4310.003 and 2.640.01, respectively. The background subtracted count rate in the 4.0–18.0 keV energy band, the FWHM, and the fractional rms amplitude are consistent with being the same in the two parts. The properties of the peaked noise component were consistent with being the same in the two selections.

No power spectral components were detected in the average power spectrum of observations 12 and 13 combined. We derived an upper limit on the presence of a 100 Hz wide kHz QPO of 13% rms in the range between 300–1200 Hz in both the 2–60 keV and the 4.0–18.0 keV energy band, and an upper limit of 5%–6% on the presence of a power law component at frequencies in the range of 0.1 to 100 Hz in both the 2–60 keV and the 4.0–18.0 keV energy band, with a power law index of 1.0.
During observation 11 a type I X–ray burst occurred (see Fig. 3). This is the first detection of a burst in 2S 0918–549, and establishes the compact object as a neutron star. As apparent in Fig. 3 the burst profile was complex, with a smooth exponential decay with an e-folding time of 8.950.05 s beginning seconds after the initial rise. Due to the very high count rates of more than 20000 counts per second (3 detector count rate) the GoodXenon mode saturated. The total count rate displayed in Fig. 3 is for the 0.125 s Standard 1 data which were not affected by this saturation. During the part of the decay where the count rate was less than 8000 counts per second spectral analysis shows cooling of the blackbody spectral component. Using the 16 s Standard 2 mode we derive a flux for the 16 s bin containing the burst peak of erg cm-2 s-1 (2-20 keV). Since the mean count rate in this 16 s time bin is a factor of 2.5 lower than the peak count rate as measured using the 1/8 s bin of the Standard 1 observations, we use this factor to improve our estimation of the peak burst flux. We did not correct for the deadtime effects which become important at the count rates at the peak of the burst (25%), this provides a lower limit on the peak flux. The pre–burst flux is less than erg cm-2 s-1 (2-20 keV). So, the persistent emission of the source when it is on the lower banana branch is less than 0.5 percent of the Eddington luminosity. Assuming the peak burst flux to be isotropic and at or below the Eddington limit of erg s-1 we derive an upper limit to the distance of 4.9 kpc.

4 Discussion
We discovered a kHz QPO at a frequency of 1156 Hz with a fractional rms amplitude of nearly 20% (2–60 keV) in the X–ray emission of the LMXB 2S 0918–549. For the first time in this source a type I X–ray burst was detected, establishing the nature of the compact object in 2S 0918–549 as a neutron star. We derived an upper limit to the persistent luminosity when the source is on the lower banana branch of 0.005 making 2S 0918–549 one of the least luminous LMXBs in which a kHz QPO has been observed. The spectral and timing properties indicate that this source is a low–luminous atoll source, displaying the full complement of spectral and timing states (island state and a full banana branch). Similar to other kHz QPO sources, e.g. Méndez et al. (1999), the kHz QPO was only observed when the source was on the lower part of the banana branch. Its frequency changed from 8 Hz to 121820 Hz, when the source moved further on the banana branch, similar to other atoll sources (e.g. Méndez et al. 1999). Its frequency is similar to the frequency of the upper kHz QPO in other atoll sources in a similar lower–banana state (e.g. di Salvo et al. 2000, Méndez et al. 1999). The frequency of the lower kHz QPO is usually lower in that part of the CD. Furthermore, when both QPOs of the twin kHz QPOs are detected simultaneously the frequency of the lower kHz QPO has never been found at frequencies larger than 900 Hz in any LMXB (see van der Klis 2000). Therefore, we conclude that this kHz QPO is most likely the upper peak of the kHz QPO pair which is detected in most other LMXBs.
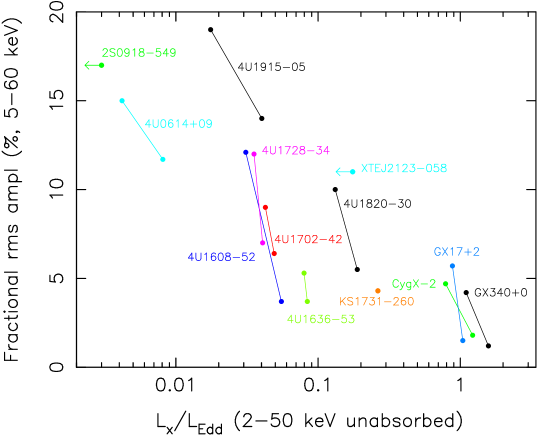
After 4U 0614+109, 2S 0918–549 is another example of a very low luminous LMXB whose kHz QPOs are strong, whereas in the most luminous LMBXs, the Z–sources, the kHz QPOs tend to be weak (see also the review of van der Klis 2000). To further investigate this, we compared the fractional rms amplitudes of the kHz QPO in 2S 0918–549 with those of the upper kHz QPO in other LMXBs. In order to account for the fact that in a given source the fractional rms amplitude of the kHz QPO changes as its frequency changes we measured the fractional rms amplitude at both the lowest and highest frequency at which the upper kHz QPO is found. From extensive studies for several sources it is clear that the fractional rms amplitude of the upper kHz QPO decreases monotonically as the frequency of the upper peak increases (e.g. Wijnands et al. 1997, Jonker et al. 1998, Wijnands et al. 1998, Méndez, van der Klis, & Ford 2000). This ensures that the method we used will yield a good indication of the range in fractional rms amplitude spanned in each source. The sample we studied here contains only those sources for which a significant detection of the upper kHz QPO in the 5–60 keV energy range was possible (4U 0614+09; Ford et al. 1996; 4U 1915–05, Boirin et al. 2000; 4U 1728–34, Strohmayer, Zhang, & Swank 1996; 4U 1608–52, Méndez et al. 1998; 4U 1702–42, Markwardt et al. 1999; 4U 1636–53, Zhang et al. 1996; 4U 1820–30, Smale et al. 1996; XTE J2123–058, Homan et al. 1999; KS 1731–260, Wijnands & van der Klis 1997), or in case of the Z-sources, the 5-60 keV fractional rms amplitude that was reported in the literature (Cyg X–2, Wijnands et al. 1998; GX 17+2, Wijnands et al. 1997; GX 340+0, Jonker et al. 1998). Sco X–1 was not included since the fractional rms amplitude of the QPOs can not be calculated accurately at present due to the severe dead-time effects present in this source. We calculated the 5–60 keV fractional rms amplitude in order to avoid as much as possible systematic effects on the derived fractional rms amplitudes of the peaks due to the different values towards the various sources.
The range in fractional rms amplitude of the upper kHz QPO in each source is plotted in Fig. 4 as a function of the simultaneously measured luminosity (for the distances and the method used to calculate these luminosities see Ford et al. 2000 and references therein; the distance to 4U 1915–05 was taken from Smale et al. 1988). It is apparent that the upper kHz QPOs detected in low–luminosity sources have relatively large fractional rms amplitudes, when compared with the fractional rms amplitude of the kHz QPO in the bright LMXBs (e.g. the Z-sources). The frequencies of the end–points for each source are given in Table 2.
Van Paradijs & van der Klis (1994) found that the hardness, defined as the ratio of counts between the 40–80 keV band and the 13–25 keV band, is in neutron star LMXBs correlated with the X–ray luminosity. This suggests that the X–ray flux variability of the source at the kHz QPO frequency is correlated with the hardness in that band (see also Ford et al. 1997). Within a source a similar correlation between the fractional rms amplitude of the upper kHz QPO and the hardness of the energy spectrum has been found; the harder the source the higher the fractional rms amplitude of the upper kHz QPO (e.g. 4U 0614+091, Ford et al. 1997, van Straaten et al. 2000; 4U 1608–52, Méndez et al. 1999; Aql X–1, Reig et al. 2000; 4U 1728–34, Di Salvo et al. 2000; Cyg X–2, Wijnands et al. 1998; GX 17+2, Wijnands et al. 1997; GX 340+0, Jonker et al. 1998).
A two–component accretion flow (radially and through a disk, Gosh and Lamb 1979) has been considered to explain that the frequency of the kHz QPO does not depend on source luminosity (Ford et al. 2000). The observed anticorrelation between the fractional rms amplitude of the upper kHz QPO and the source luminosity cannot solely be explained by an increase of an unmodulated part of the accretion flow towards higher source luminosity, since the increase in luminosity is too large compared with the decrease in fractional rms amplitude. Therefore, this cannot explain the findings of Ford et al. (2000). The same conclusion was drawn by Méndez et al. (2000) on other grounds. It is important to consider the anticorrelation presented in this work and the absence of a correlation reported by Ford et al. (2000) in mechanisms producing kHz QPOs.
References
- Boirin et al. (1999) Boirin, L., Barret, D., Olive, J.F., Bloser, P.F., Grindlay, J.E. 2000, A&A, 361, 121
- Bradt, Rothschild & Swank (1993) Bradt, H.V., Rothschild, R.E., Swank, J.H. 1993, A&AS, 97, 355
- Di Salvo et al. (2000) Di Salvo, T., Méndez, M., van der Klis, M., Ford, E.C., Robba, N.R., 2000, in press
- Ford et al. (1996) Ford, E., Kaaret, P., Tavani, M., Harmon, B.A., Zhang, S.N., Barret, D., Bloser, P., Grindlay, J. 1996, IAU Circ, No. 6426
- Ford et al. (1997) Ford, E., Kaaret, P., Chen, K., Tavani, M., Barret, D., Bloser, P., Grindlay, J., Harmon, B.A., Paciesas, W.S., Zhang, S.N. 1997 ApJ, 486, L47
- Ford & van der Klis (1998) Ford, E.C., van der Klis, M. 1998, ApJ, 506, L39
- Ford et al. (2000) Ford, E.C., van der Klis, M., Wijnands, R., Homan, J., Jonker, P.G., van Paradijs, J. 2000, ApJ, 537, 368
- Hasinger & van der Klis (1989) Hasinger, G., & van der Klis, M. 1989, A&A, 225, 79
- Homan et al. (1999) Homan, J., Méndez, M., Wijnands, R., van der Klis, M., van Paradijs, J. 1999, ApJ, 513, L119
- Jahoda et al. (1996) Jahoda, K., Swank, J.H., Giles, A.B., Stark, M.J., Strohmayer, T., Zhang, W., Morgan, E.H. 1996, SPIE, 2808, 59
- Jonker et al. (1998) Jonker, P.G., Wijnands, R., van der Klis, M., Psaltis, D., Kuulkers, E., Lamb, F.K. 1998, ApJ, 499, L191
- Jonker, Méndez, & van der Klis (2000) Jonker, P.G., Méndez, M., van der Klis, M. 2000, ApJ, 540, L29
- Lamb & Miller (2000) Lamb, F.K., Miller, M.C. 2000, ApJ, submitted
- Leahy et al. (1983) Leahy, D.A., Darbro, W., Elsner, R.F., Weisskopf, M.C., Sutherland, P.G., Kahn, S., & Grindlay, J.E. 1983, ApJ, 266, 160
- Lee & Miller (1998) Lee, H.C., Miller, G.S. 1998, MNRAS, 299, 479
- Marković & Lamb (2000) Marković, D., Lamb, F.K. 2000, submitted to MNRAS
- Markwardt, Strohmayer, & Swank (1999) Markwardt, C.B., Strohmayer, T.E., Swank, J.H. 1999, ApJ, 512, L125
- Marshall & Markwardt (1999) Marshall, F.E., Markwardt, C.B. 1999, IAU Circ. 7103
- Méndez et al. (1998) Méndez, M., van der Klis, M., van Paradijs, J., Lewin, W.H.G., Vaughan, B.A., Kuulkers, E., Zhang, W., Lamb, F.K., Psaltis, D. 1998a, ApJ, 494, 65
- Méndez et al. (1998) Méndez, M., van der Klis, M., Wijnands, R., Ford, E.C., van Paradijs, J., Vaughan, B.A. 1998b, ApJ, 505, L23
- Méndez et al. (1999) Méndez, M., van der Klis, M., Ford, E.C., Wijnands, R., van Paradijs, J. 1999, ApJ, 51, L49
- Méndez & van der Klis (1999) Méndez, M.. & van der Klis, M. 1999 ApJ, 517, 51
- Méndez, van der Klis, & van Paradijs (1999) Méndez, M.. & van der Klis, M., van Paradijs, J. 1998, ApJ, 506, L117
- Méndez, van der Klis, Ford, Wijnands & van Paradijs (1999) Méndez, M.. & van der Klis, M., Ford, E.C., Wijnands, R., van Paradijs, J. 1999, ApJ, 511, L49
- Méndez, van der Klis, Ford (2000) Méndez, M., van der Klis, M., Ford, E.C. 2000, ApJ, submitted, astro-ph/0006245
- Miller, Lamb, & Psaltis (1998) Miller, M.C., Lamb, F.K., Psaltis, D. 1998, ApJ, 508, 791
- Osherovich & Titarchuk (1999) Osherovich, V., Titarchuk, L. 1999, ApJ, 522, L113
- Psaltis et al. (1998) Psaltis, D., Méndez, M., Wijnands, R., Homan, J., Jonker, P.G., van der Klis, M., Lam, F.K., Kuulkers, E., van Paradijs, J., Lewin, W.H.G. 1998, ApJ, 501, 95
- Psaltis, Belloni, van der Klis (1999) Psaltis, D., Belloni, T., van der Klis, M. 1999, ApJ, 520, 262
- Psaltis & Norman (2000) Psaltis, D., Norman, C. 2000, ApJ, submitted
- Reig, P. et al. (2000) Reig, P., Méndez, M., van der Klis, M., & Ford, E.C. 2000, ApJ, 530, 916
- Smale, Zhang, & White (1996) Smale, A.P., Zhang, W., White, N.E. 1996, IAU Circ. No. 6507
- Stella, & Vietri (1998) Stella, L., Vietri, M. 1998, ApJ, 492, L59
- Stella, & Vietri (1999) Stella, L., Vietri, M. 1999, Phys. Rev. Lett, 82, 17
- Strohmayer, Zhang, & Swank (1996) Strohmayer, T.E., Zhang, W., Swank, J.H. 1996, IAU Circ. 6320
- Strohmayer et al. (1996) Strohmayer, T.E., Zhang, W., Swank, J.H., Smale, A., Titarchuk, L., & Day, C. 1996, ApJ, 469, L9
- Swank (2000) Swank, J.H. 2000, “Cosmic Explosions”, Proceedings of the 10th October Astrophysics in Maryland, AIP Conf. Proceedings 522, ed. S.S. Holt & W.W. Zhang, (AIP: Woodbury, N. Y.), 2000, astro-ph 0005498
- (38) van der Klis, M., Swank, J., Zhang, W., Jahoda, L., Morgan, E.H., Lewin, W.H.G., Vaughan, B., van Paradijs, J. 1996a, IAU Circ. 6319
- (39) van der Klis, M., Swank, J.H., Zhang, W., Jahoda, L., Morgan, E.H., Lewin, W.H.G., Vaughan, B., van Paradijs, J. 1996b, ApJ, 469
- van der Klis (1997) van der Klis, M., Wijnands, R.A.D., Horne, K., & Chen, W. 1997, ApJ, 481, L97
- van der Klis (2000) van der Klis, M. 2000, A&AAR, 38, 717
- van Paradijs & van der Klis (1994) van Paradijs, J., van der Klis, M. 1994, A&A, 281, L17
- van Paradijs et al. (1996) van Paradijs, J., et al. 1996, IAU Circ. No. 6336
- van Straaten et al. (2000) van Straaten, S., Ford, E.C., van der Klis, M., Méndez, M., Kaaret, P. 2000, ApJ, 540, 1049
- Wijnands & van der Klis (1997) Wijnands, R., & van der Klis, M. 1997, ApJ, 482, L65
- Wijnands et al. (1997) Wijnands, R., Homan, J., van der Klis, Méndez, M., Kuulkers, E., van Paradijs, J., Lewin, W.H.G., Lamb, F.K., Psaltis, D., Vaughan, B. 1997, ApJ, 490, L157
- Wijnands et al. (1998) Wijnands, R., Homan, J., van der Klis, M., Kuulkers, E., van Paradijs, J., Lewin, W.H.G., Lamb, F.K., Psaltis, D., Vaughan, B. 1998, ApJ, 493, L87
- Zhang et al. (1996) Zhang, W., Lapidus, I., White, N.E., Titarchuk, L. 1996, ApJ, 473, L135
- Zhang et al. (1998) Zhang, W., Jahoda, K., Kelley, R.L., Strohmayer, T.E., Swank, J.H. 1998, ApJ, 495, L9
| Observation | Date & | Amount of data | Average count rate | |
|---|---|---|---|---|
| ID | Start time (UTC) | (ksec) | cnts/sec (2–60 keV) | |
| 1 | 20071-11-01-02 | 02-05-1997 23:57 | 4.2 | 36 |
| 2 | 20071-11-01-03 | 03-05-1997 02:15 | 2.1 | 36 |
| 3 | 20071-11-01-04 | 03-05-1997 06:42 | 1.8 | 45 |
| 4 | 20071-11-01-05 | 03-05-1997 08:26 | 1.4 | 50 |
| 5 | 20071-11-01-06 | 04-05-1997 08:27 | 1.5 | 53 |
| 6 | 20071-11-01-00 | 04-05-1997 22:41 | 11.3 | 47 |
| 7 | 20071-11-01-01 | 05-05-1997 22:16 | 6.0 | 48 |
| 8 | 20071-11-01-07 | 09-05-1997 10:10 | 2.4 | 54 |
| 9 | 20064-06-01-00 | 15-08-1997 01:38 | 4.8 | 84 |
| 10 | 20064-06-02-00 | 21-09-1997 22:51 | 5.0 | 68 |
| 11 | 50060-01-01-00 | 12-05-2000 12:24 | 30.0 | 135 |
| 12 | 50060-01-01-01 | 14-05-2000 19:43 | 2.1 | 187 |
| 13 | 50060-01-01-02 | 15-05-2000 04:59 | 2.4 | 208 |
| Source name | Lowest frequency | Highest frequency |
|---|---|---|
| upper kHz (Hz) | upper kHz (Hz) | |
| 2S 0918–549 | 11569 | 11569 |
| 4U 0614+09 | 42113 | 11615 |
| 4U 1915–05 | 54214 | 10138 |
| 4U 1608–52 | 8834 | 10918 |
| 4U 1728–34 | 5527 | 113913 |
| 4U 1702–42 | 10009 | 105911 |
| 4U 1636–53 | 11524 | 121311 |
| 4U 1820–30 | 6754 | 10504 |
| XTE J2123–058 | 11298 | 11298 |
| KS 1731–260 | 11763 | 11763 |
| Cyg X–2 | 73119 | 100715 |
| GX 17+2 | 6459 | 10868 |
| GX 340+0 | 53570 | 84020 |