The Cosmic Star-Formation History:
The UV finds most
1 Introduction
The assigned subtitle of this talk was “The UV Takes it All!” The absurdity of that subtitle must have been obvious to many conference participants when they first read the program, and now, after four days of talks, I hope it is obvious to everyone here. The UV cannot possibly “take all” of the cosmic star-formation history. Data from low and high redshift alike overwhelmingly show that rapidly star-forming galaxies emit the bulk of their bolometric luminosities in the far-infrared, not the UV. Some extremely luminous high-redshift galaxies have not been detected in the UV at all (see, e.g., Hughes’ and Blain’s contributions to these proceedings); many others dominate relatively short m exposures but are barely detected in even the deepest (rest-frame) UV images. I was asked by the organizers to make a case for studying the distant universe in the rest-frame UV, and I will; but I cannot pretend that UV surveys are the best way to study all star-forming galaxies at high redshift. Some fraction of the stars in the universe formed in extremely dusty galaxies that are best studied in the infrared. Nevertheless the available data—even IR data!—suggest that most stars formed in objects that are easiest to detect in the rest-frame ultraviolet, and so I have modified the subtitle of this talk to a statement I am prepared to defend. UV observations may not detect most of the luminosity emitted by any single galaxy at high redshift, and may not detect some high redshift galaxies at all, but the average high redshift star-forming galaxy is much more easily detected through its UV radiation than its dust emission. In the first half of my talk I will lay out the arguments supporting that statement. In the second half I will discuss the attempts to estimate star-formation rates for UV-selected galaxies after they have been detected. It is here (as we shall see) that dust obscuration poses the greatest problems for UV surveys.
2 The UV finds most
Fig. 1 helps illustrate the argument I’m going to make. The plot shows the level of dust obscuration observed among different types of star-forming galaxies in the local universe. The abscissa, , is the sum of the star-formation luminosity that is and that is not absorbed by dust; this provides a rough measure of total star-formation rate. The ordinate, , is the ratio of obscured to unobscured star-formation luminosity; it provides a rough measure of the level of dust obscuration. Here is an estimate of a galaxy’s bolometric dust luminosity and evaluated at Å. The well known trend of increasing dust obscuration with increasing star-formation rate is obvious. The expression (dashed line) provides a crude fit to the data. Some galaxies in the local universe are very heavily obscured (), but these galaxies are rare and together they host only % of the known local star-formationsm . The vast majority of local star-formation occurs among less luminous and less obscured spiral and starburst galaxies.
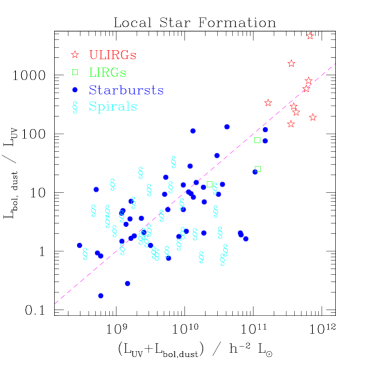
Now imagine taking the local universe and placing it at redshift (say) and observing it at m with SCUBA. The only galaxies bright enough to detect would be the heavily dust-obscured ultraluminous infrared galaxies (ULIRGs) with . When analyzing this hypothetical m data it would be natural to conclude that all high-redshift star formation occurred in galaxies similar to the ones that were detected, in extremely dusty galaxies that would be difficult to detect in the rest-frame UV. But this conclusion would be wrong. It relies on the false assumption that the comparatively faint galaxies which host most of the star formation would be as dusty as the ultraluminous galaxies that were detected; it neglects the strong correlation of dust opacity and star-formation rate.
The real situation has obvious similarities to this hypothetical case. The typical galaxy detected by SCUBA appears to be heavily obscured by dust, orders of magnitude brighter in the (rest-frame) far-IR than the UV. But only 25% of the m background is produced by objects brighter than SCUBA’s 2mJy detection limitbcs , and only 8% by objects bright enough to be included in the mJy samples of bcr and crlwb —the only SCUBA samples with well established optical counterparts111see also siobk and iet , which discuss sub-mm samples selected in a different way but with the similarly bright typical m fluxes.. The 5mJy sub-mm/radio samples have provided the strongest support for the popular belief that most high-redshift star formation occurred in extremely dusty galaxies that are not detected in UV surveys, but the fraction of high-redshift star formation that occurs in the extremely dusty objects of the 5mJy sub-mm/radio samples is as small as the fraction of local star formation that occurs in LIRGs and ULIRGs. Should we believe that objects in the 5mJy samples are any more representative of typical star-forming galaxies at high redshift than LIRGs and ULIRGs are of star-forming galaxies in the local universe?
The data suggest that they are not. In the remainder of this section I will argue that dust opacity and star-formation rate are as strongly correlated at high redshift as in the local universe, and that this implies that the fainter galaxies responsible for most of the m background are much less obscured in the UV than typical objects detected by SCUBA, sufficiently unobscured, in fact, that their UV emission is easier to detect than their dust emission.
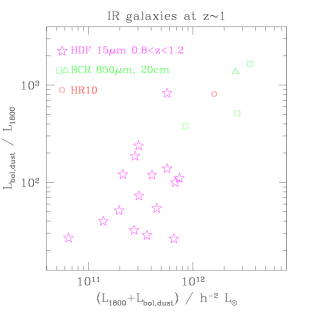
The correlation of dust opacity and star-formation rate can be established at by comparing galaxies selected at m with SCUBA to those selected at m with ISO. Owing to the strength of the 7.7 and m PAH emission features, star-forming galaxies are comparatively bright at m and deep m ISO images detect dusty galaxies many times fainter than those detectable with SCUBA. Fig. 2a compares the star-formation rates and dust opacities of five m sources at to those of the 17 ISO m sources in the HDF with . The trend of decreasing dust opacity with decreasing star-formation rate is clear; the comparatively faint ISO sources are nowhere near as heavily dust obscured as the brighter mJy m sources. Since neither m nor m observations detect a very large fraction of galaxies’ bolometric dust luminosities, large multiplicative corrections were required when estimating for this plot from the detected m or m fluxes. I adopted corrections that assume these galaxies have dust SEDs similar to those of rapidly star-forming galaxies in the local universe. Details can be found in as ; but the main result, the correlation of star-formation rate and dust opacity, is insensitive to the adopted corrections: altering moves galaxies diagonally on the plot, parallel to the correlation.
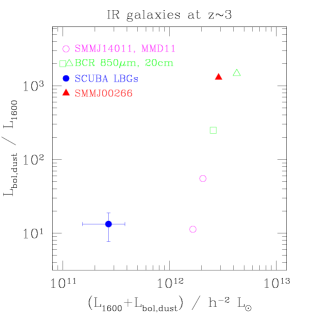
At higher redshifts, galaxies’ PAH features are redshifted well outside ISO’s m window and another approach is required to measure the dust opacity of galaxies significantly less luminous than the 5mJy SCUBA sources. One approach, adopted by cet00 and cet01 , is to point SCUBA at many galaxies which are too faint to be detected individually, and sum the measured fluxes. The 33 Lyman-break galaxies at targeted by cet00 and cet01 were found to have a mean m flux of mJy, corresponding to for the , cosmology adopted throughout. The mean value of for the galaxies in this sample was 13, significantly lower than the values observed among brighter SCUBA sources at similar redshifts (Fig 2b). Since 0.7mJy is close to the typical flux of the sources that dominate the m backgroundbkis bcs , one might expect Lyman-break galaxies’ moderate ratio of dust to UV luminosity to be more representative of average high-redshift star-forming galaxies than the extreme ratios of the bright m samples. In any case, the m observations of Lyman-break galaxies provide further evidence that star-formation rate and dust opacity are correlated at high redshift.
If we accept that dust opacity and star-formation rate are correlated at high redshift in a way similar to what Figs. 2a and b suggest, we can proceed to estimate the characteristic level of dust obscuration among the comparatively faint galaxies that dominate the m background and see whether most of them are easier to detect in the sub-mm or the UV. Given a rest-frame UV detection limit of ÅJy (), roughly appropriate for the Lyman-break survey of set99 , and a sub-mm flux limit of mJy, the confusion limit of SCUBA on the JCMT, a galaxy will be easier to detect in the rest-frame UV than the sub-mm if it has at or at as . Fig. 2a suggests that is characteristic of galaxies with at . Galaxies with lower star-formation luminosities will be less dust obscured on average and easier to detect in the UV than the sub-mm. corresponds to mJy for , , and the local dust SED shape assumed throughout; roughly 85% of the m background is produced by objects fainter than 3.3mJybcs . This suggests that the majority of star-formation at occurs in galaxies that are easier to detect in the rest frame UV than the sub-mm.
A similar conclusion follows at . Fig. 2b suggests that is characteristic of galaxies with (mJy) at . 80% of the m background is produced by objects fainter and presumably less obscured.
This completes my simple argument: a correlation between star-formation rate and dust opacity is seen to exist at every redshift we can probe (), and its slope is sufficient to imply that most of the m background was produced by galaxies that are easiest to detect in the rest-frame UV. It is an empirical argument based solely upon the observed ratios of dust to UV luminosity among galaxies whose dust and UV emissions have both been detected. It largely sidesteps the long and uncertain chain of reasoning – the incompleteness corrections, the luminosity-function extrapolations, the conversions of fluxes to bolometric luminosities to star-formation rates, and so on (see Carilli’s contribution) – that makes attempts to address the same question through “Madau diagrams” so famously contradictory and unreliable.
3 Interpreting UV surveys
The reason UV surveys detect a large fraction of high redshift star formation is that the UV luminosities of star-forming galaxies are largely independent of dust opacity. This is a consequence of the correlation of star-formation rate and dust opacity: the dustiest objects tend to be the most luminous, and the two effects – increased obscuration and increased luminosity – mostly cancel out at Å. As can be seen in Fig. 3, observed UV luminosities are similar for galaxies with dust obscurations spanning four orders of magnitude. ULIRGs in the local universe are as bright in the UV as starburst dwarfs; high redshift galaxies that have been detected through their dust radiation are typically as bright in the UV as those that have been detected through their UV radiation.
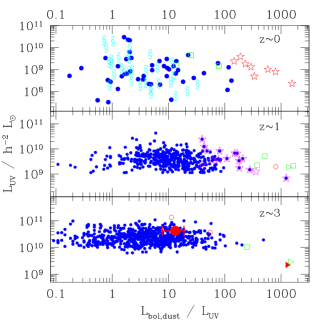
This fact makes UV surveys of star-forming galaxies easy to construct but hard to interpret. Referring to Fig. 3, one can see that a UV luminosity-limited survey of the local universe would net a tremendously broad range of objects, an indiscriminate haul of ULIRGs and blue compact dwarfs and spirals like the Milky Way. The same appears to be true of luminosity-limited surveys at high redshift. But UV luminosities don’t give us much to distinguish between these vastly different objects: if we were told only that a local galaxy had , for example, we would have no idea whether it was a ULIRG or a spiral or a starburst dwarf. How can we tell what sort of objects we have detected in a high redshift UV selected survey? How can we estimate any single object’s star-formation rate to within even an order of magnitude? Measuring mid-IR, far-IR, sub-mm, or radio fluxes for the objects would be ideal, but most high-redshift star formation occurs in objects too faint to be detected at any of these longer wavelengths, and in any case the small fields of view of current instruments at mid-IR to mm wavelengths () are poorly matched to the large fields of view of modern optical instruments (up to ). Until the next generation of long wavelength instruments becomes available, much of our knowledge of galaxy formation at high redshift will have to be derived from UV data alone.
Meurer and collaborators have developed one technique for estimating dust luminosities (and hence star-formation rates) from UV observations (e.g. mhc , hereafter MHC). Dustier local starbursts are not fainter in the UV on average, but they are redder, and MHC observed that a galaxies’ redness in the UV was a surprisingly good predictor of its dustiness . Among the galaxies in MHC’s sample, a measurement of the UV spectral slope (in at Å) was sufficient to predict to within a factor of 2. This /far-IR correlation is the basis of many attempts to estimate the star-formation rates of UV-selected high-redshift galaxies.
Do high-redshift galaxies obey MHC’s /far-IR correlation? The evidence is ambiguous. In some cases the /far-IR correlation appears to hold. One example is the lensed Lyman-break galaxy SMMJ14011+0252 at . Its observed m and 20cm fluxes of mJy, Jyiet agree well with the predictions of mJy, Jy that the /far-IR correlation impliesas . In this case the total star-formation rate can be deduced with reasonable accuracy from UV observations alone. The same appears to be true for the ten brightest Lyman-break galaxies in the HDF. According to MHC, the /far-IR and far-IR/radio correlations predict a total 20cm flux for these galaxies of Jy, nicely consistent with the total measured flux of Jy. But there are counter-examples as well. Baker and van den Werf discussed two in their talks, the galaxies MS1512+36-cB58 and MS1358+62-G1, where the /far-IR correlation appears to overpredict the observed m flux by an order of magnitude or more. This suggests – worryingly – that failures of the /far-IR correlation at high redshift are not restricted to the dustiest galaxies () as they appear to be in the local universe (see Meurer’s contribution to these proceedings).
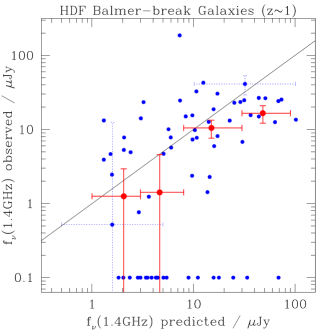
Analysis of the largest available sample of UV-selected high-redshift galaxies with independent constraints on suggests that most high-redshift galaxies obey the /far-IR correlation better than MS1512+36-cB58 and MS1358+62-G1 but perhaps not as well as SMMJ14011+0252. Figure 4 shows the predicted and observed 20cm fluxes of 69 “Balmer-break” galaxies in the Hubble Deep and Flanking Fields with spectroscopic redshifts as . The objects that are predicted (via the /far-IR and far-IR/radio correlations) to have larger 20cm fluxes clearly do on average; the data do not support the view that MHC’s /far-IR correlation generally misestimates dust luminosities by more than an order of magnitude (cf. van den Werf’s contribution to these proceedings). But nor do they obviously support the view that the /far-IR correlation can predict far-IR fluxes as accurately at high redshift as in the local universe. The measured 20cm fluxes of the galaxies in the brightest bin of predicted flux are roughly a factor of 3 times lower than expected, for example. Assessing the significance of this shortfall is difficult because of the large error bars in the predicted fluxes – a reasonable fraction of the objects in the brightest predicted bin were probably scattered out of the next brightest bin by various errors – and in any case a significant discrepancy between the observed and predicted fluxes might be due to a failure of the far-IR/20cm rather than the /far-IR correlation. But it is safe to say that the available data do not inspire absolute confidence in the validity of the /far-IR correlation at high redshift.
An additional cause for concern is the fact that a red spectral slope does not appear to be the most distinctive characteristic of the high-redshift galaxies known to have large dust luminosities. For example, these are the differences in mean color between galaxies in the HDF that are and are not ISO m sources: , , . The SEDs of the dusty and luminous ISO sources differ from those of fainter and less obscured galaxies primarily in the range Å, not Å where is measured. This does not show that MHC’s prescription for dust correction is wrong, only that it can be improved, but it adds to concerns that their prescription may not perform as well at high redshift as in the local universe.
Even if the /far-IR correlation fails on some objects, however, there is reason to hope that it may perform reasonably well on an ensemble of high redshift galaxies. For example, the correlation implies a mean dust obscuration for Lyman-break galaxies of , a plausible value that is midway between the dust obscuration observed in local spirals () and local UV-selected starbursts ()as and that is consistent with the mean obscuration derived from sub-mm observations of Lyman-break galaxies cet01 . Moreover many of the major results to emerge from recent analyses of m data – the brightness of m background, the domination of the m background by mJy sources, the thousand-fold increase in number density of ULIRGs from to – could have been predicted from UV observations alone by applying the /far-IR correlation to UV-selected high-redshift galaxy populationsas . Applying MHC’s /far-IR correlation to high-redshift galaxy populations at least leads to results that are reasonable, and so it seems sensible to continue using it cautiously until further long-wavelength observations can validate it or suggest better alternatives.
4 Conclusions
This conference concluded with a debate on the best way to explore high-redshift star formation. The best way? Understanding the history of galaxy formation is a large and difficult task, a shared enterprise that will benefit from observations at many wavelengths. I am not sure how much we stand to gain from arguing whose contributions are the most important.
Nevertheless I would have felt derelict in my assigned role as defender of the UV if I had not attacked one statement that was repeated several times at the meeting. This was the claim that UV and IR surveys detect “orthogonal” populations of galaxies, that a significant fraction of stars form in a “hidden” population of dusty galaxies that is not detected in UV surveys. I am not aware of any evidence supporting this claim. Where is the dusty hidden population in the local universe? A luminosity-limited UV survey deep enough to detect most spirals and blue starbursts would detect most LIRGs and ULIRGs as well (cf. Fig. 3). Where is it at ? Existing UV-selected surveys easily detect most if not all of the m sources detected by ISO. Where at higher redshift? A UV-selected survey would need to reach to detect the majority of the Å luminosity density at set99 , and at this magnitude limit most if not all of the m sources in the samples of bcr , iet 222including correction for magnification by gravitational lensing, and crlwb would be detected. It is easy to construct a “Madau diagram” in which galaxies detected at wavelength contribute far more to the comoving star-formation density than galaxies detected at wavelength . Data will confess to anything if you torture them enough. The proper approach is not to compare Madau diagrams – not to see who benefited most from the grotesquely compounded uncertainties – but to turn to the galaxies themselves and measure their luminosities at both wavelengths. When this is done (as we have seen) the answer is unequivocal: any UV survey at a given redshift deep enough to detect majority of the UV luminosity density will detect the majority of IR-selected galaxies as well.
But there is one sense in which most star formation is hidden from UV surveys: only a small fraction of the energy emitted by massive stars emerges from typical galaxies in the UV. The majority is absorbed by dust and reradiated in the far-IR. Unless there is some way to estimate the total luminosity of a galaxy’s massive stars from the (often) trace amount that is detected in the UV, it will be impossible to estimate star-formation rates for the detected galaxies and the usefulness of UV surveys will be diminished. Sect. 3 discussed one method for estimating far-IR fluxes from far-UV fluxes that is known to work in the local universe. As we saw, this method appears to work within a factor of at high redshift, but it is unclear if it works much better. The available data inspire more hope than confidence.
The strength of UV surveys is that they detect large numbers of high-redshift galaxies, even ones that are intrinsically very faint, in large and representative comoving volumes. The weakness is that star-formation rates are difficult to estimate for the detected galaxies. IR surveys complement them perfectly: star-formation rates can be estimated with reasonable confidence, but only small regions of the sky can be surveyed and only the most luminous sources can be detected. Harnessing the strengths of both types of surveys would lead to a rapid advance in our understanding of galaxy formation at high redshift. One obvious strategy would be to use IR observations of some UV-selected high-redshift galaxies to attempt to derive (or validate) a method for estimating dust luminosities from UV observations alone, a method that can then be applied to the large numbers of UV galaxies which have not been (and often cannot be) detected in the IR. This sort of multiwavelength cooperation will take us much farther than arguments about which wavelength is superior – despite the best efforts of wavelength partisans like the author of this screed.
I would like to thank the organizers for support at this enjoyable meeting. Special thanks are due to my collaborators S. Chapman, M. Dickinson, M. Giavalisco, M. Pettini, A. Shapley, and C. Steidel for their contributions to this work.
References
- (1) K.L. Adelberger, C.C. Steidel: Astrophys. Jour. 544, 218 (2000)
- (2) H. Aussel, C.J. Cesarsky, D. Elbaz, J.L. Starck: Astron. Astrophys. 342, 313 (1999)
- (3) A.J. Barger, L.L. Cowie, D.B. Sanders: Astrophys. Jour. Let. 518, 5 (1999)
- (4) A.J. Barger, L.L. Cowie, E. Richards: Astronom. Jour. 119, 2092 (2000)
- (5) A.W. Blain, J.-P. Kneib, R.J. Ivison, I. Smail: Astrophys. Jour. Let. 512, 87 (1999)
- (6) S.C. Chapman et al.: Mon. Not. Roy. Ast. Soc. 319, 318 (2000)
- (7) S.C. Chapman, E. Richards, G. Lewis, G. Wilson, A. Barger: Astrophys. Jour. Let., submitted
- (8) S.C. Chapman et al. in preparation
- (9) A. Dey, J.R. Graham, R.J. Ivison, I. Smail, G.S. Wright, M.C. Liu: Astrophys. Jour. 519, 610 (1999)
- (10) D.T. Frayer et al.: Astrophys. Jour. Let. 514, 13 (1999)
- (11) D.T. Frayer, I. Smail, R.J. Ivison, N.Z. Scoville: Astronom. Jour. 120, 1668 (2000)
- (12) J.D. Goldader et al. in preparation
- (13) R.J. Ivison et al.: Mon. Not. Roy. Ast. Soc. 315, 209 (2000)
- (14) G.R. Meurer, T.M. Heckman, D. Calzetti: Astrophys. Jour. 521, 64 (1999)
- (15) D.B. Sanders, I.F. Mirabel: Ann. Rev. Astron. Astrophys. 34 749 (1996)
- (16) I. Smail, R.J. Ivison, F.N. Owen, A.W. Blain, J.-P. Kneib: Astrophys. Jour. 528, 612 (2000)
- (17) C.C. Steidel, K.L. Adelberger, M. Giavalisco, M. Dickinson, M. Pettini: Astrophys. Jour. 519, 1 (1999)
- (18) N. Trentham, J. Kormendy, D.B. Sanders: Astronom. Jour. 117, 2152 (1999)