G28.17+0.05: An Unusual Giant H Cloud In The Inner Galaxy
Abstract
New 21 cm H observations have revealed a giant H cloud in the Galactic plane that has unusual properties. It is quite well defined, about 150 pc in diameter at a distance of 5 kpc, and contains as much as 10 of atomic hydrogen. The outer parts of the cloud appear in H emission above the H background, while the central regions show H self-absorption. Models which reproduce the observations have a core with a temperature K and an outer envelope as much as an order of magnitude hotter. The cold core is elongated along the Galactic plane, whereas the overall outline of the cloud is approximately spherical. The warm and cold parts of the H cloud have a similar, and relatively large, line width km s-1. The cloud core is a source of weak, anomalously-excited 1720 MHz OH emission, also with a relatively large line width, which delineates the region of H self-absorption but is slightly blue-shifted in velocity. The intensity of the 1720 MHz OH emission is correlated with NH derived from models of the cold core. There is 12CO emission associated with the cloud core. Most of the cloud mass is in molecules, and the total mass is . In the cold core the H mass fraction may be . The cloud has only a few sites of current star formation. There may be more objects like this in the inner Galaxy; every line of sight through the Galactic plane within of the Galactic center probably intersects at least one. We suggest that G28.17+0.05 is a cloud being observed as it enters a spiral arm and that it is in the transition from the atomic to the molecular state.
1 Introduction
Studies of Galactic H have generally been made either with single antennas, which provide information on the H in emission at fairly low angular resolution, or with interferometers, which until recently, were used mainly to observe Galactic H at high angular resolution in absorption against background continuum sources (e.g. Heiles (1967); Clark (1965); see reviews in Kulkarni & Heiles (1988); Burton (1988); Dickey & Lockman (1990)). When Galactic H was able to be observed at an angular resolution of several minutes of arc, it was discovered that much of the structure in the H emission profiles at low Galactic latitude is caused by self-absorption from cool atomic clouds being viewed against a brighter H background (Baker & Burton (1979); Liszt et al. (1981); Bania & Lockman (1984); Liszt et al. (1984)). Low-latitude H emission profiles are a mix of emission and self-absorption. The angular resolution needed to discern the cold clouds seen in self-absorption depends on their size and distance, and perhaps it is not surprising that existing catalogs of absorbing clouds are not representative, but are dominated by objects with a size of a few resolution-elements (e.g. Bania & Lockman (1984)). New aperture synthesis and single-dish surveys are finally providing high-resolution data on portions of the Galaxy (Bania & Kuchar, 1990; Higgs, 1998; Gibson et al., 2000), but the inner of the Galactic plane, which contains most of the star-forming regions and molecular clouds in the Galaxy, still has not been observed in H at better than resolution, and even at that resolution, sampling is not complete.
This lack of data has seriously compromised our understanding of basic processess. The neutral interstellar medium contains a spectrum of objects, from from diffuse H clouds of a solar mass or less, to the giant molecular clouds and cloud complexes which can exceed and are the sites of the formation of the most massive stars (see Turner (1997) for a recent review). The relationship between these objects is unclear, but material is observed to move between the various phases. Many molecular clouds are surrounded by H halos, and, conversely, molecules are observed in the densest parts of predominently atomic clouds. It is thought that atomic H clouds can undergo a phase transition at a spiral density wave-induced shock to form giant molecular clouds, which are then disrupted after some time by the products of their own star formation (e.g. Allen et al. (1986); Elmegreen (1995)). This paper describes the discovery of an unusual cloud which may be in a transitional state between atomic and molecular.
2 A Hole in the Galactic Continuum Emission
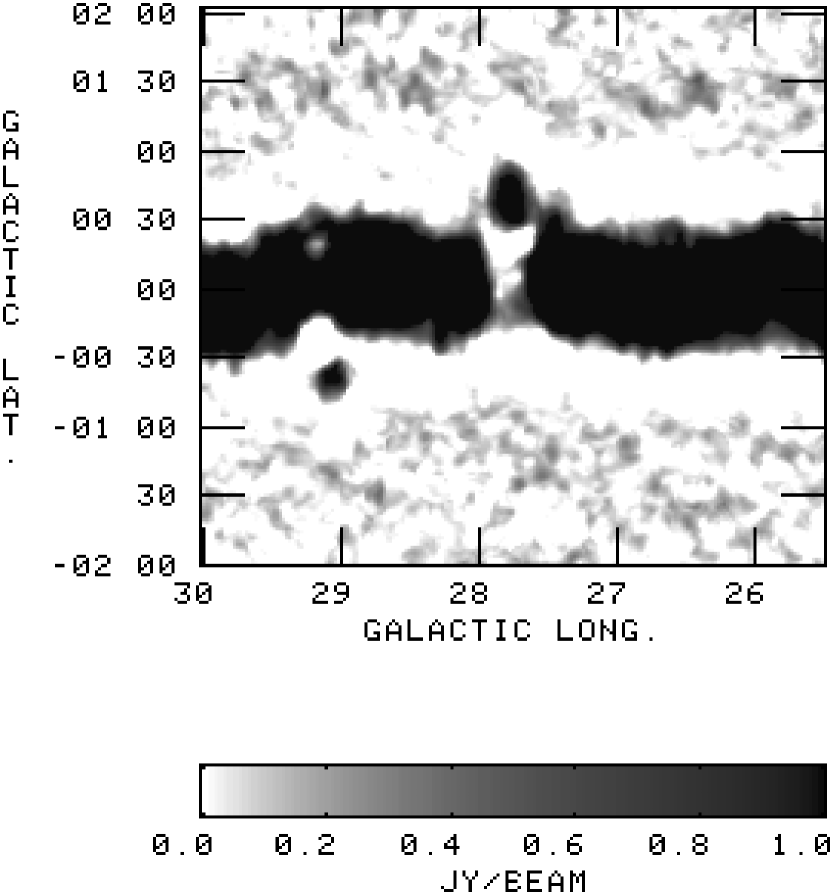
Our attention was first drawn to the area near longitude by the information in Figure 1, which shows spatially-filtered 8.35 GHz continuum emission for a portion of the Galactic plane. These observations were made at resolution in a search for transient radio sources as part of the GPA survey (Langston et al., 2000). The data have been passed through a spatial filter in Galactic latitude to suppress emission on scales . This reduces zero-level drifts in the data, but also results in the depressions that run through Figure 1 above and below the Galactic plane.
There is a large, cone-shaped minimum in the Galactic continuum centered near longitude. The hole has no detectable 8.35 GHz continuum emission down to the Jy flux limit of the (spatially filtered) GPA survey and it is bounded on all sides by relatively bright emission. This hole in the continuum is also apparent in the 4.875 GHz survey of Altenhoff et al. (1979), which was made using the 100 meter telescope of the Max Planck Institute for Radio Astronomy. While there is no known object at the location of the hole, the bright emission which caps the hole has been identified as a supernova remnant (SNR) G27.8+0.6. There is also another SNR adjacent to the hole at lower longitudes, G27.4+0.0 (Green, 1998), and a number of H regions on either side of the hole (Lockman, 1989; Lockman et al., 1996). While we now believe that this hole in the continuum has little significance, it caused us to make H measurements which did reveal something quite unusual.
3 H Observations
To determine if the radio continuum feature had any counterpart in atomic gas, the region , was observed in the 21 cm line of H using the NRAO 140 Foot Telescope which has a half-power beam-width (HPBW) of at the frequency of these observations. Spectra with a velocity resolution of covering were taken every in and . These are the highest angular resolution 21cm H observations ever made of this part of the Galaxy, except along a narrow strip at . The H spectra were corrected for stray radiation using the all-sky deconvolution method of Kalberla et al. (1980) as applied to the 140 Foot Telescope by Murphy et al. (2001). This procedure also places the H intensities on the absolute brightness temperature scale defined by Kalberla et al. (1982). As a supplement to the 140 Foot data, H.S. Liszt has kindly provided us with a set of unpublished H spectra taken by G. Westerhout using the 100 meter radio telescope of the Max Planck Institute for Radio Astronomy in Bonn, Germany (hereafter the “100 meter” data). These spectra were taken at every in Galactic longitude with a angular resolution and velocity resolution. The 100 meter data have not been corrected for stray radiation and their absolute calibration is consequently uncertain, so they were used mainly to check model predictions at (see §4.2).
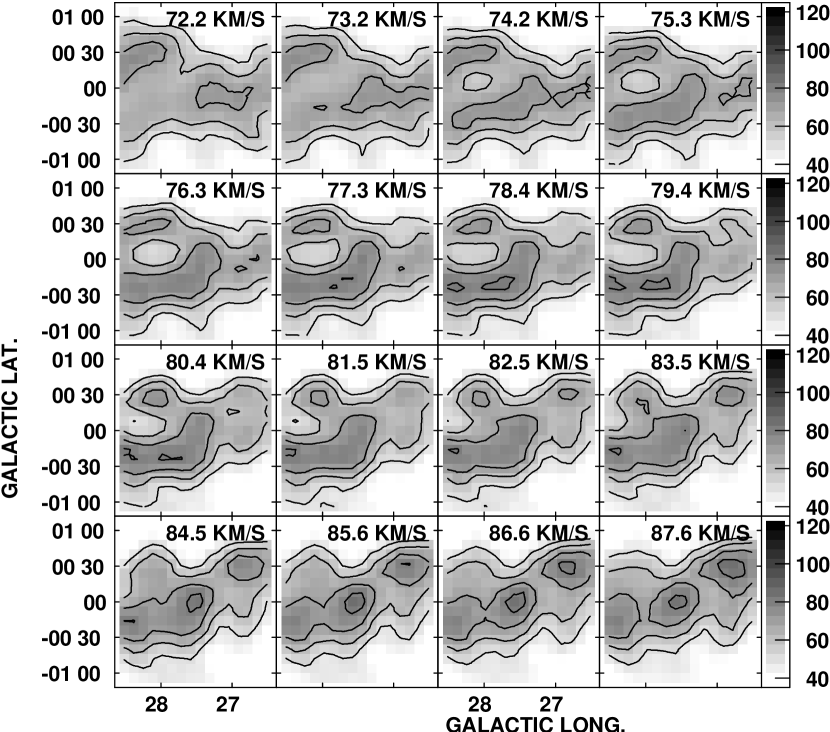
Figure 2 shows the H brightness temperature from the 140 Foot observations as a function of Galactic longitude and latitude for a set of velocities from to . There is a shell surrounding a hole in the H centered at approximately coincident with the hole in the radio continuum. Initially, we believed that the feature might be a cavity with a shell, perhaps the result of a supernova. Spectra towards the center of the H hole, however, suggest not an absence of gas, but rather H self-absorption. Figure 3 shows the 140 Foot H spectrum at . The arrow marks the velocity of the H hole, which appears in the spectrum as a minimum with a FWHM of about 7 km s-1 at a velocity of 79 km s-1. A feature like this with such steep edges would be difficult to produce by a void in space in the inner Galaxy: random motions of clouds and the relatively small change in projected velocity with distance over most of the Galaxy creates a confused background which generally obscures true density minima (see the discussion in Baker & Burton (1979)). Perhaps most important, Figure 3 shows that there is molecular gas with nearly the same velocity and line width as the H minimum, an unlikely occurrence if the minimum is a void rather than self-absorption.
The object we have found is most likely an H shell surrounding a concentration of H so cold and opaque that it absorbs H emission from warmer gas behind it. Toward the cloud center the H brightness temperature, Tb, falls as low as 50 K, while the H brightness temperature at that same velocity less than a degree away in longitude in either direction is K. At its brightest, the H shell is enhanced above the background H by about the same amount as the self-absorbed core is depressed below it. Figure 4 shows a cut through the data at illustrating the bright rim and depressed emission in the central region. The crosses are the H data and the solid line the results of a model (§4.2).
H self-absorption is seen throughout the inner Galaxy and in dark clouds all over the sky (Knapp, 1974; McCutcheon et al., 1978; Baker & Burton, 1979; Liszt et al., 1981; Bania & Lockman, 1984; Gibson et al., 2000; Dickey & Lockman, 1990, and references therein). The geometry of self-absorption requires the absorbing cloud to be silhouetted against a background of brighter emission at the same velocity. The velocity of the deepest absorption is 79 km s-1, which corresponds to a kinematic distance of either 5 or 10 kpc for a flat rotation curve of 220 km s-1 and a Sun-center distance of 8.5 kpc. A spectral feature arising from self-absorption can be filled in by emission from foreground gas, so detection of a strong feature like this argues that the cloud lies at the near kinematic distance (Baker & Burton, 1979; Jackson et al., 2001). Throughout this paper we will assume that the cloud is at the near kinematic distance of 5 kpc from the Sun, which places it 4.8 kpc from the Galactic center.
The velocity of the cloud varies slightly with longitude with a magnitude consistent with the changing projection of Galactic rotation, and the central velocity of the absorption feature is well approximated by . At the highest longitudes there is some evidence for the presence of another H cloud at somewhat higher velocity in addition to the main feature. This is at the edge of our map and we will not consider it further.
4 Properties of the H Cloud
4.1 General Considerations
The self-absorbed lines measured by the 140 Foot have a full-width to half-maximum, , that ranges from 6 to 10 km s-1 with an uncertainty of several km s-1 arising from uncertainties in the estimate of the HI emission level in the absence of absorption. At the cloud center . The 100 meter data give similar values. For 21 cm lines of this velocity width, the peak optical depth where is the H column density in units of cm-2 and is the excitation temperature in Kelvins. The cloud must have an optical depth of at least unity in order to be opaque to background emission, so the column density of H through the cloud must be , and the excitation temperature is limited by the brightness temperature of H at the location of maximum absorption to K. The self-absorption profiles appear to be nearly Gaussian, so the optical depth is not large enough to cause appreciable saturation in the line.
The H emission from the outer parts of the cloud, which we will call the shell, is as much as 25 K above the background emission. It is especially difficult to determine a line-width for emission from the shell because of blending with other H , but we estimate that 8 to 10 km s-1, similar to the 6 to 10 km s-1 found for the self-absorbed lines from the core. To produce the observed emission the shell must have a column density of a few cm-2. Sanbonmatsu & Helfand (1992) have detected a H absorption line at the velocity of the cloud against the radio SNR G27.4+0.0, which lies projected on a portion of the shell at a distance of 6-7.5 kpc. This observation supports the choice of the near kinematic distance for the H cloud, and, given the brightness temperature of the shell emission, implies that K in the shell.
As can be seen in Figure 2, the extent of the cloud is approximately in longitude and in latitude, giving a size of about pc at a distance of 5 kpc. For an average H column density of , the total implied H mass is . These general considerations suggest that we have discovered a large, exceptionally massive, H cloud, with a temperature change of perhaps an order of magnitude between the core and the shell. Analysis of H self-absorption features can involve some subtleties (e.g. Levinson & Brown (1980)). Antenna beam convolution is a specially important factor for this cloud, so to derive more reliable estimates of the cloud properties we have calculated a model which attempts to reproduce the observations taking into account all relevant effects.
4.2 A Detailed Model
To make a more precise estimate of the properties of the H cloud, we have approximated it using an extremely simple model: a spheroid with semi-major axes , in directions parallel to the Galactic plane, along the line of sight, and perpendicular to the Galactic plane, respectively. Models with a linear temperature gradient did not successfully fit the data – the steep change in Tb between core and shell requires a nearly discontinuous change in temperature. A simple two-component model was thus adopted with an outer shell and inner core having constant, but differing, excitation temperature. The density was allowed to be continuously and linearly variable from center to edge. The line width was assumed to be 7 km s-1 (FWHM) throughout, as the observations suggest that this value is an appropriate mean for both the core and shell. The core has its own semi-major axes, but its center is assumed to lie at the center of the overall cloud. The core is thus merely the region of low temperature in a cloud of otherwise smoothly varying properties. This simple model is sufficient to account for most features of the H data.
Our calculations evaluated the equation of radiative transfer for an H cloud observed against a background of unrelated H emission. The background was determined from the average of data at longitudes 2678 and 2691, which are just beyond the edge of the cloud, and was modeled by a Gaussian function with a dispersion of 60 pc in z, a peak brightness temperature in H of 71 K, and an offset with respect to the Galactic plane of pc.
Most models were calculated using pc cells in x and z (corresponding to 3.4 arcmin in longitude and latitude) and 1 pc cells along the line of sight. Within each cell the temperature and density were constant. The emergent spectrum was calculated as a function of velocity offset from the line center, at a velocity interval of 1 km s-1, with the assumption that the model cloud has no rotation or other systematic motion besides Galactic rotation. The emergent brightness temperatures from the model were convolved with a two-dimensional Gaussian to match the angular resolution of the observations. The models were created and evaluated using the AIPS++ software package.
Properties of representative models that fit the data are shown in Table 1. The cloud outer radius in the x direction (parallel to the Galactic plane) varies slightly, but for all models shown here the semi-major axes r r pc. The semi-major axes of the cold core are given in columns 3-5. The average H volume density varies linearly between , its value at the center of the cloud, and , its value at the cloud edge. Column 10 gives the displacement from the Galactic plane of the cloud center; the total H mass in column 11 does not include He or other elements.
Figure 5 shows the H brightness temperature averaged over the velocity range of the cloud along strips perpendicular to the Galactic plane at three longitudes. Two of the strips cut through the cloud shell and core while the third intersects only the shell. The solid line shows the calculations for Model I, the model which best fits the data. Figure 4 shows the data along a cut parallel to the Galactic plane, also with the results from Model I. The models place the cloud center at and just slightly (2 to 5 arcmin) above the Galactic plane. We adopt a cloud center of . The maximum column density through the center of the models is between 0.5 and cm-2, and the core contains between 20% and 40% of the total H mass. All models discussed here gave an optical depth within a factor of two of that observed towards the SNR 27.4+0.0 (Sanbonmatsu & Helfand, 1992). Although the 140 Foot data do not completely cover the cloud at the higher longitudes, the 100 meter data at are in reasonable agreement with the models and indicate that not much of the cloud has been missed.
Models in which the cold core extends all the way to the cloud surface at low z, as in all but Model IV, give the best fit to the data, and have the highest core temperature and largest total H mass. Core temperatures below 40 K can only be reconciled with the observations if there is substantial dilution of the self-absorbed line by foreground emission. This is the case with Model IV. Although some dilution is likely occurring in reality, there is only a fairly narrow range of conditions which dilute the absorption while leaving the spectral shape undistorted. Models which require substantial dilution also need careful fine tuning to produce both sufficient emission from the shell and sufficient absorption from the core.
The temperature in the shell is not tightly constrained, and all values in the range shown in Table 1 are acceptable. The temperature must be high enough for the shell to be seen in emission against background H , but not so high that the optical depth towards the SNR 24.4+0.0 falls significantly below the measurement of Sanbonmatsu & Helfand (1992).
The average volume density of the models will be equal to the true volume density only if the filling factor of H is unity. Our observations do not provide information on the H filling factor along the line of sight, but given that the partial pressure of the H , , is only a few hundred cm-3 K, much less than the average interstellar pressure (e.g. Kulkarni & Heiles (1988)) it is likely that either the H filling factor along the line of sight is small or the total pressure is dominated by the molecular component of this cloud.
The models indicate that the H cloud has a linear extent of 150 pc, a mass in H of , and a peak H column density of , which implies that the extinction at visual wavelengths is A under standard assumptions about the relationship between gas and dust (Spitzer, 1978). It is interesting that the models give a circular shape for the entire cloud, but require a core which is highly elongated along the Galactic plane. The transition between warm shell and cold core thus takes place at N cm-2 along the Galactic plane, but at twice this value, cm-2, at the maximum z-extent of the core, some 30 pc away from the plane. Figure 6 shows NH(z) and N through the center of Model I. The arrows mark the edge of the cold core.
5 Anomalous 1720 MHz OH Emission
Certain physical conditions can cause a population inversion in transitions of the OH molecule producing weak emission in the 1720 MHz satellite line accompanied by no signal, or absorption, in the main 1665 and 1667 MHz lines. This phenomenon was described by Turner (1982), who distinguished it from the more modest 1720 MHz anomalies observed in dark clouds (e.g. Turner & Heiles (1971)) and from the 1720 MHz maser emission observed from compact spots in shocks where a SNR is interacting with a molecular cloud at densities cm-3 (Goss & Robinson (1968); Frail et al. (1996); Lockett et al. (1999), though Yusef-Zadeh et al. (1999) argue that a few extended objects also show maser emission).
The Galactic plane in the vicinity of the H cloud has been observed in all four 18 cm OH lines by Turner (1979), during a general survey, and in the 1720 MHz transition by Frail et al. (1996), who observed towards G27.8+0.6, the supernova remnant which sits atop the radio continuum hole. Both sets of observations were made with the 140 Foot Telescope at an angular resolution of . The channel spacing was 1.13 and 0.85 km s-1 for the Turner and Frail et al. observations, respectively. Frail et al. published only a cursory summary of their 140 Foot observations of this region, so we extracted the raw data from the NRAO archives and re-reduced them to obtain the values shown in Table 2. The peak line antenna temperature, , and line-width, (FWHM), were derived by fitting a Gaussian function to the lines. The Frail et al. data are consistent with those of Turner in the few directions observed by both.
With the combined Turner and Frail et al. data sets there are more than 60 pointings covering the region around the H cloud. Figure 7 shows the positions of 1720 MHz OH observations and the boundaries of the H cloud and inner core derived from Model I. Circles mark locations where 1720 emission was detected at the velocity of the H shell (between 72 and 83 km s-1). It is clear that the H cloud is coincident with a region of anomalous 1720 OH emission concentrated towards the core of the cloud. The longitude extent of the OH emission confirms the conclusion from the 100 meter H data that the full extent of the H cloud core is not much larger than the region mapped with the 140 Foot.
The width of the 1720 MHz line is typically 5 to 8 km s-1, corresponding to a Doppler temperature K, which indicates that the line width derives entirely from turbulence. The lines are slightly narrower than the H self-absorption lines at similar positions: the ratio (H ) for the seven positions where such a comparison can be made. If this difference in is interpreted as arising entirely from the partial saturation of the H lines, the ratio implies that for the cool H , a value in the range of that derived from the cloud models.
Figure 8 shows velocity-longitude and velocity-latitude diagrams for the 1720 MHz emission, H shell, and H regions in the area (from Lockman (1989); Lockman et al. (1996)). The change in velocity with longitude of the OH is entirely consistent with the sin() projection of Galactic rotation on the LSR for an object at a constant distance from the Galactic center. The 1720 MHz OH emission coincides with the H cloud, although the OH emission appears to be systematically offset by km s-1. This offset appears in both the Frail et al. (1996) and the Turner (1979) OH measurements, and can also be seen in Figure 3. We have examined basic observational material and can find no error which would create a velocity difference of this magnitude. While it is quite difficult to determine a precise velocity for H self-absorption because the spectral shape of the background emission can never be known very accurately, all of our attempts to reduce the velocity difference between H and OH have been unsuccessful. There appears to be a real velocity difference between the H and the 1720 MHz OH emission from this cloud.
The upper panel of Figure 9 shows the integral under the 1720 MHz OH emission, W(OH), in K km s-1, vs. the total H column density from Model I, where the model has been smoothed with an Gaussian to match the angular resolution of the OH data. The lower panel shows W(OH) plotted against the NH from the Model I cold core alone. The higher degree of correlation of OH and H in the lower panel of Fig. 9, particularly with respect to directions lacking OH emission, indicates that the 1720 MHz OH emission is correlated only with cool H , not with the total amount of H .
The physical conditions which cause this form of anomalous 1720 MHz OH emission have not been studied in detail, but Turner (1982) suggested that the kinetic temperature must be confined to a fairly narrow range: K. This is exactly the range of temperatures given by the H models for the cloud core, although the volume densities inferred by Turner for the excitation are , orders of magnitude higher than the average volume density of the H . It is not surprising that there is molecular gas in this cloud, for is known to be a significant component of all interstellar clouds that have N cm-2 (Savage et al., 1977). What does seem singular, though, is the correlation between W(OH) and the column density of cold H . Although the OH molecule is abundant in cool H clouds (Liszt & Lucas, 1996), weak, anomalous 1720 MHz emission is much rarer. In the inner Galaxy it traces coherent structures many tens of parsecs in extent, but it has rarely been found beyond the solar circle (Turner, 1982, 1983). The correlation of 1720 MHz OH emission with G28.17+0.05 suggests that this cloud may not be unique – clouds similar to it likely can be found throughout the inner Galaxy.
6 CO
The H cloud lies projected on the edge of a molecular cloud which extends to higher longitudes and has been identified in low-resolution 12CO spectra as one of the largest in the Galaxy with (Myers et al., 1986). However, the catalog of Solomon et al. (1987), derived from higher angular resolution data, divides the 12CO emission from this part of the Galactic plane into many smaller objects, and lists five giant molecular clouds toward and around the H cloud, all with velocities near that of the H . The 13CO data of Liszt et al. (1984), though taken only in the Galactic plane, show a region of emission that is centered approximately at the v) of the H cloud with about the same extent in longitude as the cloud core. The 13CO emission has a broad line width similar to that of the H and OH. We believe that these latter data are the most relevant and give the clearest picture of the actual association between CO and H . Jackson et al. (2001) have found clouds in which the 13CO emission tracks H self-absorption much better than the 12CO lines, which are saturated. This may also be the situation with G28.17+0.05. Nonetheless, in the absence of complete 13CO maps of the cloud, we must rely on 12CO data for estimates of its molecular content.
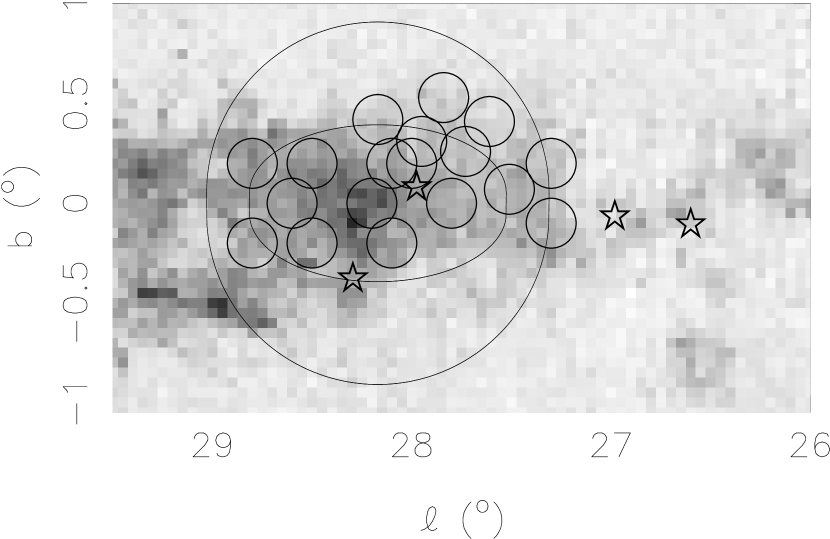
Figure 10 shows a grey-scale map of W(CO): the power in the 12CO line integrated over the velocity of the H cloud. The 12CO data used here are from the UMass-Stony Brook survey of Sanders et al. (1986) which sampled the Galactic plane on a grid with angular resolution. Circles show directions with associated anomalous 1720 OH emission, stars mark H regions with the velocity of the H cloud, and the outer boundaries of Model I are drawn. There is some concentration of 12CO emission towards the H cloud, but there is significant 12CO emission in this field that appears unrelated to it.
The upper panel of Figure 11 shows W(CO) from Figure 10 between longitudes and plotted against the total from Model I evaluated at the location of each 12CO spectrum. The general correlation between the model H and the observed 12CO is quite poor, and there are directions of bright 12CO emission where Model I predicts no H . Unlike the anomalous 1720 MHz OH emission, 12CO is not confined within the boundaries of the H cloud. While there may be a displacement between the atomic and molecular portions of the cloud, it is also likely that some of the 12CO emission arises in background molecular gas unassociated with the H cloud.
The lower panel of Figure 11 shows W(CO) compared to the H from the cold core component of cloud Model I. It is apparent that W(CO) is elevated towards the core relative to the general field displayed in the upper panel of Figure 11, that it is brightest at the center of the core, and that no direction towards the core has extremely low CO emission. There still appears to be a significant amount of 12CO emission unrelated to the H , perhaps at the level of 30 K km s-1. We adopt the relationship N/W(12CO) cm-2 (Bloemen, 1989), understanding that it may be uncertain by a factor of two or more (e.g. Hunter et al. (1997)). The total amount of 12CO towards the cloud core implies a molecular mass M. If a background level of 30 K km s-1 is removed, M.
Figure 12 shows a 12CO spectrum directly toward the cloud center at where the 12CO data have been convolved to the resolution of the H data. At the velocity of the H cloud (marked by the arrow), the 12CO line has a width of km s-1, about twice the width of the H . In contrast to the 1720 MHz OH emission, whose average line width is that of the H , the ratio for nine directions where the comparison can be made. Individual 12CO profiles at the angular resolution of the UMass-Stony Brook survey show that the broad lines are not a result of the convolution, but are intrinsic to the data. This trend is general over the region. Many 12CO spectra toward the cloud core have a flattened peak at the velocity of the H cloud, suggesting that they may be saturated. Saturation of 12CO lines from molecular clouds in the inner Galaxy has also been inferred from 13CO observations (Jackson et al., 2001).
Existing CO observations, especially the 13CO data of Liszt et al. (1984), show that there is a molecular cloud associated with the H cloud core, but evidence for association with the cloud shell, or evidence that this object is part of a larger interstellar structure, remains ambiguous. It is interesting to contrast the 12CO spectrum towards the H cloud, which has emission at nearly every velocity up to 120 km s-1, with the 1720 MHz OH spectrum, which has emission only at the velocity of the cloud. The anomalous 1720 MHz OH emission is identifying some special physical conditions present in G28.17+0.05 but absent in the many other molecular and atomic clouds in this direction.
7 Star Formation
Information on star-forming regions which might be associated with G28.17+0.05 is summarized in Table 3, which includes radio recombination line data and tracers of dense molecular regions. The radio and infrared sources nearest each other are given if the identification is not certain.
Almost all of the bright and sources from the IRAS survey that lie within the H cloud boundaries have been detected in radio recombination lines, but only two have velocities near that of the H cloud (see Fig. 8). There is not enough known about either of these to resolve the kinematic distance ambiguity. The radio continuum flux density of the two objects detected in ionized gas, 27.975+0.080 and 28.295-0.377, is 0.2 and 0.5 Jy, respectively, [from the 5 GHz survey of Altenhoff et al. (1979)] though the need for background subtraction introduces some uncertainty. If this flux results from optically thin emission (which is likely given the detection of radio recombination lines at a normal line-to-continuum ratio) they each require only a single main-sequence B0 star for their excitation using the Lyman continuum flux calculations of Vacca et al. (1996). Of particular interest are two IR and sub-mm sources associated with the radio source 28.332+0.060. One has a bolometric luminosity typical of a pre-main sequence star, while the other is a candidate for classification as a class 0 protostar (Carey et al., 2000).
Maser emission from the 6.7 GHz transition of is thought to trace sites of the formation of massive stars (Menten, 1991), and its detection towards several IR sources indicates that there might be ultra-compact H regions (Wood & Churchwell, 1989) associated with the cloud, although there is always the possibility of confusion with a background object at the far kinematic distance. There is a bright infrared source projected near the center of the H cloud at (Caswell et al., 1995; Szymczak et al., 2000), but its emission covers 94-104 km s-1 and its CS(2-1) emission is at 97.4 km s-1, placing it well behind the H cloud. Ellingsen et al. (1996) have argued that many 6.7 GHz masers are not associated with IRAS sources, so there may be as yet undetected young objects in the cloud.
Myers et al. (1986) have studied the star formation rate in molecular clouds in the inner Galactic plane and list a molecular cloud at km s-1, as one of the most massive in their survey, but with a negligible number of H regions and little far-Infrared emission. Higher resolution molecular observations suggest that what Myers et al. reported as one cloud is probably several (§6), but the new data summarized here do not contradict the general conclusion of Myers et al. that this cloud has relatively little star formation compared to most large clouds in the inner Galaxy (see also Carey et al. (1998)).
8 Comparison with Maddalena’s Cloud
There is a large molecular cloud in the outer Galaxy, G216-2.5, often called Maddalena’s Cloud, which has unusual properties: a relatively large line width (in 12CO) of km s-1, a size of pc, and a molecular hydrogen mass derived from 12CO observations (assuming N/W(CO) of cm-2) of M☉. It is associated with an H cloud that has a mass M and a size pc (Maddalena & Thaddeus, 1985; Williams & Maddalena, 1996). The kinetic temperature of the H is unknown. At its peak, the H has T K but some of this is probably unrelated emission. The cloud is not seen in H self-absorption, but the level of background H emission is uncertain, and may not be bright enough to produce the effect. This cloud shows no evidence for current star formation, nor is it a source of anomalous 1720 MHz OH emission (Turner, 1979). Williams & Maddalena have proposed that the H arises from photodissociation of part of the molecular cloud by an O9.5 star located 50 pc from the molecular cloud edge.
Maddalena’s cloud is in some ways similar to G28.17+0.05, but in important ways distinctly different. The main similarities are in the large, turbulent line width, its size, and the association of H and molecules in a single object. This is shown in Table 4. Differences are that Maddalena’s cloud has no anomalous 1720 MHz OH emission, absolutely no evidence of star formation, and no evidence for a cold H core.
9 The Nature of G28.17+0.05
9.1 Mass
A strong lower limit to the mass of G28.17+0.05 is M☉ (§6). Adding the H mass estimated from Model I and scaling by a factor of 1.36 to account for heavy elements yields a total cloud mass of no less than M☉. The virial mass of the cloud, derived from its size and linewidth, is in the range , depending on assumptions about the cloud structure (McKee & Zweibel, 1992). The virial mass is so close to the observed mass that, given the rather substantial uncertainties, it is plausible that the cloud is gravitationally bound. As discussed below, this makes G29.17+0.05 unusual because the H on the edges of most molecular clouds is not gravitationally bound.
9.2 Relationship Between Atomic and Molecular Components
Many molecular clouds have significant amounts of atomic gas: either cold H in a cloud’s core, an extensive warm H halo, or some combination of both (Andersson et al., 1991; Feldt, 1993; Minh et al., 1996). Every warm H halo found thus far is apparently transitory, either because the object it surrounds is not long lived, or the H is too turbulent to be confined by the gravitational field of the cloud (e.g. Andersson & Wannier (1993); Minh et al. (1996)). A study of several molecular clouds found that the line width of H halos was 5 times larger than the line width of the molecules (Andersson et al., 1991). In some cases the H halo is thought to be material dissociated from a molecular cloud by nearby stars (Kuchar & Bania, 1993; Williams & Maddalena, 1996). Allen et al. (1997) suggest that all of the bright H in the spiral arms of the galaxy M81 arises from dissociated molecular gas.
G28.17+0.05 thus appears anomalous, as it seems sufficiently massive to be gravitationally bound despite its large line width. It is also anomalous in having a similar line width for H and OH. G28.17+0.05 is unlike the transitory objects noted above.
9.3 Atomic Fraction
Turner (1997) has reviewed the formation of molecular clouds from diffuse interstellar gas. The transition from a fully atomic to a fully molecular hydrogen cloud can be abrupt once sufficient shielding from ambient UV is available. The column density of H through the G28.17+0.05 core is estimated to be cm-2 (Model I) so dust associated with the H provides an extinction of only A magnitude through the cloud core. Of course, the molecular observations imply that most of the cloud is in the molecular state, so the total AV must be substantially higher.
The models give a mass in cold H in the cloud core of M☉ which is at most of the mass in H2 of the core. In most molecular clouds, the column density of cold H is only a few cm-2 and is of the total gas mass (e.g. McCutcheon et al. (1978); Feldt (1993)), though it can reach a few cm-2 in some regions (Gibson et al., 2000; Jackson et al., 2001). Chemical models of molecular clouds predict a residual H content of just a few percent unless the external radiation field is quite high and much of the molecular cloud is dissociated (Wolfire, Hollenbach & Tielens 1993).
9.4 Significance of the Line Width
Turbulence appears to be the dominant source of pressure in the H , and as discussed in §9.1, the turbulent pressure is approximately that needed to support the cloud against gravitational collapse. The uncommonly large line width km s-1 in H , OH, and 13CO, and the near-equivalence of the line width in the core and shell despite their differing physical temperature, suggests that turbulent motions of the same magnitude are present in all parts of the cloud.
Turbulence is expected to dissipate on the timescale of the turnover of a turbulent eddy, which is on the order of the turbulent velocity divided by the size of the cloud (McKee, 1999). For G28.17+0.05 the time scales are less than a few years. This suggests that the turbulence in the cloud has been created recently, which might be the case (a) if the cloud is in the process of coalescing from more distributed material; (b) if it is being shocked (e.g., passing through a spiral arm); (c) if there is a turbulent mixing layer between the cold core and the shell; (d) if it is being stirred by the products of star formation. It is likely that this cloud has undergone some recent perturbation and is not in equilibrium, consistent with the unusually large fraction of its matter which is in the atomic state.
9.5 Analogs to G28.17+0.05 in Other Galaxies
There must be analogs to G28.17+0.05 in other galaxies, so it is instructive to consider how it would appear when viewed from above, instead of being silhouetted against emission from the Galactic plane. The most important difference is that gas above and below it in the Galaxy is expected to have N cm-2 in each half-disk (Dickey & Lockman, 1990) which would produce a background T K. The cloud would appear completely in emission against this weak background, and have a maximum Tb of 50 - 60 K, and an extent of 150 pc in azimuth around the galaxy, i.e. in the direction approximately parallel to the spiral arms. The maximum column density would be about cm-2. The cloud’s shape in the radial direction, perpendicular to the spiral arms, cannot be determined from our data.
Braun (1997) describes the H in nearby galaxies as being concentrated in a network of emission features with a narrowest dimension of 150 pc and H brightness temperatures of 80-200 K. The core of G28.17+0.05 cannot be hotter than 50 K, but this is within the range of observed values (Braun, 1997). It is possible that G28.17+0.05 is a Galactic analog of this extragalactic phenomenon.
9.6 A New Giant Molecular Cloud in the Making?
The transition between a cloud consisting of H and one which is mostly H2 depends on the local pressure to a very high power (Elmegreen, 1993) such that the interaction of an H cloud with a spiral density wave can be expected to convert it to H2, and the H /H2 ratio is expected to be a strong function of distance from the Galactic plane (Elmegreen, 1993; Combes & Becquaert, 1997). The kinematic distance adopted for the H cloud is 5 kpc, which corresponds to a distance from the Galactic center, R, of 4.8 kpc. This is near the location of the Scutum spiral arm, which is seen tangent to the line of sight near longitude implying R=4.25 kpc. This raises the possibility that the H cloud is interacting with the potential minimum of the arm and that the distinctive properties of the cloud come from the fact that it is being observed as it enters a spiral shock and begins a phase transition from atomic to molecular gas.
The general scenario for interaction of a cloud with a spiral shock is the formation of molecules from predominantly atomic gas, a velocity discontinuity at the shock, and subsequent star formation leading eventually to the disruption of the molecular cloud (Allen et al., 1986; Elmegreen, 1995). The cloud G28.17+0.05 would fit into this sequence if it is just now in the process of forming molecules and initiating star formation. This would account for its relatively high fraction of H and its relatively low star formation rate. In the inner Galaxy the spiral pattern speed is less than Galactic rotation, so gas overtakes the spiral potential. The spiral shock would slow gas reducing its apparent rotational velocity. In the first quadrant of Galactic longitude, this would result in a blue-shift of shocked gas relative to pre-shocked gas. This provides a natural explanation for the observed 2.5 km s-1 difference in velocity between the H and the OH, if the anomalous 1720 MHz OH emission comes from shocked gas, and the H from pre-shocked gas. The total velocity difference may actually be higher than this value because of projection effects. If this suggestion is correct, and the mechanism is general, then a similar cloud in the fourth quadrant of Galactic longitude will have anomalous 1720 MHz OH emission red-shifted with respect to the associated H because of the different projection of Galactic rotation in that quadrant.
One puzzling feature of the anomalous 1720 OH emission is that it is seen in many directions in the inner Galactic plane, but must be quite localized because it is rarely seen at more than one velocity and requires special excitation conditions (Turner, 1982, 1983). If this transition is excited in a spiral shock both properties could be understood, for a spiral shock is both widespread and localized. Turner (1982) noted that the 1720 MHz transition tracks spiral arms in the inner Galaxy much more clearly than either 12CO or H2CO, a behavior that would be expected in this scenario.
10 Concluding Comments
The H cloud at is unique in a number of respects. First, it is very large and unusually well defined for a Galactic H cloud. Its extent of 150 pc and its H mass approaching M☉ are at the extreme range for Galactic H clouds, quite unlike the usual objects detected in H self-absorption (e.g. Knapp (1974); Gibson et al. (2000)).
Second, the cloud has a very distinctive temperature structure, with a cool core at 25-45 K and a warmer shell at 150 - 400 K. While some small H clouds are known to have a similar temperature structure (e.g. van der Werf et al. (1988); Feldt (1993)), nothing on so large a scale or with such a steep gradient has been observed before. Moreover, the line width of 7 km s-1, even in the cold gas, is unusually large for cool H clouds and indicates that the cloud is quite turbulent (cf. G28.17+0.05 with the clouds in (Knapp, 1974) and (Gibson et al., 2000)).
Third, the cloud core, but not the outer shell, is associated with anomalously-excited 1720 MHz OH emission. This in itself shows that G28.17+0.05 is not a typical molecular cloud. The excitation mechanism for this emission has not been studied in detail, but conditions which produce it must be fairly widespread in the inner Galaxy. The OH lines have a width consistent with that of the H , but appear to be blue-shifted by about 2.5 km s-1. The cloud core, but not the shell, also seems to correlate with emission in the 12CO and 13CO lines. The brightest molecular emission occurs in directions with the largest amount of cold H . The estimated H2 mass associated with the cloud core, though uncertain, may be as low as M☉. There is some star formation in the cloud, but relatively little compared with other large molecular clouds.
The overall picture we derive is of a turbulent atomic and molecular cloud. Some part of it is in a unusual state of excitation producing the anomalous 1720 MHz OH emission. There is some star formation. We speculate that this is an object just entering the Scutum Spiral Arm and initiating molecule formation and star formation. The velocity difference between OH and H results from their being located in different parts of a shocked cloud. If this explanation is correct, and shocks are a general feature of clouds of this type, then a similar cloud in the fourth Galactic quadrant should show anomalous 1720 MHz OH emission that is red-shifted with respect to its associated cool H .
The absence of radio continuum emission near the cloud – the feature that first drew our attention to this part of the Galactic plane – results in part from the relatively low star formation rate in the cloud, but is probably just a coincidence, for the site line toward G28.17+0.05 passes near many areas of significant star formation. The emission from a single foreground or background H region or SNR would easily destroy the appearance of a hole in the radio continuum. In view of all the other evidence about this cloud, we consider the existence of radio continuum hole of minor importance, and most likely a simple coincidence.
There should be many more clouds like G28.17+0.05 waiting to be discovered in the inner Galaxy. This object was found only because it lay in a region that was completely mapped in H at an angular resolution of , sufficient to reveal the cloud structure. It is not widely appreciated that the majority of the Galactic plane within of the Galactic Center has not yet been observed at this high an angular resolution. Existing data (e.g. the Leiden-Dwingeloo H survey of Hartman & Burton (1997)), while more than adequate for the study of the large-scale structure of the Galaxy, do not have the angular resolution and completeness of sampling necessary to detect this cloud, even as large as it is!
The statistics of anomalous 1720 MHz OH emission also suggest that clouds in this thermodynamic state must be common. Turner (1982) found highly extended objects in the region , and the OH observations of Frail et al. (1996) presented in Table 2 contain additional directions with this emission. It is reasonable to expect that there are at least 100 large clouds like the one studied here, with anomalous 1720 MHz OH emission and an extensive cold atomic core, within of the Galactic center. The covering factor of these clouds in the inner Galactic plane may be . Further observations of this cloud at higher angular resolution in H emission and absorption against background continuum sources, and in molecular species, particularly 13CO and CS, should give especially good insights into the evolution of molecular clouds in the Galaxy. The importance of anomalous 1720 MHz OH emission as a tracer of Galactic structure has not been appreciated. New studies of excitation mechanisms for this transition would be especially welcome.
References
- Allen et al. (1986) Allen, R.J., Atherton, P.D., & Tilanus, R.P.J., 1986, Nature, 319, 296.
- Allen et al. (1997) Allen, R.J., Knapen, J.H., Bohlin, R., & Stecher, T.P., 1997, ApJ, 487, 171.
- Altenhoff et al. (1979) Altenhoff, W. J., Downes, D., Pauls, T., & Schraml, J., 1979, A&AS, 35, 23.
- Andersson et al. (1991) Andersson, B-G., Wannier, P.G. & Morris, M., 1991, ApJ, 366, 464.
- Andersson & Wannier (1993) Andersson, B-G. & Wannier, P.G., 1993, ApJ, 402, 585.
- Baker & Burton (1979) Baker, P.L. & Burton, W.B., 1979, A&AS, 35, 129.
- Bania & Kuchar (1990) Bania, T.M. & Kuchar, T.A., 1990, ApJ, 352, 192.
- Bania & Lockman (1984) Bania, T.M. & Lockman, F.J., 1984, ApJS, 54, 513.
- Bloemen (1989) Bloemen, H., 1989, ARA&A, 27, 469.
- Braun (1997) Braun, R., 1997, ApJ, 484, 637.
- Bronfman et al (1996) Bronfman, L., Nyman, L-A., & May, J., 1996, A&AS, 115, 81.
- Burton (1988) Burton, W.B., 1988, “Galactic and Extragalactic Radio Astronomy”, 2nd edition, chapter 7, ed. Verschuur, G.L. & Kellerman, K.I., Spirnger-Verlag.
- Carey et al. (1998) Carey, S.J., Clark, F.D., Egan, M.P., Price, S.D., Shipman, R.F., & Kuchar, T.A., 1998, ApJ, 508, 721.
- Carey et al. (2000) Carey, S.J., Feldman, P.A., Redman, R.O., Egan, M.P., MacLeod, J.M., & Price, S.D., 2000, ApJ, 543, L157.
- Caswell et al. (1995) Caswell, J.L., Vaile, R.A., Ellingsen, S.P., Whiteoak, J.B., & Norris, R.P., 1995, MNRAS, 272, 96.
- Clark (1965) Clark, B.G. 1965, ApJ, 142, 1398.
- Combes & Becquaert (1997) Combes, F. & Becquaert, J-F., 1997, A&A, 326, 554.
- Dickey & Lockman (1990) Dickey, J.M. & Lockman, F.J., 1990, ARA&A, 28, 215.
- Dickey et al. (1998) Dickey, J.M., McClure-Griffiths, N., Gaensler, B., Green, A., Haynes, R., & Wieringa, M., 1998, “New Perspectives on the Interstellar Medium” ASP Conference Series Vol. 168, ed. A.R. Taylor, T.L. Andecker & G. Joncas, p. 15.
- Ellingsen et al. (1996) Ellingsen, S.P., von Bibra, M.L., McCulloch, P.M., Norris, R.P., Deshpande, A.A., & Phillips, C.J., 1996, MNRAS, 280, 378.
- Elmegreen (1993) Elmegreen, B.G., 1993, ApJ, 411, 170.
- Elmegreen (1995) Elmegreen, B.G., 1995, in “The Formation of the Milky Way”, ed. E.J. Alfaro & A.J. Delgado, Cambridge Univ. Press, p. 28.
- Feldt (1993) Feldt, C., 1993, A&A, 276, 531.
- Frail et al. (1996) Frail, D.A., Goss, W.M., Reynoso, E.M., Giacani, E.B., Green, A.J. & Otrupcek, R., 1996, AJ, 111, 1651.
- Gibson et al. (2000) Gibson, S.J., Taylor, A.R., Higgs, L.A. & Dewdney, P.E., 2000, ApJ, 540, 851.
- Goss & Robinson (1968) Goss, W.M. & Robinson, B.J., 1968, Astrop. Lett., 2, 81.
- Green (1998) Green D.A., 1998, ‘A Catalogue of Galactic Supernova Remnants (1998 September version)’, Mullard Radio Astronomy Observatory, Cambridge, United Kingdom, available on the World-Wide-Web at http://www.mrao.cam.ac.uk/surveys/snrs/.
- Hartman & Burton (1997) Hartman, D. & Burton, W.B., 1997, “Atlas of Galactic Neutral Hydrogen”, Cambridge University Press.
- Heiles (1967) Heiles, C. 1967, ApJS, 15, 97.
- Higgs (1998) Higgs, L.A., 1998, “New Perspectives on the Interstellar Medium” ASP Conference Series Vol. 168, ed. A.R. Taylor, T.L. Andecker & G. Joncas, p. 15.
- Hunter et al. (1997) Hunter, S.D., Bertsch, D.L., Catelli, J.R., Dame, T.M., Digel, S.W., Dingus, B.L., Esposito, J.A., Fichtel, C.E., Hartman, R.C., Kanbach, G., Kniffen, D.A., Lin, Y.C., Mayer-Hasselwander, H.A., Michelson, P.F., von Montigny, C., Mukherjee, R., Nolan, P.L., Schneid, E., Sreekumar, P., Thaddeus, P., Thompson, D. J., 1997, ApJ, 481, 205.
- Jackson et al. (2001) Jackson, J.M., Bania, T.M., Simon, R., Kolpak, M., Clemens, D.P. & Heyer, M., 2001, ApJ, (submitted).
- Kalberla et al. (1980) Kalberla, P.M.W., Mebold, U., & Reich, W., 1980, A&A, 82, 275.
- Kalberla et al. (1982) Kalberla, P.M.W., Mebold, U. & Reif, K., 1982, A&A, 106, 190.
- Knapp (1974) Knapp, G.R., 1974, AJ, 79, 527.
- Kuchar & Bania (1993) Kuchar, T.A. & Bania, T.M., 1993, ApJ, 414, 664.
- Kulkarni & Heiles (1988) Kulkarni, S.R. & Heiles, C., 1988, “Galactic and Extragalactic Radio Astronomy”, 2nd edition, chapter 3, ed. Verschuur, G.L. & Kellerman, K.I., Spirnger-Verlag.
- Langston et al. (2000) Langston, G., Minter, A.H., D’Addario, L., Eberhardt, K., Koski, K. & Zuber, J.K., 2000, AJ, 119, 2801.
- Levinson & Brown (1980) Levinson, F.H., & Brown, R.L., 1980, ApJ, 242, 416.
- Liszt et al. (1981) Liszt, H.S., Burton, W.B., & Bania, T.M., 1981, ApJ, 246, 74.
- Liszt et al. (1984) Liszt, H.S., Burton, W.B., & Xiang, D.-L., 1984, A&A, 140, 303.
- Liszt & Lucas (1996) Liszt, H.S., & Lucas, R., 1996, A&A, 314, 917.
- Lockett et al. (1999) Lockett, P., Gauthier, E. & Elitzur, M., 1999, ApJ, 511, 235.
- Lockman (1989) Lockman, F.J., 1989, ApJS, 71, 469.
- Lockman et al. (1996) Lockman, F.J., Pisano, D.J. & Howard, G.J, 1996, ApJ, 472, 173.
- Maddalena & Thaddeus (1985) Maddalena, R.J. & Thaddeus, P., 1985, ApJ, 294, 231.
- McCutcheon et al. (1978) McCutcheon, W.H., Shuter, W.L.H & Booth, R.S., 1978, MNRAS, 185, 755.
- Menten (1991) Menten, K.M., 1991, ApJ, 380, L75.
- McKee (1999) McKee, D.F. 1999, in “The Origin of Stars and Planetary Systems”, ed. C.J. Lada & N.D. Kylafis, Kluwer, p. 29.
- McKee & Zweibel (1992) McKee, C.F. & Zweibel, E.G., 1992, ApJ, 399, 551.
- Minh et al. (1996) Minh, Y.C., Park, Y.-S., Kim, K.-T., Irvine, W.M., Brewer, M.K. & Turner, B.E., 1996, ApJ, 467, 717.
- Murphy et al. (2001) Murphy, E.M., Sembach, K.R. & Lockman, F.J., 2001, ApJS, (in preparation).
- Myers et al. (1986) Myers, P.C., Dame, T.M., Thaddeus, P., Cohen, R.S., Silverberg, R.F., Dwek, E., & Hauser, M.G., 1986, ApJ, 301, 398.
- Sanders et al. (1986) Sanders, D.B., Clemens, D.P., Scoville, N.Z. & Solomon, P.M., 1986, ApJS, 60, 1.
- Solomon et al. (1987) Solomon, P.M., Rivolo, A.R., Barret, J. & Yahil, A., 1987, ApJ, 319, 730.
- Sanbonmatsu & Helfand (1992) Sanbonmatsu, K.Y. & Helfand, D.J., 1992, AJ, 104, 2189.
- Savage et al. (1977) Savage, B.D., Bohlin, R.C., Drake, J.F. & Buddich, W., 1977, ApJ, 216, 291.
- Spitzer (1978) Spitzer, L., 1978, Physical Processes in the Interstellar Medium, Wiley-Interscience.
- Szymczak et al. (2000) Szymczak, M., Hrynek, G., & Kus, A.J., 2000, A&AS, 143, 269.
- Turner (1979) Turner, B.E., 1979, A&AS, 37, 1.
- Turner (1982) Turner, B.E., 1982, ApJ, 255, L33.
- Turner (1983) Turner, B.E., 1983, “Kinematics, Dynamics and Structure of the Milky Way”, ed. W.L.H. Shuter, Reidel, p. 171.
- Turner (1997) Turner, B.E., 1997, in “Astrophysical Implications of the Laboartory Study of Presolar Materials”, ed. T.J. Bernatowicz & E.K. Zinner, AIP CP402, p. 477.
- Turner & Heiles (1971) Turner, B.E. & Heiles, C., 1971, ApJ, 170, 453.
- Vacca et al. (1996) Vacca, W.D., Garmany, C.D. & Shull, J.M., 1996, ApJ, 460, 914.
- van der Werf et al. (1988) van der Werf, P. P., Goss, W.M. & Vanden Bout, P. A., 1988, A&A, 201, 311.
- Williams & Maddalena (1996) Williams, J.P. & Maddalena, R.J., 1996, ApJ, 464, 255.
- Wood & Churchwell (1989) Wood, D.O.S., & Churchwell, E., 1989, ApJ, 340, 265.
- Yusef-Zadeh et al. (1999) Yusef-Zadeh, F., Goss, W.M., Roberta, D.A., Robinson, B. & Frail, D.A., 1999, ApJ, 527, 172.
| Shell | Core | Tex | ||||||||||
|---|---|---|---|---|---|---|---|---|---|---|---|---|
| Core | Shell | n0 | nr | z0 | M | |||||||
| Model | (pc) | (pc) | (pc) | (pc) | (K) | (K) | (cm-3) | (cm-3) | (pc) | () | ||
| (1) | (2) | (3) | (4) | (5) | (6) | (7) | (8) | (9) | (10) | (11) | ||
| I | 75 | 56 | 75 | 30 | 43.5 | 350 | 4.0 | 1.0 | 4 | |||
| II | 80 | 60 | 75 | 26 | 40 | 400 | 4.0 | 0.6 | 7 | |||
| III | 80 | 56 | 75 | 26 | 42 | 150 | 4.0 | 1.0 | 7 | |||
| IV | 75 | 49 | 52 | 30 | 25 | 350 | 1.0 | 1.1 | 4 | |||
Note. — The semi-major axes of the shell pc for all models.
| rms (mK) | Tpk (mK) | |||
|---|---|---|---|---|
| (1) | (2) | (3) | (4) | (5) |
| 32 | ||||
| 30 | ||||
| 40 | 92 | 5.1 | 75.3 | |
| 40 | 142 | 5.4 | 94.5 | |
| 35 | 180 | 6.7 | 74.7 | |
| 35 | 110 | 4.8 | 96.8 | |
| 30 | ||||
| 37 | ||||
| 34 | 127 | 4.3 | 74.0 | |
| 32 | 245 | 5.8 | 75.7 | |
| 32 | 59 | 5.5 | 95.5 | |
| 30 | ||||
| 36 | ||||
| 35 | 82 | 4.7 | 74.7 | |
| 35 | 275 | 5.9 | 75.5 | |
| 35 | 72 | 5.2 | 97.6 | |
| 33 | ||||
| 34 | ||||
| 33 | ||||
| 35 | 153 | 6.9 | 74.8 |
. Object M (M☉) M (M☉) Extent (pc) (1) (2) (3) (4) (5) G28.17+0.05 G216-2.5
Note. — Line-width for G28.2+0.1 is from H ; for Maddalena’s cloud it is from 12CO. The masses account only for Hydrogen, and a conversion factor of was assumed between N and W(12CO). Properties of G28.17+0.05 are from Model I.