X–RAY ENERGY AND POWER SPECTRA OF SEYFERT 1 AND NARROW LINE SEYFERT 1 GALAXIES: COMPARISON TO BLACK HOLE BINARIES
Abstract
I review observational data on X–ray energy spectra and variability of Seyfert 1 and Narrow Line Seyfert 1 galaxies, and compare them to black hole binary (BHB) systems. There seems to be greater similarity of time averaged properties (i.e. energy spectra) than time variability between the supermassive and stellar-mass black hole accreting systems.
Energy spectra of Seyfert 1 galaxies are similar to BHB in low/hard state, but power spectra of Sy 1 are intermediate in properties between those for hard and soft states of BHB.
There is growing evidence that NLSy 1 are accreting at higher accretion rate than Sy 1, which supports the view that they correspond to soft states of BHB. Again, they are more similar to their stellar counterparts with respect to their spectral properties than to timing properties.
I briefly outline some theoretical ideas which suggest explanations of those differences.
SEYFERT 1 GALAXIES
Energy spectra
Primary continua
Broad band X–ray/–ray spectra of Seyfert 1 galaxies are compatible with Compton upscattering of soft seed photons by energetic, thermal electrons (see reviews in Mushotzky et al. 1993; Zdziarski 1999).
Spectral slopes span a range of values, –2.0, the exact limits being primarily instrument-dependent, but the intrinsic dispersion of parameters does seem to be real (Nandra et al. 1997). Individual values of electron optical depth, , and temperature, , are not reliably estimated due to a number of factors. First attempts used incorrect analytical approximations to Comptonized spectra, which overestimated the temperature and, as a consequence, gave low optical depth, . Later, better models gave keV and (exact values are obviously geometry-dependent). Recent simultaneous ASCA-RXTE-OSSE data of IC 4329a yield keV (Done et al. 2000). On the other hand, a number of BeppoSAX observations suggest rather higher temperatures (see Matt 2000 for review). In particular, data from NGC 5548 prefer keV . These data are compatible with various geometries of the Comptonizing cloud (slab, hemisphere, sphere). Fitting detailed spectral model for each geometry yields different values of , and reflection amplitude (Petrucci et al. 2000).
The X–ray reprocessed component
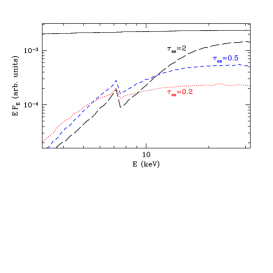
The spectral component (Compton-reflected continuum and Fe fluorescent Kα line) due to reprocessing by cool, optically thick plasma is ubiquitously present in Sy 1 spectra. There is increasing evidence that it consists of two components: one coming from an accretion disk close to the central BH and X–ray source, the other coming from a distant reprocessor, most likely the molecular torus invoked in AGN unification models. The evidences come from many directions: the most direct one are the BeppoSAX observations of NGC 4051, when the central X–ray source ”switched off” and the only detectable emission came in the form of pure reprocessed component (Guainazzi et al. 1998). Additional narrow Fe Kα line component was detected in some sources through direct modeling of good quality data (MCG 5-23-16, Weaver et al. 1997; IC 4329a; Done et al. 2000; see also Lubiński & Zdziarski 2000). Interestingly, Lubiński & Zdziarski (2000) claim that the narrow Kα line in average ASCA spectra is not accompanied by the Compton-reflected continuum, i.e. the reprocessing material is not Thomson thick. However, even if the reprocessor is optically thin(ish), the K shell absorption edge should be detectable in the data. The measured equivalent width of the narrow line, eV, requires , i.e. , for the torus half-opening (funnel) angle of . Such a reprocessor would produce the reflected continuum which, below 10 keV, is not suppressed compared to the usual, optically thick reprocessing (Fig. 1).
Yet another evidence for two reprocessors comes from considerations involving X–ray variability: the reprocessed component seems to be generally less variable than the primary continuum (Reynolds 2000; Chiang et al. 2000; Done et al. 2000). A contribution from a distant, hence constant component makes this fact easier to understand.
Of paramount importance for constraining theoretical models is the amplitude (and other parameters) of the disk–reprocessed component. Its amplitude is however uncertain, since the spectral decomposition into the two components is not unique. In NGC 4051 the solid angle of the distant torus seems to be quite large, , which should be then subtracted from the total amplitude, if this value is universal. If the torus is Thomson thin, no correction is necessary, provided that the amplitude is determined from fitting broad band spectra. However, even without the correction the data suggest that the amplitude, at least in some sources, is , where () corresponds to an isotropic source above a cold (i.e. metals not ionized), flat, infinite disk (Magdziarz et al. 1998; Chiang et al. 2000; Done et al. 2000; Lubiński & Zdziarski 2000). One source where the amplitude is certainly is MCG –6-30-15 (Lee et al. 1999).
The Fe spectral features superimposed on the reflected continuum are not sharp, but broadened and smeared (Tanaka et al. 1995). The standard interpretation is that the reprocessing takes place in the accretion disk, close to the central black hole, so the smearing is due to Doppler effect and gravitational redshift. Broadening by Comptonization in transmission can indeed be ruled out (see Reynolds and Wilms 2000 and references therein), but contribution from Comptonization in reflection is a possibility (Karas et al. 2000). The inner radius of the reprocessing disk, as inferred from the smearing, is usually larger than the last stable orbit ( in Schwarzchild metric), for the irradiation emissivity . The best known case of very broad line in MCG–6-30-15 (Tanaka et al. 1995; Iwasawa et al. 1996) seems to be an exception rather than a rule. Analysis of ASCA data (Nandra et al. 1997) already showed a range of the smearing parameters. Detailed analysis of ASCA–RXTE data of IC 4329a (Done et al. 2000) gives the inner radius –, depending on Fe abundance and source inclination. Similar values are obtained for NGC 5548 (Chiang et al. 2000 and J. Chiang, private communication). Re-analysis of ASCA data by Lubiński & Zdziarski (2000) gives compatible with for their softer sub-samples of objects, but at high significance for the hard sub-sample.
Of certain importance for correct, quantitative determination of from relativistic smearing is using models that apply the smearing to both the Fe Kα line and absorption edge (Życki et al. 1997). The decomposition of counts into spectral features and continuum crucially depends on details of the shape of the model.
Correlations between parameters
A number of correlations between spectral parameters is observed.
Sample of objects. In a sample of Ginga data (Seyfert 1 galaxies, X–ray binaries with both BH and NS central objects) analysed homogeneously by Zdziarski et al. (1999) a correlation was found between the spectral slope of the primary power law, , and the amplitude of the reprocessed component, . Softer spectra (larger ) contain stronger reprocessed components. The correlation appears to be very significant, even correcting for the intrinsic – correlation in the data fitting procedure. Individual values of and are not always reliably estimated, especially at the extremes of the correlation, e.g. for MCG–6-30-15 from broad band RXTE data is (Lee et al. 1999) rather than as in Zdziarski et al. (1999). The correlation is also seen in the BeppoSAX sample of Seyfert 1 galaxies (Matt 2000) as well as in a sample of ASCA data (Lubiński & Zdziarski 2000).
Moreover, a correlation between the spectral width of the Fe Kα line and (or ) is observed: the line is broader when the spectrum is steeper and larger (Lubiński & Zdziarski 2000; Zdziarski, these proceedings).
Time histories of individual objects. The – correlation was also observed in time histories of individual objects. Significant correlation () was found in series of Ginga observations of NGC 5548 (Magdziarz et al. 1998), although Chiang et al. (2000) report much weaker correlation in RXTE data, formally consistent with constant for changing by 0.2. The correlation was observed in Ginga data of Nova Muscae 1991 (Życki et al. 1998ab), during the source’s decline after outburst. It is also seen in GX 339-4, both in Ginga data (Ueda et al. 1994; Zdziarski et al. 1999) and RXTE data (Revnivtsev et al. 1999b, Gilfanov et al. 2000b).
The fact that the – correlation seems to be present both in a sample of objects and in time histories of individual objects is not a trivial one. Variations of parameters between different objects in a sample are not necessarily caused by the same mechanism as time variations of parameters in a history of a given object.
Time variability
Power density spectra
Power density spectra (PDS) of X–ray variability show generally power law shapes, , with slopes –2 (Lawrence et al. 1987; McHardy & Czerny 1987). Breaks (flattening to with ) in the PDS are thus expected at low to avoid divergent power. First attempts to find the breaks used EXOSAT long–look data, where a break was reported in NGC 5506 near Hz (McHardy 1989). Further cases were found in Ginga data (Hayashida et al. 1998 and references therein). RXTE campaigns brought good quality data which enabled determination of PDS for a number of sources. Clear break at – Hz is seen in PDS of NGC 3516, although it precise position and shape is uncertain (Edelson & Nandra 1999). A break at Hz is suggested by the RXTE-ASM data of NGC 5548 (change of slope from to ), with further steepening to at Hz, when RXTE-PCA and ASCA data added (Chiang et al. 2000). From RXTE-PCA and ASCA data alone a break at Hz is seen in MCG–6-30-15 (Nowak & Chiang 2000).
Integrated r.m.s. amplitude of variability is 20%–30% (Edelson 2000).
Time lags
Time lags between different energy bands are expected if the X–rays are indeed produced by inverse-Compton process. However, no significant time lags between the hard, RXTE-PCA band and the soft, ASCA band have been detected so far. In MCG –6-30-15 the lag between the 8–15 keV RXTE band and the soft, 0.5–1 keV ASCA band is consistent with 0, with the 90% upper limit of 2 ksec (Nowak & Chiang 2000). Similarly, no time lag was detected between the 0.5–2 keV ASCA band and RXTE-PCA, 2–10 keV band in NGC 3516 (Edelson et al. 2000). In NGC 5548 the lag between the 2–20 keV RXTE-PCA band and the 0.5–1 keV ASCA band is ksec (99% confidence limits). Significant lags were detected in NGC 5548 between the RXTE-PCA band and the EUVE band (around 0.1 keV) of ksec, and between the ASCA band and the EUVE band by ksec, both being 99% confidence limits (Chiang et al. 2000).
Comparison to black hole binaries
Energy spectra
There is a general similarity between hard X–ray spectra of Seyfert 1s and BHB in low/hard state. Both classes show a range of spectral indices, amplitudes of reflection and relativistic smearing of Fe spectral features.
Individual, well-studied cases of BHB include Cyg X-1 (Poutanen et al. 1997; Gierliński et al. 1997; Dove et al. 1997; Done & Życki 1999; Di Salvo et al. 2000), GX 339-4 (Ueda et al. 1994; Zdziarski et al. 1998; Wilms et al. 1999), LMC X-3 (Boyd et al. 2000). Results are reviewed and summarized in Poutanen (1998) and Done (these proceedings).
The observed, hard () spectral slopes indicate photon-starved plasma, compared to uniform, static disk-corona models (Haardt & Maraschi 1991). At least three models can explain the observed range of parameters and correlations (see Di Salvo et al. 2000 for recent discussion and application to Cyg X–1): truncated standard disk with inner hot flow (Esin et al. 1997; Meyer, Liu & Meyer-Hofmeister 2000; Różańska & Czerny 2000), relativistic plasma ejection from magnetic flares (Beloborodov 1999) and accretion disk with a ”hot skin” (Nayakshin et al. 2000; Życki & Różańska 2000). However, only the first one naturally explains the general absence of the broadest (most strongly relativistically smeared) component of the reprocessed spectrum, i.e. the fact that in most spectra the inner disk radius, , as inferred from fitting the shape of the Fe Kα line and edge is larger than the marginally stable orbit. A rather dramatic change of structure of the disk–active corona system at would be required to remove the broadest components in the other models (e.g. thickness of the “hot skin” for ), while the predicted radial dependencies do not show any discontinuities (Życki & Różańska 2000). Since the inferred values of are similar in Sy 1 and BHB (20–100 ), the relevant mechanism should be at most only weakly dependent on central mass. This excludes e.g. radiation pressure instabilities which affect much more strongly the SS disks around supermassive black holes than the stellar mass ones. On the other hand, predicted by the disk evaporation model of Różańska & Czerny (2000) are independent of the central mass. Presence of a characteristic radius is also supported by the correlated spectral–temporal behavior observed in e.g. Cyg X–1, where correlations are seen between the spectral slope, amplitude of the reprocessed component and the peak of the PDS (Gilfanov et al. 1999).
Time variability
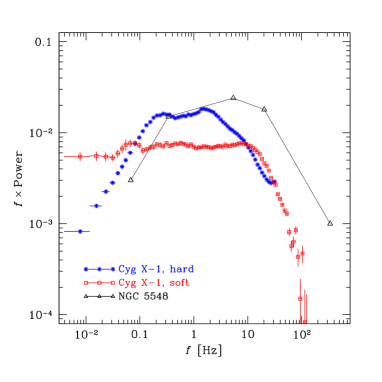
PDS. Observations of time variability of BHBs are much easier than AGNs on almost all time scales except for the dynamical time scale, sec. Therefore positions of the breaks in the PDSs of the former objects were determined more accurately, and were used to estimate BH masses in AGNs, whenever a break in PDS of an AGN was found. In a variant of the method, Hayashida et al. (1998) used the frequency at which the value of PDS () is . An implicit assumption here is obviously that the variability mechanisms are the same in both classes and the only dependence is through the central mass (i.e. the characteristic size measured in gravitational radii is the same). With more reliable independent mass estimates of central BH in Sy 1s, it became possible to use an AGN PDS as the reference, and to test the implicit assumption of the previous method. This has been done by Czerny et al. (2000) who adopted NGC 5548 as the reference object. Central BH mass estimated by a number of methods is close to , while its PDS was determined thanks to RXTE monitoring campaign (Chiang et al. 2000). Comparison to Cyg X–1 PDS in both the low/hard and soft states (data from Gilfanov et al. 2000a) reveals important differences between them, both in the position of the break and the overall normalization. Frequency-integrated r.m.s. variability is larger for NGC 5548 than for either spectral state of Cyg X-1 (NGC 5548: 35%, Cyg X-1, hard state: 28%, Cyg X-1, soft state 24%). Even more importantly, Czerny et al. (2000) draw attention to the fact that it is the higher- break (where the slope changes to ), which is more relevant for mass comparison, since the lower- break is luminosity dependent (e.g. Belloni & Hasinger 1990). Position of the high- break in NGC 5548 agrees with similar break in the soft state of Cyg X–1 rather than in the hard state PDS ( see Fig. 2).
Time lags. The issue of time lags between different X-ray bands has received a lot of attention during the last couple of years, mainly thanks to a wealth of new data from RXTE. The lags were determined for many BHB over a broad range of Fourier frequencies (e.g. Cyg X–1: Miyamoto et al. 1988; Cui et al. 1997; Nowak et al. 1999a; GX 339-4: Nowak et al. 1999b). They range from almost 0.1 sec at Hz to sec at Hz (exact values obviously depend on energy bands). The lags seem to scale with the mass of central BH in roughly the same way as the PDS do (see Nowak & Chiang 2000 for MCG –6-30-15). The time lags are surprisingly long: at the frequency where the PDS peaks, the lags are times longer than the light crossing time scale of the region, where most of the gravitational energy is dissipated.
Spectral–temporal correlations. Important correlations are found between spectral and temporal parameters. In the hard state of Cyg X–1 the reprocessed component does not respond to primary continuum variability on time-scales shorter than sec (Revnivtsev et al. 1999a; Gilfanov et al. 2000a). The same seems to be true for Sy 1s: as already mentioned, a number of RXTE observations of Sy 1 show the reprocessed component to be surprisingly weakly variable on time scales of day.
X–ray spectral slope – flux relations
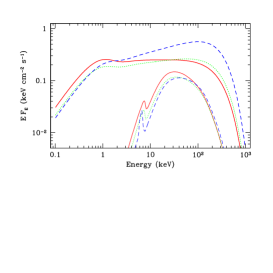
A variety of behaviour is observed here. RXTE data of IC 4329a (Done et al. 2000; Madejski et al. these proceedings) show softening of the spectrum when the source brightens on days time scale. The same correlation is seen on very long time scale (months for BHB, i.e. not observable for AGN), when SXT decline from outburst, from soft spectra at high luminosities to hard spectra at low luminosities. It is thus interesting to note that during the gradual decline of Nova Muscae 1991, when the source was already in low/hard state, the gradual hardening of the X–ray slope (Życki et al. 1998ab), was accompanied by an increase of the source X–ray luminosity (so called re-flare; Fig.3). Yet another example is the low/hard state of Cyg X–1, where the source showed almost stable spectral shape even though its hard X–ray luminosity seemed to have changed by a factor of (Gierliński et al. 1997).
Discussion
X–ray sources in Seyfert 1 galaxies seem to be more similar to their small mass counterparts in BHB with respect to their energy spectral characteristic, than to the temporal behaviour. As the energy spectra are “time envelopes” of the inverse-Compton upscattering process (Hua & Titarchuk 1996), they may, as such, correspond to a number of different temporal characteristics (see Życki 2000 for another example). Both aspects (and correlations between them) need to be studied carefully in order to discriminate between models.
A number of specific models for generating X–ray light curves with observed properties were proposed (see Poutanen 2000 for review). Two of the models seem to be most promising: the magnetic flares model (Poutanen & Fabian 1999) and the drifting blobs model (Bötcher & Liang 1999). The former model fits the scenario invoking magnetically active corona as the source of hard X–rays, whilst the latter fits the scenario of truncated disk with inner hot flow. Both models can in principle be applied to both BHB and Seyfert 1a, although the discussion so far concentrated on the BHB case. With both scenarios the light curves are modeled as superpositions of individual flares, with possible correlations between the flares (“avalanches”) to account for the long time scale where the PDS peaks. This approach is vindicated by e.g. results of non-linear prediction method analysis of light curves, demonstrating that a stochastic type of process is favoured as the origin of X–ray variability (Czerny & Lehto 1997). Both models explain the hard X–ray lags as a result of spectral evolution (hardening) during the flares, and so remove the need for a very spatially extended X–ray source (), necessary, if the lags were simply interpreted as photon diffusion time.
Possible differences in time variability between Sy 1 and BHB may be related to different contribution of radiation pressure to total pressure in accretion disks around supermassive and stellar mass BH, in connection with the disk evaporation model of Różańska & Czerny (2000). They show that the unstable branch in the – diagram is much less pronounced in BHB than in AGN, if the evaporation branch is added to the solution. Perhaps the disks in BHB are stable and the entire variability comes from properties of the Comptonization process (Churazov et al. 2000), but the unstable disks in Sy 1 cause additional variability of the seed photons and parameters of the hot, Comptonizing plasma.
NARROW LINE SEYFERT 1 GALAXIES
Energy spectra – comparison to (broad lines) Seyfert 1 galaxies
X–ray spectra ( keV) of NLSy 1 contain a strong, soft component above extrapolated hard X–ray power law (Leighly 1999b; Comastri 2000). This contrasts with the situation in BLSy 1, where the presence of soft X–ray excesses was not confirmed by BeppoSAX (Matt 2000). Precise shape of the soft component is difficult to determine, since various models seem to fit the data (almost) equally well, if only X–ray data are used. In particular, in some sources the best fit (for the soft component alone) is provided by a simple blackbody or double blackbody, while a power law is preferred for other sources (Comastri 2000), perhaps indicating Comptonized emission. Such Comptonized soft excess was clearly detected in multi wavelength data of PG 1211+143 (Janiuk et al. 2000b), and PKS 0558–504 using XMM-Newton data (O’Brien et al. 2000).
Spectral slopes in the ASCA band are softer for NLSy 1 than for BLSy 1 (Brandt et al. 1997; Leighly 1999b). Mean slope in BLSy 1 is while it is for NLSy 1 (Leighly 1999b).
The ratio of luminosities in the soft and hard X–ray components spans a broad range of values. For example, the ratio of luminosities was computed from BeppoSAX data (Comastri 2000). It ranges from to .
Their narrower emission lines (compared to BLSy 1) are consistent with the higher temperature of the soft, disk component and steeper X–ray spectrum through photo-ionization modeling (Kuraszkiewicz et al. 2000 and references therein).
Reprocessed components
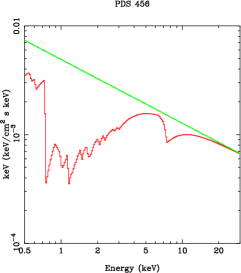
A number of recent analyzes suggest that the reprocessing medium in NLSy1 is rather more strongly ionized than in BLSy1. Published results include Ton S 180, Ark 546, PDS 456 (see reviews and references in Comastri 2000 and Pounds & Vaughan 2000). Those results are not always reliable however, since simplified models were sometimes used. Proper model should include both the Fe Kα line and the Compton reflected continuum, with ionization effects computed consistently for both. Also, relativistic effects, if present, affect both the line and the K-edge. Nevertheless, re-analysis of some of the published data, using the rel-repr reprocessing model of Życki et al. (1997) generally confirms those results (Janiuk et al. 2000a). Contour plots of (Fig. 4) show however that quantitative results on ionization and relativistic effects are dependent upon the model for the continuum. In one case, PDS 456, our re-analysis of simultaneous ASCA–RXTE observation suggests different interpretation to that previously published (Reeves et al. 2000). We find that double warm absorber gives much better fit to the data than any model involving the reprocessed component (Fig 4). Simple fits to ASCA 0.8–10 keV data give:
1. wabs( powerlaw ): , ;
2. wabs*absori(powerlaw): , , and the main improvement comes from modeling the Fe K-shell edge;
3. wabs(powerlaw + rel-repr): ,
4. wabs*absori*absori(powerlaw): ,
5. adding now the rel-repr model does not improve the fit.
It is clear that only the continuum slope in fit no. 4 can be compatible with RXTE data. Fitting the double warm absorber to combined ASCA–RXTE data (the latter in the 4–20 keV band) gives a good fit with , and again adding the rel-repr model does not improve the fit. The model containing a single ionized absorber and reflector, wabs*absori*(powerlaw + rel-repr), can give a fit of comparable quality (, i.e. worse by ), provided that the Kα line is artificially suppressed (while the amplitude ). However, the inferred ionization of the reprocessor is not compatible with the resonant Auger destruction of the line photons. The double warm absorber is similar to that required to explain the MCG –6-30-15 data, although the columns required for PDS 456 are an order of magnitude larger, in excess of .


Time variability
NLSy 1 galaxies generally show stronger X–ray variability than BLSy 1s. Some ROSAT (0.1–2 keV) observations showed dramatic variability with giant flares, with flux increase by a factor of 3–5, within a day (see Boller 2000 for recent review). Best known examples are IRAS 13224-3809 (Boller et al. 1997), PHL 1092 (Brandt et al. 1999) and PKS 0558-504 (Gliozzi et al. 2000). However, no systematic study of ROSAT variability of all NLSy 1s has been done.
Systematic study of variability in ASCA data shows that indeed they are more strongly variable than BLSy 1 in the harder X–ray band (Leighly 1999a), showing larger excess variance at a given luminosity. All the three above mentioned extreme ROSAT sources show above-average variability in ASCA (see fig. 8 in Leighly 1999a). Within the ASCA band NLSy1s are more strongly variable at lower energies than at higher energies. The ratio (Leighly 1999a and K. Leighly, private communication).
Systematic study of NLSy 1s variability with RXTE have not been completed yet. One object for which a monitoring campaign was done, Ark 564, does not show any enhanced variability compared to BLSy 1a studied (Edelson 2000), with r.m.s. variability of 25%. The r.m.s. variability for another object, PG 1211+143, is somewhat higher, about 34% (Janiuk et al. 2000b).
Comparison to black hole binaries
The overall energy spectral characteristics of NLSy 1 immediately suggest that these objects may be suppermassive analogs of Galactic BHB in high/soft state (Pounds et al. 1995; Boller et al. 1996). If so, they accrete at higher than BLSy 1. The latter inference is supported by the ionized reprocessed components present in their spectra (see eq. 4 in Ross & Fabian 1993), and continuum modeling (Kuraszkiewicz et al. 2000).
Energy spectra
Presence of a strong, soft component is a defining feature of a soft spectral state of BHB. The hard component may but does not need to be present. A soft state is usually called Very High State, if a strong hard component is present, and High State if the hard component is weak. Sometimes an Intermediate State is introduced, with properties intermediate between the High State and Low State (Esin et al. 1997). NLSy 1 can probably correspond to any soft state. Those with a strong hard component would correspond to Very High or Intermediate state, while those with a weak hard component to High State.
The ASCA spectral indices of NLSy 1 are similar to those of BHB in soft states. For example, Nova Muscae 1991 had in its IS spectrum, similarly Cyg X-1 showed spectrum with in its soft state (note that the soft state of Cyg X–1 seems to correspond of IS of soft X–ray transients, rather than HS, as the bolometric luminosity is virtually unchanged compared to LS).
The ratio in BHB can attain very large values when a weak hard tail is present, down to in IS (from Nova Muscae 1991 data). Similarly, a range of values is seen in NLSy 1s.
A characteristic feature of hard X–ray/–ray emission of BHB in soft states is the lack of high energy cutoff in the spectra (Grove et al. 1998), indicating perhaps an inverse Compton process on a non-thermal population of electrons. This is certainly true for the IS, where Cyg X–1 is the best example (Gierliński et al. 1999). Similarly, GRANAT spectra of Nova Muscae 1991 in VHS do not seem to have any cutoff below keV (Gilfanov et al. 1993). GRO J1655-40 may have been in HS or even VHS when observed by CGRO/OSSE in 1996, with the spectrum showing no cutoff at least below keV (Grove et al. 1998). Unfortunately, no such data exist for NLSy 1, and studying the soft -ray spectra of those objects is not going to be feasible in near future.
The soft components in the soft state spectra of BHB are usually not well described by a simple blackbody, or multicolor (disk) blackbody models (contrary to results using simplified spectral models). Additional Comptonization of the seed, (disk)blackbody photons is often required (i.e. beside the hard component extending to keV). This has been seen in Nova Muscae 1991 (Życki et al. 1998a), Cyg X–1 (Gieliński et al. 1999), GRS 1915+105 (Vilhu & Nevalainen 1998), GS 2000+25, XTE J1550-564, GRO J1655-40 (Życki et al., in prep.; see also Życki 2000). Interestingly, similar component is seen in multi wavelength spectrum of a NLSy 1 PG 1211+143 (Janiuk et al. 2000b), and in the XMM-Newton spectrum of PKS 0558-504 (O’Brien et al. 2000).
The lower disk temperatures in NLSy 1 than in BHB means also that the X–ray reprocessed component in the former objects can be expected to be rather less strongly ionized than in corresponding states of BHB. This indeed seems to be supported from modeling the data.
Time variability
Again, while the energy spectra of NLSy 1s appear to be similar to their stellar counterparts, their variability characteristics are very different. Generally, in BHB the soft state is the less strongly variable one (review in van der Klis 1995), while the opposite seems to be true for the AGNs.
The ASCA data clearly show stronger variability in NLSy 1s than in BLSy 1s (Leighly 1999a), but it is rather unclear whether it is the hard, Comptonized component or the soft, disk component (or both) that varies more strongly in NLSy 1s than in BLSy 1s. In any case, variability of the hard, Comptonized component in NLSy 1s is not reduced compared to BLSy 1s.
In BHB the situation is even less clear. The hard X–ray power law is present in VHS and IS. In VHS the r.m.s. variability amplitude of the hard component is clearly lower than in low/hard state: vs. (Belloni et al. 1997 and Takizawa et al. 1997 for VHS of Nova Muscae 1991). In the IS Nova Muscae 1991 showed similarly reduced variability of the hard component (Belloni et al. 1997). However, Cyg X–1 shows basically the same r.m.s. variability of its hard X–ray component in the soft state as in its hard state (Cui et al. 1997; Gilfanov et al. 2000a).
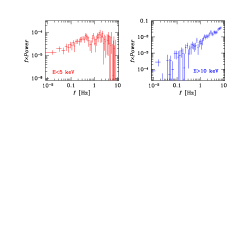
The soft, disk component in NLSy 1s can show dramatic variability as evidenced by the ROSAT examples. This component is clearly only very weakly variable in soft states of BHB (van der Klis 1995; Belloni et al. 1997). Figure 5 show PDS of Nova Muscae 1991 on 16 Jan, when the source was in VHS and its spectrum was dominated by a strong soft component.
In the soft state of Cyg X–1 the reprocessed component was observed to respond to primary variability on much shorter time-scale than in the hard state (Revnivtsev et al. 1999a; Gilfanov et al. 2000a). While the situation in the hard state seems to have its correspondence in the observed lack of reverberation signatures in some BLSy 1s, as discussed in previous Section, no studies of variability of the reprocessed component were performed in NLSy 1s. It is however interesting to note that the opposite behaviour of variability as function of energy was observed in BLSy 1s and in NLSy 1s: in NLSy 1s the harder, 7–10 keV, band varies more strongly than the softer, 2–4 keV, band (Edelson 2000). If rapid variability of the reprocessed component in NLSy 1s could be verified, the analogy between BHB and NLSy 1s would certainly be more exact.
ACKNOWLEDGMENTS
I thank B. Czerny, C. Done, A. Janiuk, G. Madejski and A. Różańska for collaboration and discussions. This work was supported in part by KBN grants no. 2P03D01816 and 2P03D01718
References
- [1]
- [2] Belloni, T., and G. Hasinger, Variability in the noise properties of Cygnus X-1, A&A, 227, L33-L36, 1990
- [3] Belloni, T., M. van der Klis, W. H. G. Lewin, J. van Paradijs, T. Dotani et al., Energy dependence in the quasi-periodic oscillations and noise of black hole candidates in the very high state, A&A, 322, 857-867, 1997
- [4] Beloborodov, A. M., Plasma ejection from magnetic flares and the X-ray spectrum of Cygnus X-1, ApJ, 510, L123-L126, 1999
- [5] Boller, T., W. N. Brandt, and H. Fink, Soft X-ray properties of narrow-line Seyfert 1 galaxies, A&A, 305, 53-73, 1996
- [6] Boller, T., W. N. Brandt, A. C. Fabian, and H. Fink, ROSAT monitoring of persistent giant and rapid variability in the narrow-line Seyfert 1 galaxy IRAS 13224-380, MNRAS, 289, 393-405, 1997
- [7] Boller, T., ROSAT results on narrow-line Seyfert 1 galaxies, NewAR, 44, 387-394, 2000
- [8] Boyd, P. T., A. P. Smale, J. Homan, P. G. Jonker, M. van der Klis, et al., Canonical Timing and Spectral Behavior of LMC X-3 in the Low/Hard State, ApJ, 542, L127-L130, 2000
- [9] Böttcher M., and E. P. Liang, A New Model for the Hard Time Lags in Black Hole X-Ray Binaries, ApJ, 511, L37-L40, 1999
- [10] Brandt, W. N., S. Mathur, and M. Elvis, A comparison of the hard ASCA spectral slopes of broad- and narrow-line Seyfert 1 galaxies, MNRAS, 285, L25-L30, 1997
- [11] Brandt, W. N., T. Boller, A. C. Fabian, and M. Ruszkowski, ROSAT High-Resolution Imager monitoring of extreme X-ray variability in the narrow-line quasar PHL 1092, MNRAS, 303, L53-L57 , 1999
- [12] Chiang, J., C. S. Reynolds, O. M. Blaes, M. A. Nowak, N. Murray, et al., Simultaneous EUVE/ASCA/RXTE Observations of NGC 5548, ApJ, 528, 292-305, 2000
- [13] Churazov, E., M. Gilfanov, and M. Revnivtsev, Soft state of Cygnus X-1: stable disk and unstable corona, MNRAS, in press, 2000, (astro-ph/0006227)
- [14] Comastri, A., The BeppoSAX view of NLS1s, NewAR, 44, 403-410, 2000
- [15] Cui, W., S. N. Zhang, W. Focke, and J. H. Swank, Temporal Properties of Cygnus X-1 during the Spectral Transitions, ApJ, 484, 383-393, 1997
- [16] Czerny, B., and H. J. Lehto, Testing the X-ray variability of active galactic nuclei with the non-linear prediction method, MNRAS, 285, 365-373, 1997
- [17] Czerny, B., M. Piasecki, J. Kuraszkiewicz, and M. Nikołajuk, Black hole masses from power density spectra: determinations and consequences, MNRAS, 2000, submitted, (astro-ph/0009200)
- [18] Di Salvo, T., C. Done, P. T. Życki, L. Burderi, N. R. Robba, Probing the Inner Region of Cyg X-1 in the Low/Hard State through its X-ray Broad Band Spectrum, ApJ, 2000, in press, (astro-ph/0010062)
- [19] Done, C., and P. T. Życki, Relativistic distortions in the X-ray spectrum of CYG X-1, MNRAS, 305, 457-468, 1999
- [20] Done, C., G. M. Madejski, and P. T. Życki, The Relativistic Iron Line Profile in the Seyfert 1 Galaxy IC 4329A, ApJ, 536, 213-224, 2000
- [21] Dove, J., J. Wilms, M. Maisack, and M. C. Begelman, Self-Consistent Thermal Accretion Disk Corona Models for Compact Objects, ApJ, 487, 759-768, 1997
- [22] Edelson, R., and K. Nandra, A Cutoff in the X-Ray Fluctuation Power Density Spectrum of the Seyfert 1 Galaxy NGC 3516, ApJ, 514, 682-690, 1999
- [23] Edelson, R., X-Ray variability of NLS1s and BLS1s, NewAR, 44, 423-425, 2000
- [24] Edelson, R., A. Koratkar, K. Nandra, M. Goad, B. M. Peterson, et al., Intensive HST, RXTE, and ASCA Monitoring of NGC 3516: Evidence against Thermal Reprocessing, ApJ, 534, 180-188, 2000
- [25] Esin, A. A., J. E. McClintock, and R. Narayan, Advection-dominated Accretion and the Spectral States of Black Hole X-Ray Binaries: Application to Nova MUSCAE 1991, ApJ, 489, 865-889, 1997
- [26] Gierliński, M., A. A. Zdziarski, C. Done, W. N. Johnson, K. Ebisawa, et al., Simultaneous X-ray and gamma-ray observations of CYG X-1 in the hard state by GINGA and OSSE, MNRAS, 288, 958-964, 1997
- [27] Gierliński, M., A. A. Zdziarski, J. Poutanen, P. S. Coppi, K. Ebisawa, et al., Radiation mechanisms and geometry of Cygnus X-1 in the soft state, MNRAS, 309, 496-512, 1999
- [28] Gilfanov, M., E. Churazov, R. Sunyaev, S. Grebenev, M. Pavlinsky, et al., The spectra of Nova MUSCAE 1991 between 3 keV and 1 MeV observed with GRANAT, A&AS, 97, 303-307, 1993
- [29] Gilfanov, M., E. Churazov, and M. Revnivtsev, Reflection and noise in Cygnus X-1, A&A, 352, 182-188, 1999
- [30] Gilfanov, M., E. Churazov, and M. Revnivtsev, Frequency-resolved spectroscopy of Cyg X-1: fast variability of the reflected emission in the soft state, MNRAS, 316, 923-928, 2000a
- [31] Gilfanov, M., E. Churazov, and M. Revnivtsev, Comptonization, reflection and noise in black hole binaries, in Proc. of the 5th CAS/MPG Workshop on High Energy Astrophysics, 2000b, in press, (astro-ph/0002415)
- [32] Grove, J. E., W. N. Johnson, R. A. Kroeger, K. McNaron-Brown, J. G. Skibo, et al., Gamma-Ray Spectral States of Galactic Black Hole Candidates, ApJ, 500, 899-908, 1998
- [33] Guainazzi, M., F. Nicastro, F. Fiore, G. Matt, I. McHardy, et al., A swan song: the disappearance of the nucleus of NGC 4051 and the echo of its past glory, MNRAS, 301, L1-L4, 1998
- [34] Haardt F., and L. Maraschi, A two-phase model for the X-ray emission from Seyfert galaxies, ApJ, 380, L51-L54, 1991
- [35] Hayashida K., S. Miyamoto, S. Kitamoto, H. Negoro, and H. Inoue, Central Black Hole Masses in Active Galactic Nuclei Inferred from X-Ray Variability, ApJ, 500, 642-659, 1998
- [36] Hua, X.-M., and L. Titarchuk, Time Variation of Emissions from Comptonization Sources, ApJ, 469, 280-304, 1996
- [37] Iwasawa, K., A. C. Fabian, C. S. Reynolds, K. Nandra, C. Otani, et al., The variable iron K emission line in MCG-6-30-15, MNRAS, 282, 1038-1048, 1996
- [38] Janiuk, A., B. Czerny, and G. M. Madejski, The nature of emission components in the quasar/NLSy1 PG 1211+143, ApJ, 2000b, submitted
- [39] Janiuk, A., P. T. Życki, and B. Czerny, X-ray reprocessing in Narrow-Line Seyfert 1 Galaxies: Ton S180 and Ark 564, NewAR, 44, 1003-1003, 2000a, (astro-ph/0005156)
- [40] Karas, V., B. Czerny, A. Abrassart, and M. A. Abramowicz, A cloud model of active galactic nuclei: the iron K line diagnostics, MNRAS, 318, 547-560, 2000
- [41] Kuraszkiewicz, J., B. J. Wilkes, B. Czerny, and S. Mathur, What Do the Ultraviolet Spectra of Narrow-Line Seyfert 1 Galaxies Tell Us about Their Broad-Line Regions?, ApJ, 542, 692-702, 2000
- [42] Lawrence A., M. G. Watson, K. A. Pounds, and M. Elvis, Low-frequency divergent X-ray variability in the Seyfert galaxy NGC4051 Nature, 325, 694-696, 1987
- [43] Lee, J. C., A. C. Fabian, W. N. Brandt, C. S. Reynolds, and K.Iwasawa, First constraints on iron abundance versus reflection fraction from the Seyfert 1 galaxy MCG-6-30-15, MNRAS, 310, 973-981, 1999
- [44] Leighly, K. M., A Comprehensive Spectral and Variability Study of Narrow-Line Seyfert 1 Galaxies Observed by ASCA. I. Observations and Time Series Analysis, ApJS, 125, 297-316, 1999a
- [45] Leighly, K. M., A Comprehensive Spectral and Variability Study of Narrow-Line Seyfert 1 Galaxies Observed by ASCA. II. Spectral Analysis and Correlations, ApJS, 125, 317-348, 1999b
- [46] Lubiński, P., and A. A. Zdziarski, The strength and width of Fe K lines in Seyferts and their correlations with the X-ray slope, MNRAS, 2000, submitted, astro-ph/0009017
- [47] Magdziarz P., O. M. Blaes, A. A. Zdziarski, W. N. Johnson, and D. A. Smith, A spectral decomposition of the variable optical, ultraviolet and X-ray continuum of NGC 5548, MNRAS, 301, 179-192, 1998
- [48] Matt, G., The broad band spectrum and variability of Seyfert 1, in X-Ray Astronomy 1999, eds G. Malaguti, G. Palumbo and N. White, Gordon & Breach, Singapore, 2000, in press, (astro-ph/0007105)
- [49] McHardy, I., and B. Czerny, Fractal X-ray time variability and spectral invariance of the Seyfert galaxy NGC 5506, Nature, 325, 696-698, 1987
- [50] McHardy, I., X-ray variability of Active Galactic Nuclei, in Two Topics in X–Ray Astronomy, eds. J. Hunt and B. Battrick, pp. 1111-1124, ESA SP-296, 1989
- [51] Meyer, F., B.F. Liu, and E. Meyer-Hofmeister, Black hole X-ray binaries: a new view on soft-hard spectral transition, A&A, 354, L67-L70, 2000
- [52] Miyamoto, S., S. Kitamoto, K. Mitsuda, and T. Dotani, Delayed hard X-rays from Cygnus X-1, Nature, 336, 450-452, 1988
- [53] Mushotzky, R. F., C. Done, and K. A. Pounds, X-ray spectra and time variability of active galactic nuclei, ARA&A, 31, 717-761, 1993
- [54] Nandra, K., I. M. George, R. F. Mushotzky, T. J. Turner, and T. Yaqoob, ASCA Observations of Seyfert 1 Galaxies. II. Relativistic Iron K Emission, ApJ, 477, 602-622, 1997
- [55] Nayakshin S., D. Kazanas, and T. R. Kallman, Thermal Instability and Photoionized X-Ray Reflection in Accretion Disks, ApJ, 537, 833-852, 2000
- [56] Nowak, M. A., B. A. Vaughan, J. Wilms, J. B. Dove, and M. C. Begelman, Rossi X-Ray Timing Explorer Observation of Cygnus X-1. II. Timing Analysis, ApJ, 510, 874-891, 1999
- [57] Nowak, M. A., J. Wilms, and J. B. Dove, Low-Luminosity States of the Black Hole Candidate GX 339-4. II. Timing Analysis, ApJ, 517, 355-366, 1999b
- [58] Nowak, M. A., and J. Chiang, Implications of the X-Ray Variability for the Mass of MCG -6-30-15, ApJ, 531, L13-L16, 2000
- [59] O’Brien P. T., J. N. Reeves, M. J. L. Turner, K. A. Pounds, M. Page, et al., XMM-Newton Detection of a Comptonized Accretion Disc in the Quasar PKS 0558-504, A&A, 2000, in press, (astro-ph/0010386)
- [60] Petrucci, P. O., F. Haardt, L. Maraschi, P. Grandi, G. Matt, et al., Testing Comptonizing Coronae on a Long BeppoSAX Observation of the Seyfert 1 Galaxy NGC 5548, ApJ, 540, 131-142, 2000
- [61] Pounds, K. A., C. Done, and J. P. Osborne, RE 1034+39: a high-state Seyfert galaxy?, MNRAS, 277, L5-L10, 1995
- [62] Pounds K. A., and S. Vaughan, Evidence for a high accretion rate as the defining parameter of narrow-line Seyfert 1 galaxies, NewAR, 44, 431-433, 2000
- [63] Poutanen J., J. H. Krolik, and F. Ryde, The nature of spectral transitions in accreting black holes – The case of CYG X-1, MNRAS, 292, L21-L25, 1997
- [64] Poutanen J., Accretion Disc-Corona Models and X/gamma-ray Spectra of Accreting Black Holes, in
- [65] Theory of Black Hole Accretion Discs, eds. M. A. Abramowicz, G. Björnsson, J. E. Pringle, pp. 100-120, CUP, Cambridge, 1998, (astro-ph/9805025)
- [66] Poutanen J., and A. C. Fabian, Spectral evolution of magnetic flares and time lags in accreting black hole sources, MNRAS, 306, L31-L37, 1999
- [67] Poutanen J., 2000, Time Lags in Compact Objects: Constraints on the Emission Models, in
- [68] X-ray Astronomy 1999 – Stellar Endpoints, AGN and the Diffuse Background, eds. G. Malaguti, G. Palumbo, N. White, Gordon & Breach, Singapore, in press (astro-ph/0002505)
- [69] Reeves, J. N., P. T. O’Brien, S. Vaughan, D. Law-Green, M. Ward, et al., PDS 456: an extreme accretion rate quasar?, MNRAS, 312, L17-L21, 2000
- [70] Revnivtsev M., M. Gilfanov, and E. Churazov, The frequency resolved spectroscopy of Cyg X-1: fast variability of the Fe K line, A&A Lett., 347, L23-L26, 1999a
- [71] Revnivtsev M., M. Gilfanov, and E. Churazov, Reflection and noise in the low spectral state of GX339-4, A&A Lett, 1999b, submitted, (astro-ph/9910423)
- [72] Reynolds, C. S., On the Lack of X-Ray Iron Line Reverberation in MCG -6-30-15: Implications for the Black Hole Mass and Accretion Disk Structure, ApJ, 533, 811-820, 2000
- [73] Reynolds, C. S., and J. Wilms, On the Inability of Comptonization to Produce the Broad X-Ray Iron Lines Observed in Seyfert Nuclei, ApJ, 533, 821-825, 2000
- [74] Ross, R. R, and A. C. Fabian, The effects of photoionization on X–ray reflection spectra in active galactic nuclei, MNRAS, 261, 74-82 1993
- [75] Różańska A., and B. Czerny, Vertical structure of the accreting two-temperature corona and the transition to an ADAF, A&A, 360, 1170-1186, 2000
- [76] Takizawa, M., T. Dotani, K. Mitsuda, E. Matsuba, M. Ogawa, et al., Spectral and Temporal Variability in the X-Ray Flux of GS 1124-683, Nova MUSCAE 1991, ApJ, 489, 272-283, 1997
- [77] Tanaka, Y., K. Nandra, A. C. Fabian, H. Inoue, C. Otani, et al., Gravitationally Redshifted Emission Implying an Accretion Disk and Massive Black-Hole in the Active Galaxy MCG -6-30-15, Nature, 375, 659-661, 1995
- [78] Ueda, Y., K. Ebisawa, and C. Done, Spectral study of GX 339-4 in the low-intensity state observed with GINGA, PASJ, 46, 107-115, 1994
- [79] van der Klis, M., Rapid aperiodic variability in X-ray binaries, in X–ray Binaries, eds. W. Lewin, J. van Paradijs, and E. van den Heuvel, p. 252-307, CUP, Cambridge, 1995
- [80] Vilhu, O., and J. Nevalainen, Two-Phase Modeling of the Rings in the RXTE Two-Color Diagram of GRS 1915+105, ApJ, 508, L85-L89, 1998
- [81] Weaver, K. A., T. Yaqoob, R. F. Mushotzky, J. Nousek, I. Hayashi, et al., ApJ, 474, 675-685, 1997
- [82] Wilms, J., M. A. Nowak, J. B. Dove, R. P. Fender, and T. di Matteo, Low-Luminosity States of the Black Hole Candidate GX 339-4. I. ASCA and Simultaneous Radio/RXTE Observations, ApJ, 522, 460-475, 1999
- [83] Zdziarski, A. A., J. Poutanen, J. Mikołajewska, M. Gierliński, K. Ebisawa, et al., Broad-band X-ray/gamma-ray spectra and binary parameters of GX 339-4 and their astrophysical implications, MNRAS, 301, 435-450, 1998
- [84] Zdziarski, A. A., X-rays and Soft Gamma-rays from Seyferts, Radio Galaxies, and Black-Hole Binaries, in High Energy Processes in Accreting Black Holes, eds J. Poutanen and R. Svensson, pp. 16-35, ASP Conference Series Vol. 161, 1999
- [85] Zdziarski A. A., P. Lubiński, D. A. Smith, Correlation between Compton reflection and X-ray slope in Seyferts and X-ray binaries, MNRAS, 303, L11-L15, 1999
- [86] Życki P. T., C. Done, and D. A. Smith, Relativistically Smeared X-Ray Reprocessed Components in the GINGA Spectra of GS 2023+338, ApJ, 488, L113-L116, 1997
- [87] Życki P. T., C. Done, and D. A. Smith, Evolution of the Accretion Flow in Nova MUSCAE 1991, ApJ, 496, L25-L28, 1998a
- [88] Życki P. T., C. Done, and D. A. Smith, Geometry of accretion in Soft X-ray Transients in
- [89] Accretion Processes in Astrophysical Systems, eds. S. S. Holt and T. Kallman, pp. 319-323, AIP Conference Proceedings 431., 1998b
- [90] Życki P. T., and A. Różańska, Testing a model of variability of X–ray reprocessing features in Active Galactic Nuclei, MNRAS, 2000, submitted
- [91] Życki P. T., Disk-corona interactions in soft spectral states of black hole binaries, ASpSci, 2000, in press, (astro-ph/0011116)
- [92]