Deep imaging of Q2112+059: A bright host galaxy but no DLA absorber ††thanks: Based on observations made with the Nordic Optical Telescope, operated on the island of La Palma jointly by Denmark, Finland, Iceland, Norway, and Sweden, in the Spanish Observatorio del Roque de los Muchachos of the Instituto de Astrofisica de Canarias. ,††thanks: Based on observations with the NASA/ESA Hubble Space Telescope, obtained from the data Archive at the Space Telescope Science Institute, which is operated by the Association of Universities for Research in Astronomy, Inc. under NASA contract No. NAS5-26555.
Abstract
In a ongoing programme aimed at studying galaxy counterparts of Damped Ly Absorbers (DLAs) we have obtained high resolution deep I-band imaging data of the field around the zem = 0.457 BAL QSO Q2112+059. In the literature this QSO is listed to have a candidate DLA at zabs = 0.2039 along the line of sight. After subtraction of the QSO Point Spread Function (PSF) we detect a galaxy centred on the position of Q2112+059. To help answer whether this galaxy is the DLA or the QSO host galaxy we retrieved a GHRS spectrum of Q2112+059 from the HST-archive. This spectrum shows that there is no Ly absorption line at zabs = 0.2039. This fact in combination with the perfect alignment on the sky of the galaxy and Q2112+059 lead us to the conclusion that the galaxy must be the host galaxy of Q2112+059.
The host galaxy of Q2112+059 is bright (M), and has a radial profile well fitted by a modified Hubble + de Vaucouleurs profile with kpc and kpc. Our results are well in line with the conclusion of earlier work done at lower redshifts, that bright low redshift QSOs preferentially reside in luminous, elliptical galaxies. The host of Q2112+059 is however, despite it’s brightness, very compact when compared to early type galaxies at lower redshifts.
Key Words.:
quasars – absorption lines, quasars – Q2112+059, galaxies – active, galaxies – elliptical, lenticular, cD1 Introduction
We have during the last several years been undertaking programmes aimed at detecting optical counterparts of the most H I rich class of QSO absorption line systems, the Damped Ly absorbers or DLAs for short (Møller and Warren 1993, 1998; Fynbo et al. 1999, 2000a,b). DLAs cause Ly absorption lines with damping wings corresponding to H I column densities larger than . This very large column density absorption occurs in regions of self shielding, cool gas, i.e. where one would expect stars to form. Furthermore, they contain nearly all the neutral gas in the universe (Wolfe et al. 1995). Hence DLAs at high redshift are prime candidates for being the progenitors of present day galaxies.
At redshifts DLAs are both rarer and observationally more difficult to detect since Ly is not shifted above atmospheric cut–off and hence cannot be observed with ground based telescopes (Lanzetta et al. 1995; Jannuzi et al. 1998; Rao & Turnshek 2000). Le Brun et al. (1997) reported candidate galaxy counterparts of 7 such low redshift absorbers that are either confirmed DLAs or strong MgII/FeII absorbers. They found that those candidate galaxy counterparts cover a wide range in morphological types.
The zem = 0.457 BAL QSO Q2112+059 (2000.0 coordinates RA 21 14 52.6, DEC +06 07 41) is radio quiet, and has optical magnitudes B = 15.52 and V = 15.77. Lanzetta et al. (1995) reported the detection of a candidate DLA at zabs = 0.2039 in the IUE spectrum of Q2112+059. In September 1996 we performed an imaging study of Q2112+059 in an attempt to detect the optical counterpart of this DLA. The imaging and data reduction is described in Sect. 2, in Sect. 3 we present spectroscopic data from the Hubble Data Archive and in Sect. 4 and 5 we discuss our results.
For easy comparison to earlier work on this subject, we shall here assume a Hubble constant of 50 km s-1 Mpc-1 and =1.0.
2 Imaging
2.1 Observations and Data Reduction
The observations were performed in 1996 with HiRAC (High Resolution Adaptive Camera) on the 2.56 m Nordic Optical Telescope under photometric and excellent seeing conditions. The CCD used was a 1k1k back-side illuminated thinned Tektronix with a pixel scale of 0.176 arcsec. The data were all obtained in the Bessel I filter. The journal of observations is given in Table 1. A total integration time of 3.25 hours was obtained. Also observed were 7 Landolt sequences (Landolt 1992).
| Date | Seeing FWHM | Number of | Exp. Time |
|---|---|---|---|
| (arcsec) | Frames | (sec) | |
| 1996 Sep15 | 0.6-0.8 | 7 | 2100 |
| 1996 Sep17 | 0.5-0.7 | 10 | 3000 |
| 1996 Sep18 | 0.6-0.8 | 13 | 3900 |
| 1996 Sep20 | 0.5-0.7 | 4 | 1200 |
| 1996 Sep21 | 0.8-0.9 | 5 | 1500 |
The 39 individual frames were bias subtracted, flat-fielded and subsequently coadded using the optimal combination code described in Møller and Warren (1993).
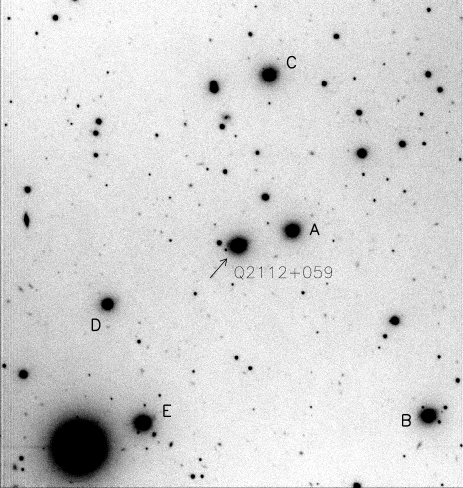
In Fig. 1 we show the final combined image of 9731023 pixels (171180 arcsec2) surrounding Q2112+059 which is marked with an arrow. Using the Landolt sequences we obtained the calibration from the instrumental system to Cousins I. The uncertainty in the zero–point is 0.02 mag. For Q2112+059 we find I = 15.160.02, where the error is dominated by the zero–point error. The sky brightness was (sky) = 19.0 mag arcsec-2 and the sky noise in the final combined image 26.8 mag arcsec-2. The full–width–at–half–maximum (fwhm) of point sources in the combined image is 0.69 arcsec.
There is no indication of variability of Q2112+059 with amplitude above 0.01mag on time-scales from tens of minutes to days.
2.2 PSF quality and stability test

In order to search for faint sources near the line of sight to the bright Q2112+059 a good PSF-subtraction is mandatory. To test the stability of the PSF we selected 5 bright stars distributed over the full field. These stars are marked A–E in Fig. 1. We then determined the radial profiles of the field stars by averaging over the azimuth angle on a 9 by 9 sub–pixel grid. In Fig. 2a we have plotted the radial profiles determined in this way. Also plotted is the radial profile of Q2112+059. All profiles were normalised to the same level in the centre (shown in detail in the inserted logarithmic plot in Fig. 2a). The surface brightness () zero–point in Fig. 2a was chosen to be that of the Q2112+059 profile. It is seen that, i) the 5 bright stars have radial profiles (full drawn lines) that are identical to within the thickness of the lines out to about 2.8 arcsec, and ii) the radial profile of Q2112+059 (short dash) shows excess flux over that of the field stars. To quantify the excess we plot in Fig. 2b the residual surface brightness after subtraction of the weighted mean stellar profile determined from the field stars A – E. At radial distances ranging from 1.4 to 3.6 arcsec from the centroid of the QSO, the excess surface brightness is 0.08–0.14 mag. In the same range the scatter of the stellar PSFs is about a factor 10 – 20 smaller. At radial distances larger than 3.6 arcsec the profiles are dominated by sky noise.
We end this section concluding that the PSF is very stable across the field and that the profile of Q2112+059 has significant excess flux over that of a PSF.
2.3 2D PSF–subtraction

To examine the nature of the excess flux we proceeded with a two dimensional PSF subtraction using DAOPHOT II (Stetson 1987, 1999). For the determination of the 2D PSF we chose to use star A, which is the closest to Q2112+059, but as demonstrated above our results are not dependent on this specific choice of PSF star. When we subtracted the PSF of the QSO using the scaling of the PSF automatically chosen by DAOPHOT II this produced a residual consisting of an extended positive residual surrounding a negative “hole” in which the PSF had been over–subtracted. This is the typical residual one will see when a point source and an extended object are superimposed on roughly the same position (see e.g. Fig. 2b where the PSF subtracted QSO profile is 0 in the centre but 0.13 mag 3 arcsec out). To obtain a image of the underlying extended object without the “hole” from the PSF subtraction, we must impose some additional condition. A reasonable assumption is that the extended object is “flat” across the centroid of the QSO, so we shall use this as the extra constraint to break the degeneracy.
Fig. 3 shows the result of this final two dimensional PSF–subtraction. In the upper left panel is shown 100100 pixels (17.617.6 arcsec2) around Q2112+059. The upper right panel shows the same area after the final subtraction of the PSF. The residual image in the upper right frame shows a fairly large extended object (marked S), presumably a galaxy. The centroid of this object coincides with that of the QSO to within 0.4 pixel (0.07 arcsec). The isophotes of the residual show no clear evidence for ellipticity, rather they are consistent with . There are two additional objects that are both consistent with being point sources 5 and 7 arcsec east of S, and patches of faint extended fuzz both east and west of the object S. In the lower panels of Fig. 3 we show for comparison the field star C (0.35 mag fainter than Q2112+059) before and after PSF–subtraction.
3 Spectroscopy from the HDA
Our original aim with the observations was to detect the optical counterpart of the DLA, but the perfect alignment of the galaxy S with the QSO reported above suggests that we probably have detected the QSO host galaxy rather than the galaxy causing the reported candidate DLA absorption. To help clarify this we searched the Hubble Data Archive (HDA) for spectroscopic data of Q2112+059. In this section we describe the results of this search.
3.1 Retrieval of the spectra and Data Reductions
We found two data sets suitable for this study. Goddard High Resolution Spectrograph (GHRS) spectra over the region from 1330 Å to 1610 Å (grism G140L) was obtained in 1995 (PI Lanzetta) and in 1992 spectra of the region from 1610 Å to 3250 Å was obtained with the Faint Object Spectrograph (FOS) (PI Bahcall). Only the FOS-spectra has been published (Jannuzi et al. 1998).
We retrieved the calibrated GHRS spectrum from the archive. Hence, the data reduction was limited to extracting the 1 dimensional spectrum and 1 error spectra from the calibrated science data files and using the calibrated wavelength solution files.
3.2 Results
Fig. 5 shows the spectrum of Q2112+059 covering the region from 1425 Å to 1505 Å. Also shown is the 1 error per 0.72Å bin (lower curve).

The presence of a damped Ly absorption line in the Ly forest of Q2112+059 at is excluded at the 29 confidence level. The FOS spectrum shows absorption due to gas in the Milky Way and intervening metal line systems at redshifts z=0.370 and z=0.418 as well as metal line systems associated with Q2112+059, but no absorption lines at the redshift z=0.2039 (Jannuzi private communication; Turnshek et al. in prep.).
As discussed by Rao & Turnshek (2000) only 2 of 14 candidate DLA systems from the IUE survey of Lanzetta et al. (1995) have been confirmed. Q2112+059 adds one to the list of non-confirmed candidates.
4 Nature of the host galaxy

As there clearly is no DLA absorber in the sightline towards Q2112+059, and as the centroid of the extended object we have detected is closely aligned with the position of the QSO (to within 0.07 arcsec), we conclude that we have detected the host galaxy of Q2112+059. We now return to a discussion of what can be learned about the nature of this galaxy from our deep imaging.
An attempt to fit a 2D galaxy model to the 2D PSF subtracted image shown in Fig 3 was unsuccessful as the signal–to–noise of the image was too poor to provide meaningful constraints. However, the alignment of the QSO with the centroid of its host, and the fact that there is no evidence in the 2D residual image (Fig. 3) for any elongation of the extended object, suggest that we could significantly lower the number of fitting parameters, and at the same time increase the signal–to–noise of the data to fit, if we returned to the 1D regime. Again, as in the 2D case, we are left with the degenerate problem of deciding how to scale the PSF we subtract from the data. Galaxy cores are known often to have central spikes (see e.g. Møller et al. 1995) which could be due either to central point sources (AGN), to central density cusps or (which is the most likely) to a combination of both (for a discussion see Stiavelli et al. 1993). In the case of Q2112+059 there clearly is a central AGN (the QSO), which is the point source we wish to separate out. Therefore, as in Møller et al. (1995) we break the degeneracy by imposing the condition that the central profile must be isothermal in the sense that the galaxy core is fitted by a modified Hubble profile. This condition closely corresponds to the requirement we used for the 2D PSF subtraction, namely that the residual must be “flat” or “smooth” in the centre. With this assumption we effectively assign the maximum possible flux to the central point–source, and therefore obtain a lower limit to the flux of stellar origin. However, the central density cusps of local early–type galaxies do not contain any significant fraction of the total stellar light (1–10% of the flux measured inside the galaxy core, Møller et al. 1995), so the resulting uncertainty on the flux from the total stellar component is insignificant.
For the 1D PSF we again used the weighted mean of the 5 field stars (all field stars were given weights corresponding to their flux, except star E which was given a lower weight because of the nearby saturated star which caused variable sky across the profile). In Fig. 5a and Fig. 5b we plot the host surface brightness per square arcsec () against R1/4. Superimposed on the data are profiles corresponding to a range of galaxy models. In Fig. 5a we have superimposed six exponential disc profiles
with scale lengths (0.1–0.6 arcsec), and in Fig. 5b the radial profile of a model with an R1/4 outer profile
and a modified Hubble profile
in the core. The models shown were produced on a 2D sub–pixel grid and convolved with the observed 2D PSF. The final 1D model profiles were then determined as azimuthal averages using the same procedure as for the data.
It is seen that the radial profile of the host is noisy in the central 0.5 arcsec where the errors from the PSF subtraction are large and at radii larger than 3.5 arcsec where the uncertainty in the measurement of the sky–level becomes dominant (sky–level errors are shown as short dash curves in Fig. 5). At radii between 0.5 and 3.5 arcsec the profile is very well determined.
Fig. 5a shows that it is not possible to obtain an acceptable fit with an exponential disc profile for any scale length. In contrast, as seen in Fig. 5b, a model with an R1/4 outer profile with an effective radius of arcsec (3.6 kpc) and a modified Hubble profile with a core radius of arcsec (0.5 kpc) in the core provides an excellent fit.
| object | ,rms | Lgal/LQSO | , rms | z | |
|---|---|---|---|---|---|
| kpc | |||||
| Q2112+059 | 3.6 | 0.035 | 23.6 | 0.457 | |
| RG | 14.9 , 5.4 | 25–3000 | 23.65 , 0.50 | 0.174–0.244 | |
| RLQ | 11.2 , 4.5 | 0.17–1.3 | 23.89 , 0.29 | 0.173–0.258 | |
| RQQ | 9.8 , 4.8 | 0.06–5 | 23.27 , 0.52 | 0.115–0.239 |
5 Summary and Discussion
Based on an IUE spectrum of Q2112+059 Lanzetta et al. (1995) reported a candidate damped Ly line at z=0.2039. Subsequent HST spectroscopy (Fig. 4) has not confirmed this. This result is important in its own right as DLAs are very rare at . In the sample of DLAs presented in Wolfe et al. (1995) there are 10 DLAs at z1.0. Of the 10 only 4 are at z0.5, and one of those was the candidate DLA towards Q2112+059.
Having ruled out the presence of an intervening DLA at z = 0.2039, we find that we are forced to interpret the elliptical galaxy we detect under the PSF of Q2112+059 as the host galaxy of the QSO. The host galaxy has an I-band magnitude of 18.8 (total magnitude determined from the model fit), and an effective radius of 3.6 kpc. I=18.8 corresponds to M (no k-correction) in the assumed cosmology (Sect. 1).
McLure et al. (1999) find that both radio galaxies (RGs), radio loud QSOs (RLQs) and bright radio quiet QSOs (RQQs) preferentially are hosted by massive, bright elliptical galaxies. Our detection of a bright elliptical galaxy hosting the radio quiet Q2112+059 is consistent with this result. In Table 2 we compare our results to those of McLure et al. (1999) and find that the host galaxy of Q2112+059 is in the bright end of the absolute magnitude distribution, but has a smaller effective radius than any RQQ host galaxy in their sample.
Schneider et al. (1983) studied the brightest cluster galaxies in 83 Abell clusters (with redshifts in the same range as the McLure et al. samples). They found a tight correlation between the core radii and effective radii. The host galaxy of Q2112+059 falls nicely on this correlation, but is smaller than any of the brightest cluster galaxies of the Schneider et al. sample.
Compared to the work on local early type galaxies by Kormendy (1977), the effective radius of the host galaxy of Q2112+059 falls in the overlapping region between “compact” and “normal” early type galaxies.
Finally, since the host galaxy we have detected is a spheroid we can estimate the mass of the black hole using the correlations derived by Magorrian et al. (1998) assuming that the correlation found at z=0 is also valid at z=0.457. We derive a black hole mass of about 9109 M☉.
Acknowledgments
We thank B. Januzzi for providing us with results on metal absorption lines in the FOS spectrum of Q2112+0519 prior to their publication. We are grateful to our referee Dr. Villar–Martin for suggestions and comments which helped clarifying our manuscript on several important points and significantly improved the presentation of our results.
References
- (1) Bertin E, Arnouts S, 1996, A&AS 117, 393B
- (2) Fynbo J.U, Møller P., Warren S.J., 1999, MNRAS 305, 849
- (3) Fynbo J.U, Møller P., Thomsen B., 2000, In: ‘Astrophysics Research and Science Education’, edt. C. Impey, (Notre Dame Press), p. 237
- (4) Fynbo J.U, Thomsen B., Møller P., 2000, A&A 353, 457
- (5) Jannuzi B.T., Bahcall J.N., Bergeron J., et al., 1998, ApJS 118,1
- (6) Kormendy J., 1977, ApJ 218, 333
- (7) Landolt A.U., 1992, AJ 104, 340
- (8) Lanzetta K., Wolfe A.M. and Turnshek D.A., 1995, ApJ 440, 435
- (9) Le Brun V., Bergeron J., Boissé P., Deharveng J.M., 1997, A&A 321, 733
- (10) Magorrian J., Tremaine S., Richstone D., et al., 1998, AJ 115, 2285
- (11) McLure R.J., KuKula M.J., Dunlop J.S., et al., 1999, MNRAS 308, 377
- (12) Møller P., Stiavelli, M., Zeilinger, W. W., 1995, MNRAS 276, 979
- (13) Møller P., Warren S., 1993, A&A 270, 43
- (14) Møller P., Warren S., 1998, MNRAS 299, 661
- (15) Rao S.M., Turnshek D.A., ApJ in press (astro-ph/9909164)
- (16) Schneider D.P., Gunn J.E., Hoessel J.G., 1983, ApJ 268, 476
- (17) Stetson P., 1987, PASP 99, 191
- (18) Stetson P., 1999, ”User’s Manual for DAOPHOT II”
- (19) Stiavelli, M., Møller, P., Zeilinger, W. W., 1993, A&A 277, 421
- (20) Wolfe A.M., Lanzetta K.M., Foltz C.B., Chaffee F.H., 1995, ApJ 454, 698