BeppoSAX observation of the rich cluster of galaxies Abell 85
Abstract
We report the observation of the Intra-Cluster Medium (ICM) of Abell 85 by the X-ray satellite BeppoSAX. We have both analysed the spectrum obtained in the central 8 arcmin circular region centred on the Very Steep Spectrum Radio Source (VSSRS) and the spectra from a number of sub-regions. Analysis of the spectra allowed us to independently obtain new estimates of the temperature, metallicity and line-of-sight hydrogen density column, both globally ( keV, and cm-2) and locally. These measures are in good agreement with previous measures based on ROSAT and ASCA data. In the region of the VSRSS, we have tried to disentangle the thermal from the non-thermal X-ray emission. Although we could not do this unambiguously, we have nonetheless estimated the extended magnetic field using the radio spectrum available for this region. We obtain a lower limit intensity of G, consistent with our previous estimate. We also derive -elements/iron abundance ratios that turn out to be higher than 1. Such a result tends to support the burst model for elliptical galaxies, where a strong galactic wind develops early in the galaxy history and type II supernovae (SN) may have the main role in the enrichment of the ICM. A two-temperature ICM model was fitted in the central region yielding a main component with roughly the mean cluster temperature and a cooler component with temperature less than 0.1 keV.
Key Words.:
galaxies: clusters: Abell 85 – clusters: magnetic fields – clusters: X-rays – clusters: radio emission – clusters: abundances1 Introduction
The hot (K) and tenuous (central density, cm-3) X-ray emitting gas found in rich clusters of galaxies is an excellent tool to probe the cluster dynamics, morphology, and history. The intra-cluster gas accounts for 10–15% of the total cluster mass and thanks to its short relaxation time scale, it can track the cluster global gravitational potential. The main emission mechanism of the gas is the thermal bremsstrahlung that is proportional to ( is the numerical density of electrons). Besides density and temperature, the observed thermal bremsstrahlung emission may give estimations of the gas metallicity and of the line-of-sight column density of hydrogen. The abundance of metals in the intracluster gas is a sign of early enrichment by material processed in stars. The determination of precise abundances of iron and -elements (nuclei formed by the fusion of -particles in massive stars) can provide strong constraints for the early evolution of galaxies and the galaxy-cluster medium interaction.
In the last couple of years, the cluster Abell 85 (richness class 1, cD type, optical redshift 0.056) has been extensively studied (cf. Pislar et al. 1997; Lima Neto et al. 1997; Bagchi et al. 1998). Using data from the ROSAT satellite detectors PSPC (imagery and spectroscopy) and HRI (high resolution imagery), it was possible to draw substantial new conclusions about this cluster. Through the use of wavelet techniques, Lima Neto et al. (1997) were able to detect a central excess in the X-ray emission which has been identified with a cooling-flow of about 50–150 Myr (based on a multi-phase model of the gas). Moreover, they have confirmed the presence of 3 small X-ray features around the centre (cf. Prestwich et al. 1995) which may be a sign of inhomogeneities in the central cooling-flow. The second most important X-ray feature in Abell 85 is a blob to the south of the main structure (called the ‘South Blob’ hereafter). This blob is definitely a sub-structure in the X-ray map and coincides with a small group of galaxies (the second brightest cluster member is there). However, these galaxies do not seem to form a gravitationally bound group and may be part of a chain of galaxies extending to the neighbouring cluster Abell 87 (Durret et al. 1998). The radio maps of the South Blob also show intense, very steep spectrum radio emission at meter wavelengths (the VLA map, see below and also Joshi et al. 1986; Bagchi et al. 1998). Most of this emission is diffuse in nature and extends over 4 arcmin (kpc) but not associated with any particular galaxy. This, and another similar diffuse radio source Mpc to north-west (VSSRS 0038-096) are the principal unexplained radio features in Abell 85.
The radio observations of diffuse synchrotron radiation strongly suggest the presence of large scale magnetic field, , and relativistic electrons in clusters of galaxies. These electrons interact not only with magnetic fields but also with the 3K cosmic microwave background radiation (CMB). The scatter of the electrons and the CMB through inverse Compton effect (IC/3K) will produce X-ray photons (e.g. Feenberg & Primakoff 1948; Rephaeli & Gruber 1988). The best place to look for a co-spatial IC/3K and synchrotron radiation is on a very steep spectrum radio source (VSSRS). These sources, possibly the remnants of former radio galaxies but presently not identifiable with galaxies, are commonly known as cluster ‘radio-relics’ and ‘radio-haloes’ (cf. Feretti & Giovannini 1996 and Kronberg 1994 for reviews). They owe their steep radio spectra to radiative energy losses but are prevented from rapid fading, due to expansion, by the thermal pressure of the surrounding intra-cluster gas (Baldwin & Scott 1973). These VSSRS are also possibly the tracers of large scale shock waves that form at the intersection of filaments and sheets of galaxies due to gravity driven supersonic flows of extragalactic matter (Enßlin et al. 1998; Miniati et al. 2000; Bagchi et al. 2000).
We have studied the X-ray excess at the location of the extended VSSRS 0038-096 in the western part of Abell 85 using ROSAT PSPC data and the low frequency radio data (Bagchi et al. 1998). Even though ROSAT has a limited spectroscopic range [0.5–2.4] keV, we were able to derive a value for the magnetic field, G. We based our estimate on the assumption that the co-spatial radio and X-ray emission are nonthermal synchrotron and IC/3K radiation, respectively, from a common population of relativistic charges.
In this paper, we present new results based on observation of Abell 85 by the X-ray satellite BeppoSAX. We use the spatially resolved spectroscopy capabilities of the MECS and LECS detectors to determinate independently the temperature, metallicity and line-of-sight hydrogen density column. Furthermore, we try to separate the thermal from the non-thermal X-ray emission in the regions of the VSSRS and the South Blob, and we give lower limit estimates of the extended magnetic field. In the central region, we determine the properties of the cooling-flow, showing that the X-ray emission in that region is compatible with a metal rich, 2-temperature plasma. Moreover, when the signal to noise ratio is high enough we estimate the individual abundances of iron, nickel and -elements. Unless otherwise stated, we assume km s-1Mpc-1 and (i.e., 1 arcmin corresponds to kpc).
2 The data
Abell 85 was observed in July 1998 by the BeppoSAX satellite (Boella et al. 1997a) with two of the narrow field instruments: the low-energy concentrator spectrometer (LECS, sensitive in the [0.1–10.0] keV range; Parmar et al. 1997) and two units of the medium-energy concentrator spectrometer (MECS 2 and 3, sensitive in the [1.3–10.5] keV range; Boella et al. 1997b).
The observation was not pointed at the centre of the cluster, at the position of the central cD galaxy, but at the position of the VSSRS 0038-096. The net exposure times were and s for the MECS and LECS, respectively.
2.1 Data reduction
The data have been pre-processed (linearized and cleaned) using the SAXDAS Rev. 1.1 package in the FTOOLS 3.5 environment at the BeppoSAX Science Data Centre (SDC) and then retrieved through their archive.
We have used the merged data from both MECS units; they were merged using the SAXDAS “meevelin” program by the SDC (see Fiore et al. 1999).
In order to avoid severe vignetting effects, we have extracted data for scientific analysis only inside a circle of 8 arcmin around the pointing axis of the LECS and MECS instruments (Cusumano & Mineo 1998).
The background spectra have been extracted from sky fields devoid of detectable sources and using the same regions on the detectors as the ones used for extracting spectra of Abell 85 (see below the definition of these regions).
2.2 Data Analysis
The total field of view of the MECS units is , but they are supported by a beryllium support that blocks photons with keV; this effect is not taken into account in the effective area files (Fiore, private communication). Therefore, we restricted our analysis to the area inside the support, i.e., up to 8 arcmin from the detector axis.
Both instruments, LECS and MECS, have moderate spatial resolution, at 0.28 keV and at 6.4 keV (FWHM) respectively (Fiore et al. 1999). Hence, we have defined sub-regions in the field of view in order to perform separate spectral analysis. The X-ray data in these regions were extracted with XSELECT 1.4. Table 1 resumes the characteristics of the regions we have used.
Figure 1 shows the regions we have selected superposed on the X-ray map derived from the MECS23 data. This figure also shows the 90 cm radio continuum VLA and ROSAT PSPC maps (isocontour lines). For the radio data, we have used the VLA C-configuration, archival interferometric data (programme ID AR279). The data was obtained in July 1993 with total of 30 minutes of integration on Abell 85 at the frequency of 333 MHz and bandwidth of 3.1 MHz. For reduction, the NRAO ‘AIPS’ software was employed. Following the usual procedure of editing and amplitude and phase calibration, the calibrated data was Fourier transformed and the degree image was deconvoluted with ‘CLEAN’ algorithm. The final image was convoluted with a circular restoring beam of 60 arcsec (FWHM) gaussian profile. Noteworthy are the strong radio emission from the region of VSSRS, the South Blob and the cD galaxy at the cluster centre. The PSPC X-ray map is fully described elsewhere (Pislar et al. 1997).
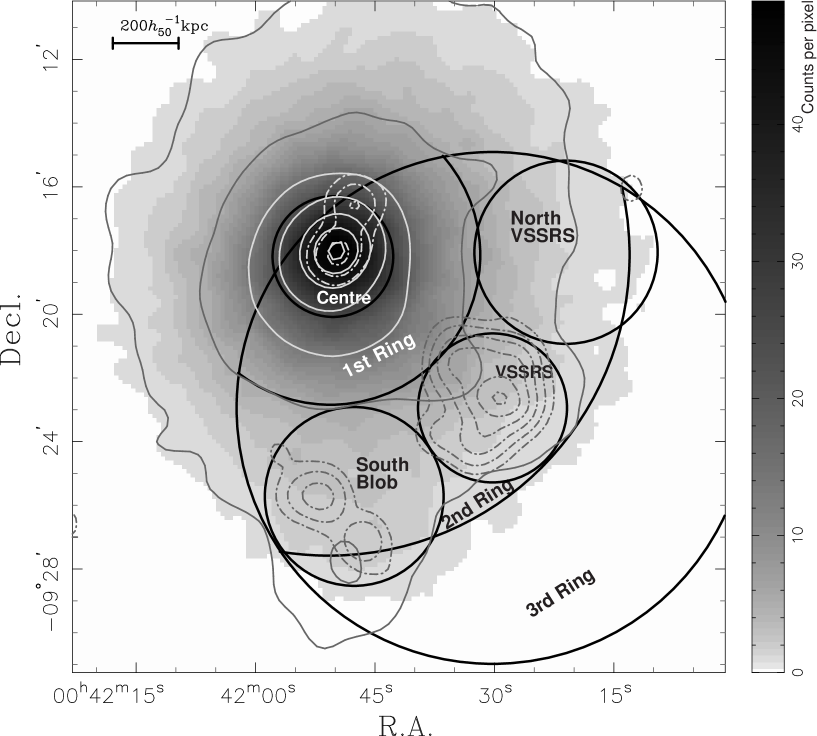
| Name | Count rate | Flux∗ | Localisation | |
|---|---|---|---|---|
| (counts/s) | [2.0–10.0] keV | [2.0–10.0] keV | ||
| Centre | Circle at , , radius . | |||
| South Blob | Circle at , , radius . | |||
| VSSRS | Circle at , , radius . | |||
| North VSSRS | Circle at , , radius . | |||
| 1st Ring | Ring between and , centred at , . The region outside from the MECS axis is excluded. | |||
| 2nd Ring | Ring between and , centred at , . The region outside from the MECS axis is excluded. | |||
| 3rd Ring | Region outside the circle centred at , and radius , excluding the region outside from the MECS axis. | |||
| All Field | Circle at , radius . |
∗ Flux is in units of erg s-1 cm-2
† Luminosity is in units of erg s-1
We have extracted the spectra for each region and used simultaneously both the LECS and MECS (units 2 and 3) data. Following the “Cookbook” (Fiore et al. 1999), we have used only the data in the interval [0.12–4.0] keV for the LECS and [1.65–10.5] keV for the MECS.
For each region we have used a single temperature plasma, the absorbed Raymond-Smith (Raymond & Smith 1977) and the MEKAL (Kaastra & Mewe 1993; Liedahl et al. 1995) models. For some regions (centre, South Blob and VSSRS) we have also modelled the intracluster medium with a combination of two models: either two MEKAL or a MEKAL plus a power-law, this to take into account the non-thermal emission. The absorption is due to the cold gas in the line-of-sight, mainly hydrogen and helium. We have used the photoelectric absorption cross-sections given by Balucinska-Church & McCammon (1992).
When the counts were high enough, we also have tried the VMEKAL model, that is, with a variable individual abundances rates for the elements that contributed for the X-ray flux at the [0.1–10.0] keV band. Unfortunately, most of the metals do not produce strong enough lines for unambiguous detection with BeppoSAX. Therefore we have fixed the abundance values of He, C, N, O, Ne, Na, Mg, and Al to 0.3.
The spectral fits were done using XSPEC v10.0. The BeppoSAX narrow field instruments have channels of equal energy width, but a spectral resolution that scales roughly with the square root of the energy (Boella 1997a). Therefore, if a spectrum must be rebinned (in order to increase the counts per bin), one should first group the bins taking into account the energy resolution non-linearity rather than simply grouping the channels with some ad hoc prescription. We have used the appropriate rebinning template files made available by the SDC (Fiore et al. 1999).
However, even with the energy-dependent rebinning, there are still bins with low counts. We have then used the recipe given by Churazov et al. (1996) based of the smoothed rebinned spectrum (available in XSPEC) for computing the statistical weights. With this procedure, one can still use least-square minimisation fit and statistics for unbiased parameter and error estimation.
3 Results
| Region | Model | /dof | |||||||||
|---|---|---|---|---|---|---|---|---|---|---|---|
| (cm-2) | (keV) | ||||||||||
| all field | mekal | — | — | — | — | — | — | 205.1/178 | |||
| all field | vmekal | 202.7/173 | |||||||||
| Centre | mekal | 198.9/161 | |||||||||
| Centre | vmekal | 192.2/156 | |||||||||
| 1st Ring | mekal | — | — | — | — | — | — | 214.4/178 | |||
| 1st Ring | vmekal | 212.72/175 | |||||||||
| 2nd Ring | mekal | — | — | — | — | — | — | 120.4/142 | |||
| 2nd Ring | vmekal | 118.90/138 | |||||||||
| 3rd Ring | mekal | — | — | — | — | — | — | 79.6/72 | |||
| S. Blob | mekal | — | — | — | — | — | — | 127.7/108 | |||
| S. Blob | vmekal | 126.03/104 | |||||||||
| VSSRS | mekal | — | — | — | — | — | — | 104.8/108 | |||
| N. VSSRS | mekal | — | — | — | — | — | — | 117.8/108 |
∗ error
† Value fixed.
3.1 All field
Within the unobstructed field-of-view of a circle of 8 arcmin centred at the MECS axis we have our greatest signal to noise ratio and in this region we can obtain some well constrained mean quantities for Abell 85. Using a MEKAL model, we find a temperature of keV, an hydrogen column density cm-2 and a metallicity of (cf. Table 2). We obtain a significantly higher temperature than that obtained with the ROSAT PSPC ( keV, Pislar et al. 1997), but essentially the same as the one obtained with ASCA ( keV, but notice that this is the mean temperature within arcmin; Markevich et al. 1998). The column density is higher than the Galactic value deduced from HI data in the field of view (for example cm-2 at the position of the VSSRS and cm-2 at the position of the cD, Dickey & Lockman 1990). This suggests that there is an amount of HI contained within the cluster itself.
The metallicity is well constrained and has the value generally found in this type of clusters (e.g. Fukazawa et al. 1998). We have further fitted the data with a VMEKAL model to obtain abundances of the individual metal elements. The reduced ( divided by the number of degrees of freedom) is slightly higher for the VMEKAL compared to the MEKAL model, but the temperature and hydrogen column density are the same and we detect the presence of some metals (cf. Table 2). Only the abundances of Ni and Fe are not compatible with zero at 1 level and, except for these two elements, we can only give upper limits for the abundance.
The total X-ray luminosity in the [0.1–2.4] keV band is erg s-1 inside a radius of kpc (8 arcmin) centred at the VSSRS position.
3.2 Centre
We take a region of 1.9 arcmin ( kpc) at the position of the cD galaxy located at the cluster centre. A fit with a single temperature model shows a significant increase of the hydrogen column density and a decrease of temperature relative to the values obtained when we fitted the whole cluster. In a previous study, Pislar et al. (1997) observed a negative correlation between the X-ray gas temperature and . Here, we observe a much weaker correlation (Fig. 2), so the effect – temperature decrease inwards the centre – is probably real and is not an artefact of the fit. The metallicity is significantly higher in the central region than in the whole field. The ROSAT data gave the same results (Pislar et al. 1997). We detect the presence of Si, S, Ar, Ca and Fe when we fit the data with a VMEKAL model. These results can be interpreted as due to the accumulation of neutral hydrogen in the vicinity of cD galaxy, due to the presence of cooling flow with star formation.

However, a single temperature plasma model is unable to provide a good fit for the spectrum of the central region of Abell 85 when the photon energy is less than 0.4 keV: as is shown in figure 3(A), there is a clear excess of soft X-ray photons.
Indeed, previous studies of Abell 85 have suggested that this cluster houses a strong central cooling flow (e.g. Stewart et al. 1984; Edge et al. 1992; Prestwich et al. 1995; Pislar et al. 1997; Lima Neto et al. 1997). Estimated values range from about 50 to 200 /yr inside a cooling radius of –kpc. We can thus interpret the soft X-ray excess component as evidence for the presence of cool gas. Therefore we have fitted the central region spectrum with a 2-temperature gas model.


When we fix 2 or 3 parameters of the first thermal component, using the “all field” mean values, the fits are not significantly improved (cf. Table 3). But when we let all the parameters free to vary, the fit is significantly improved (the reduced is 1.13 instead of 1.23). Figure 3(B) shows the best 2-temperature gas model fit. The parameters of the first component are roughly the same as that obtained in a single component fit, but the temperature of the second component is found to be very small (less than 0.1 keV at level). Thus, we recover the previous results based on the PSPC data reported in Lima Neto et al. (1997), in particular their 2-temperature fit of the central region, with the cooler component at keV (see Table 2 in their paper).
Since the central cD galaxy is also a radio source (as can be seen in Fig. 1) we have tried a fit with a thermal component and a power law, in order to model an eventual non-thermal X-ray source (e.g. an Inverse Compton scattering of relativistic electrons with the microwave background photons). However, the inclusion of a power-law component does not improve the fit and we cannot detect such an emission.
| Region | Models | Flux1 | Flux2 | dof | ||||||
|---|---|---|---|---|---|---|---|---|---|---|
| (cm-2) | (keV) | () | (keV) | () | [2–10] keV | [2–10] keV | ||||
| Centre | mekal+mekal | — | 228.41/162 | |||||||
| Centre | mekal+mekal | — | 198.98/160 | |||||||
| Centre | mekal+mekal | — | 178.70/158 | |||||||
| Centre | mekal+pow | — | — | 198.93/160 | ||||||
| S. Blob | mekal+pow | — | — | 127.05/106 | ||||||
| VSSRS | mekal+pow | — | — | 104.37/107 | ||||||
| VSSRS | mekal+pow | — | — | 104.04/106 | ||||||
| Break | Flux1 | Flux2 | dof | |||||||
| (cm-2) | (keV) | () | (keV) | [2–10] keV | [2–10] keV | |||||
| VSSRS | mekal+2pow | 1.0† | 1.85† | 103.71/106 | ||||||
| VSSRS | mekal+2pow | 0.4† | 1.85† | 0.18 | 101.22/106 |
∗ error
† Value fixed
3.3 South Blob
The South Blob region is a circle of 3.2 arcmin centred at the coordinates indicated in Table 1. We have fitted this region with both MEKAL and VMEKAL single temperature models (Table 2) and a MEKAL plasma superposed to a power-law emission (Table 3). The later was motivated by the presence of an extended radio emission seen on the 90cm VLA map (Fig. 1) and on the 326.5 MHz OSRT map (Fig. 1 in Bagchi et al. 1998). Such an extended radio emission reveals the presence of relativistic electrons that will interact with the microwave background photons and produce an Inverse Compton X-ray emission, depending on the (a priori unknown) Lorentz factor and energy distribution of these electrons.
With both single temperature models, the hydrogen column density is higher than in previous fits (Pislar et al. 1997) and marginally compatible with the Galactic value (cm-2, Dickey & Lockman 1990). The hydrogen column density is even higher, however, when we use a MEKAL plus power-law model (although still compatible within their error bars). The temperature is higher than in the centre, being actually above the cluster mean temperature. With the MEKAL plus power-law model, the obtained temperature is even higher (but with larger error bars). Notice that, comparing the reduced , an addition of a power-law component does not improve the fit.
The metallicity obtained in the South Blob is significantly lower than the mean value obtained for the whole cluster and is about half the value found in the centre of the cluster. This lower metallicity is also obtained with the iron abundance in the VMEKAL model. Besides the iron, only Ca was detected with an abundance above zero (but with a very large upper limit).
3.4 VSSRS
This is the region where a diffuse, very steep spectrum radio source (MRC 0038-096; see Bagchi et al. 1998) is observed.
Here, fitting a single plasma component, we obtain the same temperature and metallicity as in the whole field (cf. Table 2), even though the error bars are significantly larger due to the smaller count rate. The hydrogen column density is the same as the Galactic value.
In both the HRI and PSPC images it is possible to notice an X-ray excess in this region, spatially correlated with the diffuse VSSRS (Lima Neto et al. 1997). This X-ray excess, interpreted as IC/3K emission, was estimated by Bagchi et al. (1998), by subtracting the total X-ray emission by the thermal contribution. The latter was computed using a detailed plasma model for Abell 85 (see Pislar et al. 1997).

Ideally, one would like to disentangle directly and unambiguously, the IC/3K from the thermal X-ray emission. In principle, this could be done by fitting a composite model to the X-ray spectrum. Thus, we have fitted the X-ray spectrum in the VSSRS region with the sum of a MEKAL plus a power-law model, the latter representing the IC/3K emission. The results are summarized in Table 3. We have obtained, for the IC/3K emission, a spectral index of 0.4 but the reduced for the composite model is not statistically better than the one of a single MEKAL model. In Fig. 4 we show the best fit model for the VSSRS. Extrapolating the model to higher energies, the IC/3K mechanism starts to dominate the total X-ray flux beyond keV (a well know result), outside the range of the MECS detector.
The difficulty found in disentangling the thermal from the non-thermal X-ray emission is due to two main factors: (I) the IC/3K emission is relatively weak compared to the thermal one and (II) the bremsstrahlung emission is well approximated by a power-law in the energy interval observed by BeppoSAX.
We have also tried a fit with a fixed value for the spectral index equal to 1, i.e., the same spectral index of the VSSRS between 10 and 100 MHz (see Fig. 3 of Bagchi et al. 1998). Again, the fit is not significantly improved but the flux of the IC/3K is not negligible. Notice, however, that the best fit spectral index of 0.4 is consistent with the radio spectrum in the interval [10–40] MHz, where the spectrum seems to flatten.
Furthermore, we have modelled the IC/3K emission as a broken power-law, characterized by two power-law slopes and a breaking point. We could not obtain a robust fit letting the two slopes being free parameters. Therefore, we fixed the steeper slope, , equal to the observed slope of the radio spectrum in the range [100–400] MHz, i.e., (Bagchi et al. 1998) and fixed the shallower slope () either to 1.0 (from the radio spectrum) or to 0.4, our best fit with a single power-law (cf. Table 3).
In the first case, with , the fit is only slightly better than those with a single power-law and the derived IC/3K flux is much smaller than the thermal flux. Unfortunately, we cannot obtain a meaningful value for the breaking point. In the second case, the fit is still better and the breaking point is well determined at 7.4 keV. However, the derived fluxes for the thermal and the broken power-law components are almost the same, indicating the confusion in separating the thermal from the non-thermal emission.
Sarazin (1999) has computed the Inverse Compton spectra for a number of models with different relativistic electron population. For the models with steady particle injection, the IC emission spectra in the combined MECS and LECS range would be well represented by a single power-law with slope , where is the logarithm slope of the relativistic electron distribution (cf. Fig. 12 of Sarazin 1999).
For the models with no injection of electrons but with an initial population, the IC emission could only be detectable if the initial population were injected in the cluster at redshift lower than 0.1 (cf. Fig. 13 of Sarazin 1999). In this case, a broken power-law is needed to reproduce the IC emission with and (actually the emission has an exponential cut-off and these slopes are only valid in the range [0.1–10.0] keV).
3.5 Other Regions
We have made fits in the regions we called 1st, 2nd, 3rd Rings and N. VSSRS. In the 3rd ring and N. VSSRS regions, the error bars are quite large due to the small number of counts and it is difficult to deduce strong results.
The hydrogen column density and metallicity decrease from the centre to the 2nd ring, while the temperatures of the 1st and 2nd rings are quite larger than in the centre.
4 Discussion
4.1 Estimation of Magnetic Fields
In section 3, we have attempted to separate the thermal and non-thermal X-ray emission components at the VSSRS and at the South Blob regions, where radio observations have detected diffuse synchrotron radiation, showing the presence of magnetic fields and relativistic electrons. Here, we estimate the volume averaged field in these zones, using the non-thermal fluxes (cf. Table 3). We wish to inject a cautionary note at this stage: in this section the values are expressed as actual estimates, where we have used the nominal results given in Table 3. However, given the non-thermal X-ray fluxes errors bars, these fluxes should be regarded as upper limits. Therefore all our estimates of the field intensities should be ideally treated as only lower limits.
4.1.1 The VSSRS region
In the first case (MEKAL+POW), when the spectral indices of non-thermal X-ray and radio photons are both fixed at , the IC/3K flux () is estimated to be erg s-1cm-2 in 2–10 keV range and the radio flux () to be erg s-1cm-2 in 10–100 MHz range. This leads to a field value of G.
In the second case, when we have allowed the spectral index to vary, we have obtained the value of , with large error bars (Table 3). This value of spectral index seems roughly consistent with radio spectral shape in the range 10–45 MHz (Bagchi, Pislar & Lima Neto 1998). In this case we have erg s-1cm-2 and erg s-1cm-2. From these, we then obtain G.
Finally, we consider the more complex model where the non-thermal spectrum is represented by two power-law forms with a ‘spectral break’ in-between (MEKAL+2POW). When the low and the high frequency spectral segments are fixed a priori, with spectral indices and , we once more obtain the magnetic field as G (but note that the ‘break’ value for X-ray photons is not obtained).
However, when is fixed at 0.4 and is fixed at 1.85, we obtain a well constrained value (7.4 keV) for the ‘break’ in IC/3K spectrum (Table 3). It is possible to relate this break to a similar break in the radio spectrum since both come from a common electron energy spectrum. The frequencies of IC/3K photons () and of synchrotron photons () are related by:
The decametric radio spectrum for the VSSRS shown in Figure 3 of Bagchi et al. (1998) does show a sudden flattening or ‘break’ in the spectrum at –40 MHz. Assuming Hz (or 7.4 keV) and Hz, we have another magnetic field estimate for the VSSRS from the last equation. This is obtained as G.
Putting together the above results obtained, using the above mean values and standard deviations, results in G. As per the caveat above, this really is the lower limit to the magnetic field value and should be treated as such. Our new estimate using the BeppoSAX data is consistent with our earlier estimate (G) using ROSAT data (Bagchi et al. 1998).
4.1.2 The ‘South Blob’ region
Currently, due to insufficient radio data, the spectral index value for the emission from the South Blob is not available. However, the radio data from Ooty Synthesis Telescope at 327 MHz detects the total 450 mJy diffuse radio flux from this zone (Bagchi et al. 1998). In section 2, by model fitting, we have obtained an estimate of erg s-1cm-2 for the IC/3K flux and for the spectral index. Assuming this value for the spectral index over the entire radio range (10 MHz to 10 GHz), we can then easily calculate the lower limit value for magnetic field in this region, which is G.
4.2 Cluster merging at the South Blob
The temperature detected in the South Blob is higher than in the other regions of Abell 85. This result is similar to the one found by Markevitch et al. (1998) (cf. their Fig. 2) using ASCA data. They interpret the higher temperature in the region of the South Blob with the model proposed by Durret et al. (1998), that is, of a substructure falling in the main body of Abell 85. The higher temperature in this region, compared with either a region symmetrically opposed towards the north of Abell 85 or a region farther to the south, may be explained by a shock that heats the ICM. Although, with BeppoSAX, we cannot measure temperatures southern from the South Blob or much northern from the centre, the higher temperature that we do detect at the South Blob and the 2nd Ring tends to confirm this picture of merging substructure.
We have also detected, with a level, an excess on neutral hydrogen compared to the galactic value (from Dickey & Lockman 1990). This excess, about 1.5 times the galactic value, also supports the scenario where gas is pouring in this region. Notice, that the measured over the entire 2nd Ring (which contains most of the South Blob) is substantially closer to the galactic value, suggesting that the localised excess at the South Blob region is real.
Interestingly, the South Blob presents a significantly lower abundance of metals compared to the other regions of Abell 85 and to its mean value. The 2nd ring, which contains the South Blob, has also the same low metal abundance. If we admit the scenario of Durret et al. (1998), where a filament of very low surface brightness is falling into Abell 85, along the axis coming from Abell 87 and, moreover, Abell 87 is in fact composed by poor sub-clusters, then one can suppose that the gas in the filament falling into Abell 85 has a rather low metallicity. This could explain the low abundance determined at the South Blob as the mixture of the ICM from Abell 85 with a lower metal rich gas falling along the filament.
If the South Blob is indeed a place where a substructure is merging with the main body of Abell 85, then we may have a strong shock in this region. Such a shock is bound to accelerate the ICM electrons to relativistic energies and also may amplify stochastically the pre-existing magnetic fields (Enßlin et al. 1998; Sarazin 1999). These would in turn produce X-ray emission by IC/3K scattering and the radio synchrotron radiation. Our best fit with a power-law emission superposed to a thermal MEKAL model has virtually the same reduced as the single thermal model fit. In this fit, the non-thermal flux is only about 5% of the total flux and the power-law slope is (). This corresponds to the slope of the relativistic electron energy spectrum of .
4.3 Metallicity
The overall abundance detected with BeppoSAX is very close to the one found by Pislar et al. (1997) and it is the usual value found in clusters with the same temperature of Abell 85. The total abundance determined with the MEKAL model is quite well constrained, mainly by the prominent Fe K complex at keV. The mean value obtained for the whole cluster is with a error of 0.06.
The individual iron abundance is also well constrained using the VMEKAL model, and we systematically obtain a lower value for the Fe abundance compared to the mean abundance of all metals. The mean value for the whole field is with a error of 0.05. Notice that the Fe abundance and the mean metal abundance are only marginally compatible with the error bar – these abundances are different at level.
The above result is consistent with the fact that the individual abundances of other metals (except perhaps for Ni) obtained with the VMEKAL model are usually higher than the iron abundance (cf. Table 4). In other words, the abundance ratio of -elements (Si, S, Ar and Ca) to iron is greater than one (in solar units). However, the Ni/Fe abundance ratio is systematically lower than the -elements/Fe. This result must be taken very cautiously, given the large error bars of the -elements, and is most significant for the fits of all field and the centre region.
| Si | S | Ar | Ca | Ni | |
|---|---|---|---|---|---|
| all field | 2.0 | 0.7 | 1.0 | 2.0 | 0.3 |
| [1.0–3.0] | [0.0–1.7] | [0.0–3.0] | [0.0–4.0] | [0.0–1.7] | |
| Centre | 1.8 | 1.5 | 2.5 | 6.0 | 1.0 |
| [0.8–2.8] | [0.5–2.8] | [0.5–4.8] | [4.0–8.2] | [0.0–2.5] | |
| 1st Ring | 2.1 | — | 3.6 | — | 0.4 |
| [0.7–3.6] | — | [0.4–6.8] | — | [0.0–2.5] | |
| 2nd Ring | 4.7 | 2.9 | — | 3.5 | 4.7 |
| [1.1–8.2] | [0.0–6.5] | — | [0.0–11.1] | [0.0–10.0] |
The results presented in Table 4 are somewhat in disagreement with those found by Mushotzky et al. (1996) (see also Loewenstein and Mushotzky 1996) using ASCA-SIS data for four rich clusters of galaxies (A496, A1060, A2199 and AWM7). Although we also find an overabundance of Si, our abundance rates for S, Ar and Ca relative to iron are higher than theirs. The relative abundance of Si to Fe found here in Abell 85 is in remarkable agreement with the results of Fukazawa et al. (1998), also based on ASCA data but for 40 clusters. Our results, Si/Fe and keV, fall squarely on the correlation between the Si/Fe abundance and cluster temperature (cf. their Fig. 3).
Our results tend to support the burst model for elliptical galaxies, where a strong galactic wind develops early in the galaxy history (Martinelli et al. 1999). These authors argue that, for the burst model, there should be an overabundance of -elements compared to iron whereas for the continuous model, the abundance ratio is smaller than one at . The bi-modal model proposed by Elbaz et al. (1995) also predicts a higher abundance of Si compared to Fe. Following their conclusion, our results suggest that type II SN have the main role in the enrichment of the ICM. Fukazawa et al. (1998) also suggest that, if the Si/Fe relative abundance is indeed correlated with the cluster temperature, then the role of type II SN should be more important for hotter clusters.
Based on upper limits on the red spectral line of [Ca ii], Donahue & Voit (1993) suggest that Ca is likely depleted onto dust grains in cluster cooling flows. The higher abundance of calcium derived by us may be the result of dust evaporation in the hot ICM – the calcium we observe in X-rays is completely ionized.
4.4 Cooling-flow
We find a lower temperature in the central region, when compared to the mean cluster temperature, in a similar way that Markevitch et al. (1998) also find. They claim that it is a sign of a strong central cooling-flow. However, the difference in temperature we find is only of about keV and, given our error bars, our results are also compatible with an isothermal temperature radial profile. Nevertheless, at level, the temperature is not isothermal, having a profile that decreases towards the centre. The outermost ring shows an substantial increase in temperature, but its error bars are very large (due to the small number of counts).
Supporting the existence of a central cooling-flow is the fact that we have a better fit using a 2-temperature plasma model, with one of the components being very cold. This cold component was detected only in the central 2 arcmin region, as observed in most clusters with cooling-flows. However, this cold gas at keV cannot be related to the Extreme Ultra-Violet (EUV) excess found in some clusters by the EUVE satellite (Lieu et al. 1996; Lieu et al. 1999).
A cooling-flow picture is also supported by the hydrogen column density that we detect in the centre, much higher that the mean cluster value and at least two times higher than the galactic value from Dickey & Lockman (1990). Notice that there is some correlation between and (as seen in Fig. 2) in the sense that lower temperatures are obtained with higher hydrogen column densities.
The last evidence for a cooling-flow is the large metallicity found in the centre, significantly higher (at the level) than the metallicity found elsewhere in the cluster.
The central region also shows a strong radio emission, both at 330 and 1400 MHz, however we detected no non-thermal emission. The superposed radio and optical data presented in our earlier work (cf. Figure 2, Bagchi et al. 1998) show that this radio emission comes from the region of the central giant elliptical and another elliptical arcmin to north-west of it. Possibly both these are active radio galaxies pouring relativistic electrons in the ICM.
5 Conclusions
We have presented new X-ray data in the range [0.1–10.0] keV obtained with BeppoSAX. Upon analysing the spectrum of a circular region centred at the position of the VSSRS, we have derived the following mean values: keV, and cm-2. The temperature is in good agreement with the value determined by ASCA (Markevich et al. 1998), while the metallicity is in agreement with the value determined by ROSAT PSPC (Pislar et al. 1997).
Our main results are summarized below:
-
•
We have derived an abundance ratio between -elements/iron greater than 1 and the iron metallicity is systematically lower than the mean metallicity. The over abundance of -elements may be an indication of an early enrichment of the ICM by type II SN in elliptical galaxies.
-
•
The central region is better fitted with two temperature components, the lower temperature being lower than keV. This supports the existence of a multi-phase central cooling-flow.
-
•
Since we could not separate unambiguously the thermal from the non-thermal X-ray emission, we have estimated, in a number of cases with different fitting procedures, the non-thermal X-ray flux. From these values and using the radio spectrum data, we derive a lower limit intensity of the extended magnetic field, G.
-
•
The South Blob region shows a significantly lower metallicity than the rest of the cluster. Its temperature is also higher than its neighbouring regions. Such results support the picture of an in-falling stream merging with the main body of Abell 85 in that region. The VLA radio data shows the presence of both extended magnetic field and relativistic particles in this zone. These may originate in an energy transfer from a strong shock that formed in a supersonic merger of intergalactic matter.
Acknowledgements.
We thank F. Durret and D. Gerbal for fruitful comments and discussion. We thank Fabrizio Fiori for his valuable help with the BeppoSAX data reduction. This research has made use of SAXDAS linearized and cleaned event files (Rev.1.1) produced at the BeppoSAX Science Data Center. GBLN acknowledges financial support from the usp/cofecub cooperation.References
- (1) Andres E., Grevesse N., 1989, Geochimica et Cosmochimica Acta 53, 197
- (2) Bagchi J., Enßlin T.A., Stalin C.S., Humeshkar N.B., Singh M., 2000, Nature (submitted)
- (3) Bagchi J., Pislar V., Lima Neto G.B., 1998, MNRAS 296, L23
- (4) Baldwin J.E., Scott P.E., 1973, MNRAS, 165, 259
- (5) Balucinska-Church M., McCammon D., 1992, ApJ 400, 699
- (6) Boella G., Butler R.C., Perola G.C., Piro L., Scarsi L., Bleeker J.A.M., 1997a, A&AS 122, 299
- (7) Boella G., Chiappetti L., Conti G., Cusumano G., del Sordo S., La Rosa G., Maccarone M.C., Mineo T., Molendi S., Re S., Sacco B., Tripiciano M., 1997b, A&AS 122, 327
- (8) Churazov E., Gilfanov M., Forman W., Jones C., 1996, ApJ 471, 673
- (9) Cusumano G., Mineo T., 1998, “On-flight calibration of the MECS vignetting”
- (10) Dickey J.M., Lockman F.J., 1990, ARA&A, 28, 215
- (11) Donahue M., Voit G.M., 1993, ApJ 414, L17
- (12) Durret F., Forman W., Gerbal D., Jones C., Vikhlinin A., 1998, A&A 335, 41
- (13) Edge A.C., Stewart G.C., Fabian A.C., 1992, MNRAS 258, 177
- (14) Elbaz D., Arnaud M., Vangioni-Flam E., 1995, A&A 303, 345
- (15) Enßlin T.A., Biermann P.L., Klein I., Kohle S., 1998, A&A 332, 395
- (16) Feenberg E., Primakoff H., 1948, Phys. Rev. 73, 449
- (17) Feretti L., Giovannini G., 1996, IAU Symp. 175 “Extragalactic Radio Sources”, p. 333 (Ekers R., et al. eds.) Kluwer: Dordrecht
- (18) Fiore F., Guaianazzi M., Grandi P., 1999, “Cookbook for BeppoSAX NFI spectral analysis”, version 1.2, www.sdc.asi.it/pub/sax/doc/software_docs/saxabc_v1.2.ps.gz
- (19) Fukazawa Y., Makishima K., Tamura T., Ezawa H., Haiguang X., Ikebe Y., Kikuchi K., Ohashi T., 1998, PASJ 50, 187
- (20) Joshi M.N., Kapahi V.K., Bagchi J., 1986, ‘Proc. of NRAO Workshop on Radio Continuum Processes in Clusters of Galaxies’, p. 73 (O’Dea C.P., & Uson J.M eds.)
- (21) Kaastra J.S., Mewe R., 1993, A&AS 97, 443
- (22) Kronberg P.P., 1994, Rep. Prog. Phys. 57, 325
- (23) Liedahl D.A., Osterheld A.L., Goldstein W.H., 1995, ApJ 438, L115
- (24) Lieu R., Mittaz J.P.D., Bowyer S., Breen J.O., Lockman F.J., Murphy E.M., Hwang C.Y., 1996, Science 274, 1335
- (25) Lieu R., Bonamente M., Mittaz J.P.D., Durret F., Dos Santos S., Kaastra J., 1999, ApJ 527, L77
- (26) Lima Neto G.B., Pislar V., Durret F., Gerbal D., Slezak E., 1997, A&A 327, 81
- (27) Loewenstein M., Mushotzky R.F.,1996, ApJ 466, 695
- (28) Markevich M., Forman W.R., Sarazin C.L., Vikhlinin A., 1998, ApJ 503, 77
- (29) Martinelli A., Matteucci F., Colafrancesco S., 2000, A&A 354, 387
- (30) Miniati F., Ryu D., Kang H., Jones T.W., Cen R., Ostriker J.P., 2000, ApJ 542, 608
- (31) Mushotzky R.F., Loewenstein M., Arnaud K.A., Tamura T., Fukazawa Y., Matsushita K., Kikuchi K., Hatsukade I., 1996, ApJ 466, 686
- (32) Parmar A. N., Martin D. D. E., Bavdaz M., Favata F., Kuulkers E., Vacanti G., Lammers U., Peacock A., Taylor B. G., 1997, A&AS 122, 309
- (33) Pislar V., Durret F., Gerbal D., Lima Neto G.B., Slezak E., 1997, A&A 322, 53
- (34) Prestwich A.H., Guimond S.J., Luginbuhl C.B., Joy M., 1995, ApJ 438, L71
- (35) Raymond J., Smith B.W., 1977, ApJS 35, 489
- (36) Rephaeli Y., Gruber D.E., 1988, ApJ 333, 133
- (37) Sarazin C.L., 1999, ApJ 520, 529
- (38) Steward G.C., Fabian A.C., Jones C., Forman W., 1984, ApJ 285, 1