Evidence for a Sudden Magnetic Field Reconfiguration in SGR 1900+14
Abstract
We report the detection of large flux changes in the persistent X-ray flux of SGR 190014 during its burst active episode in 1998. Most notably, we find a factor 700 increase in the non-burst X-ray flux following the August 27th flare, which decayed in time as a power-law. Our measurements indicate that the pulse fraction remains constant throughout this decay. This suggests a global flux enhancement as a consequence of the August 27th flare rather than localized heating. While the persistent flux has since recovered to the pre-outburst level, the pulse profile has not. The pulse shape changed to a near sinusoidal profile within the tail of the August 27th flare (in -rays) and this effect has persisted for more than 1.5 years (in X-rays). The results presented here suggest the magnetic field of the neutron star in SGR 190014 was significantly altered (perhaps globally) during the giant flare of August 27.
1 Introduction
Soft Gamma Repeaters (SGRs) are believed to be a rare class of magnetized neutron stars whose collective behavior challenges physical models to explain their observed properties. There are currently four known SGRs and one candidate source (see Hurley 2000 for a review). They emit brief (durations 0.1 s), intense (super-Eddington luminosities 1042 ergs s-1) bursts of hard X-rays and soft -rays which repeat on timescales of seconds to years. On two exceptional occasions over the last 20 years, giant flares that reached 1045 ergs s-1 were observed. These two events were associated with SGR 052666 (Mazets et al. 1979) and SGR 190014 (Hurley et al. 1999a). Three of the four SGRs are positionally coincident with young supernova remnants (SNRs; SGR 190014 lies 2′ outside G42.00.8 and its association is more suspect [Vrba et al. 2000; Lorimer & Xilouris 2000]) and all are associated with persistent X-ray counterparts. These counterparts have luminosities in quiescence of ergs s-1 and spectra that can be roughly characterized by a simple power-law (2.2) attenuated by interstellar absorption. Coherent pulsations have recently been detected in the persistent emission from two of these sources (SGR 180620 at 7.5 s [Kouveliotou et al. 1998] and SGR 190014 at 5.2 s [Hurley et al. 1999b]). Both sources are spinning down rapidly at rates 10-10 s s-1 (Kouveliotou et al. 1998 and Kouveliotou et al. 1999, respectively).
Most physical models for SGRs agree that they are young, isolated, magnetized neutron stars. The theories differ on the proposed strength of the stellar magnetic field, and hence, the energy source of the emitted radiation. Models that suggest the SGRs have field strengths G (e.g. Marsden et al. 2000) requires accretion to account for the persistent X-ray emission. Such models have not yet offered any explanations for the hyper-Eddington burst emissions. On the other hand, Thompson & Duncan (1995, 1996) have put forward a model for the SGRs as highly magnetized neutron stars ( G), i.e. magnetars, which can account for both the persistent and burst emission properties. In the magnetar model, the decay of the superstrong magnetic field powers the persistent X-ray emission through low-level seismic activity and heating of the stellar interior (Thompson & Duncan 1996). The bursts are due to large-scale crust fractures that are driven by the evolving magnetic field (Thompson & Duncan 1995). The super-Eddington burst fluxes can be achieved in the presence of such a strong field due to the suppression of the electron scattering cross-section for some polarizations (Paczyński 1992).
SGR 190014 was discovered after only three bursts were recorded from the source in 1979 (Mazets & Golenetskii 1981). Thirteen years later, four more events were detected from this SGR (Kouveliotou et al. 1993). The pulsed signal at 5.2 s from SGR 190014 was discovered (Hurley et al. 1999b) during an April 1998 observation of the source with the Advanced Satellite for Cosmology and Astrophysics (ASCA). This observation coincidentally took place just three weeks prior to burst reactivation of the SGR (Hurley et al. 1999c). Subsequent observations with the Proportional Counter Array (PCA) aboard the Rossi X-ray Timing Explorer (RXTE) of SGR 190014 confirmed the pulsations and established that the source was spinning down rapidly, having a period derivative s s-1 (Kouveliotou et al. 1999).
The peak of the burst active phase for SGR 190014 was reached on 1998 August 27 when a giant flare was recorded by numerous instruments. This flare started with a short (0.07 s), soft spike (often referred to as the “pre-cursor”) that was followed by a much brighter, hard pulse (duration 1 s) that approached 1045 ergs s-1, and a soft -ray tail modulated at 5.2 s (Hurley et al. 1999a; Feroci et al. 1999; Mazets et al. 1999). The 5.2 s oscillating tail decayed in a quasi-exponential manner over the next 6 min (Feroci et al. 2000). Integrating over the entire flare (assuming isotropic emission), at least 1044 ergs were released in -rays greater than 15 keV (Mazets et al. 1999). Shortly after this flare, the All-Sky Monitor (ASM) aboard RXTE detected SGR 190014 for the first time in its four year mission at a flux level of 0.1 Crab (Remillard, Smith & Levine 1998). Approximately one week following the bright August 27th flare, a transient radio flare lasting 10 days was recorded with the Very Large Array (Frail, Kulkarni & Bloom 1999). The temporal decay of this radio flare is consistent with a power-law having an exponent of 2.6 1.5 (Frail et al. 1999). On August 29, another bright SGR burst was detected which resembled the August 27th flare in many ways (Ibrahim et al. 2000). Like the giant flare, this burst had a well-defined, relatively weaker pre-cursor and was followed by a long (1000 s), oscillitory tail. However, this burst was scaled down in both peak luminosity and duration in -rays by a factor 100.
Sixteen days after the August 27th flare, imaged X-ray observations with ASCA and the Satellite per Astronomia X (BeppoSAX) of the SGR recorded the persistent flux level of the source, which had grown by a factor 2.5 above the value prior to burst activity (Murakami et al. 1999; Woods et al. 1999a). From an earlier observation of SGR 190014 with BeppoSAX in 1997 May, while the source was in quiescence, we found that the spectrum could not be fit by a simple power-law model; however, the sum of a blackbody and a power-law provided an adequate fit to the 0.110 keV source spectrum (Woods et al. 1999a). A recent analysis of the ASCA observation in 1998 April, preceding reactivation by 3 weeks, shows that the two-component model (blackbody power-law) yields a significantly better fit to the data (D. Marsden, private communication). By including a low temperature ( 0.5 keV) blackbody component in the spectral model, the power-law index becomes flatter to accomodate the blackbody flux contribution which is most prominent at the low end of the observed energy range. Consequently, the photon index measured using the two-component model ( in 1997 May) differs significantly from the index as measured using a simple power-law model for the same data ( [Woods et al. 1999a]). When the source became more luminous during the burst active phase, the X-ray energy spectrum could be adequately modeled with a simple power-law. The thermal component was no longer significant, hence, the flux enhancement was attributed to a rise in the power-law component of the spectrum (Woods et al. 1999a). Note that this does not imply the blackbody component “disappeared” or even faded, but was rather overwhelmed by the much brighter power-law component.
Here, we have analyzed a large set of X-ray observations of the source in order to construct a more complete flux history for SGR 190014. We compare changes observed in the pulse profile during the tail of the August 27th event with changes in the pulse profile of the persistent emission. We discuss these observations and the constraints they place on different models for the SGRs. Finally, we suggest that these new observations support the idea of a long-lasting reconfiguration of the stellar magnetic field that took place during the August 27th flare.
2 The X-ray Data Set
Since 1992, there have been only 8 pointed observations with X-ray imaging instruments of the persistent counterpart to SGR 190014 (not including surveys). Two observations were performed with the Roentgen Satellite (ROSAT) High Resolution Imager (HRI), two with ASCA, and four with the BeppoSAX Narrow Field Instruments (NFI). To supplement this sparse data set, we have included more than 20 other observations using the PCA and ASM aboard RXTE. The PCA observations were particularly well-sampled during the burst active phase of the source in 1998. This time period is of key interest since it contains both the BeppoSAX and ASCA measurements of a 2.5 factor intensity increase in the persistent flux above the quiescent level and the ASM detection at 0.1 Crab.
With the exception of the two ROSAT HRI (0.12.4 keV) observations in 1994 and 1995, the instruments that observed SGR 190014 had good sensitivity within the energy range 210 keV. To make an adequate comparison of the source flux between different epochs, we have chosen to use this nominal energy range (210 keV) for flux measurements. For this reason, we have excluded the ROSAT observations from our sample. For the first two BeppoSAX NFI observations (1997 May and 1998 September) as well as for the two ASCA observations, we used the flux measurements reported earlier (Woods et al. 1999a, Hurley et al. 1999b and Murakami et al. 1999, respectively). We report here on more recent NFI observations made in March and April 2000.
2.1 BeppoSAX NFI Observations
The BeppoSAX NFI observed the source on 2000 March 30 and April 26, approximately one year after the last detected burst activity from SGR 190014. The source exposure times were 40 ks and 40 ks for the Medium-Energy Concentrator Spectrometers (MECS) and 15 ks and 18 ks for the Low-Energy Concentrator Spectrometer (LECS) during the respective observations. In each observation, the SGR was aligned with the optical axis of the instruments. We used source extraction regions of 4′ and 8′ for the MECS and LECS, respectively. Due to the low Galactic latitude and dim intensity of SGR 190014, concentric rings of 6.49.6′ and 913′ were chosen from each pointing for background subtraction with the MECS and LECS, respectively. The resulting spectra were then analyzed using XSPEC v10.00 along with the most recent response matrices and effective area corrections.
We fit the data (0.1210.5) to four different models, a simple power-law (PL), a blackbody, a thermal bremsstrahlung, and a power-law plus a blackbody (PLBB), all modified by interstellar absorption. Both the blackbody and thermal bremsstrahlung models yielded poor fits to the data, while the PL and PLBB models returned reduced values below 2. We find no significant difference in the spectral parameters (including source flux) between the two observations. For this reason, we decided to fit the two data sets simultaneously in order to better constrain the model parameters. We did allow for independent normalization factors for the LECS and MECS instruments as there tends to be a 510% systematic difference between the detector normalizations. As with the pre-outburst BeppoSAX observation from 1997 May, the PLBB model provided the best fit to the data (see Table 1). We quantified the preference of this model over the PL model using the F-test. The probability that the measured difference (31) between the PLBB model and the PL model would occur by chance is 1 10-6. The unabsorbed 210 keV X-ray flux measured in 2000 March/April is 1.03(5) 10-11 ergs cm-2 s-1 with 20% of this flux coming from the thermal blackbody component. We note that the flux level in these recent observations is consistent with the flux measured in 1997 May (Fx = 0.99(4) 10-11 ergs cm-2 s-1 [Woods et al. 1999a]), hence, we conclude that the source has returned to its quiescent flux level. Furthermore, all other spectral parameters measured in the 2000 observations are consistent with the 1997 BeppoSAX measurements with the exception of the power-law photon index () which has steepened slightly (3.5) between the two observations.
The event times for the combined MECS units were corrected to the Solar-system barycenter and we then performed an epoch-fold period search within each observation between 5.15 and 5.25 s. We detect the pulsed signal in each observation and measure significant spin down since the last reported X-ray measurements in early 1999 (Woods et al. 1999b) as well as between the two BeppoSAX observations. The details of the timing of SGR 190014 will be discussed elsewhere (Woods et al. 2001). From the earlier BeppoSAX observations, we noted that despite a large change in source flux and pulse profile of the SGR, the root-mean-square (RMS) pulsed fraction remained constant. For the observations of 2000 March and April, we measure RMS pulse fractions of 9.4% 1.7% and 10.4% 1.7%, respectively. These values are consistent with the measurements from 1998 September (11.4% 1.5%) and 1997 May (12.2% 1.1%). This result shows the pulse fraction is constant at least within the four BeppoSAX observations which span 3 years and varying levels of source intensity and activity.
2.2 ASM Observations
Remillard et al. (1998) reported that analysis of the real-time data stream from the RXTE All-Sky Monitor (ASM) revealed a detection of SGR 190014 at 100 mCrab (212 keV) approximately two hours after the giant flare of August 27. A reexamination of the complete production light curve shows that an additional 90-s observation was performed at only 24 minutes after the flare, and this observation found SGR 190014 to be 270 17 mCrab. By 7 h after the flare, the intensity of the source had fallen below the ASM detection threshhold of 20 mCrab, and has not been detected reliably since. An observation just 20 minutes before the flare shows no detectable emission from SGR 190014.
The ASM performed two passes over SGR 190014 during the 2.5 h after the flare. We have checked the Burst and Transient Source Experiment (BATSE) data for the five 90-s ASM observations performed during these passes. We find that the SGR was not occulted by the Earth for BATSE and there is no indication of significant burst activity in the large-area detector discriminator data (1.024 s time resolution). Therefore, the following ASM measurements reflect only the persistent, non-burst flux level. During each of the five 90-s ASM observations, or dwells, the best-fit average count rates for the SGR were calculated in three energy channels (1.53, 35, and 512 keV), and these count rates were averaged over each pass to yield two intensity measurements. To convert these intensities into fluxes, we took a simple power-law spectrum with a fixed slope of 2.2, as derived from the BeppoSAX observations of 1998 September 15, integrated over an estimated effective area for the ASM, and fit the spectral normalizations to the observed intensties. The effective area table for the ASM is a theoretical construct, compiled during the design phase of the experiment, and may differ from the actual response of the instrument. The unabsorbed flux (210 keV) at 0.4 and 2.1 hours following the beginning of the flare decayed from (7.2 0.5) to (2.6 0.5) 10-9 ergs cm-2 s-1. The errors here represent the statistical errors convolved with a 3% systematic error as is standard for the ASM data. There are likely further systematic errors that we are not able to accurately account for (e.g. uncertainties in the ASM effective area, spectral evolution between the ASM observations and the BeppoSAX observations).
2.3 PCA Observations
Due to the fact that the PCA is not an imaging instrument and there exist at least two bright and variable X-ray sources (4U 190709 and XTE J190609) close in angle to SGR 190014, extracting the SGR flux from these measurements required an alternative approach. From the four BeppoSAX NFI observations of SGR 190014, we know that despite the observed changes in source intensity and pulse profile, the RMS pulsed fraction remained constant. If this property of the SGR holds at all times, then a measure of the pulsed intensity would relate directly to the net source intensity. A pulsed intensity measurement with the PCA is much “cleaner” in that there is no ambiguity with where the signal originates. Under the premise that the pulsed fraction remains constant, we set out to measure the RMS pulsed intensity of SGR 190014 and indirectly, the net source flux using the PCA observations.
First, the data were grouped into segments where the PCA instrument configuration was constant, that is, observations with the same set of PCUs on and a fixed pointing. One 3 day segment near 1998 September 8 was eliminated from our sample due to the occurrence of a bright outburst from XTE J190609 (Takeshima, Corbet & Swank 1998) which dominated the count rate in the PCA. Next, the 210 keV data for each selected interval were folded on the phase connected solutions reported in Woods et al. (1999b) for the data prior to 1999 and on ephemerides reported in Woods et al. (2001) for subsequent observations. For each detector configuration, the collimator efficiency111The collimator efficiency files for each PCU can be found at the following www address: http://lheawww.gsfc.nasa.gov/users/keith/fieldofview/collimator.html in units of counts s-1 PCU3-1 was calculated and the count rates in each phase bin of the folded profile were corrected accordingly. Finally, the RMS pulsed intensity for each folded light curve was measured.
3 The Flux History

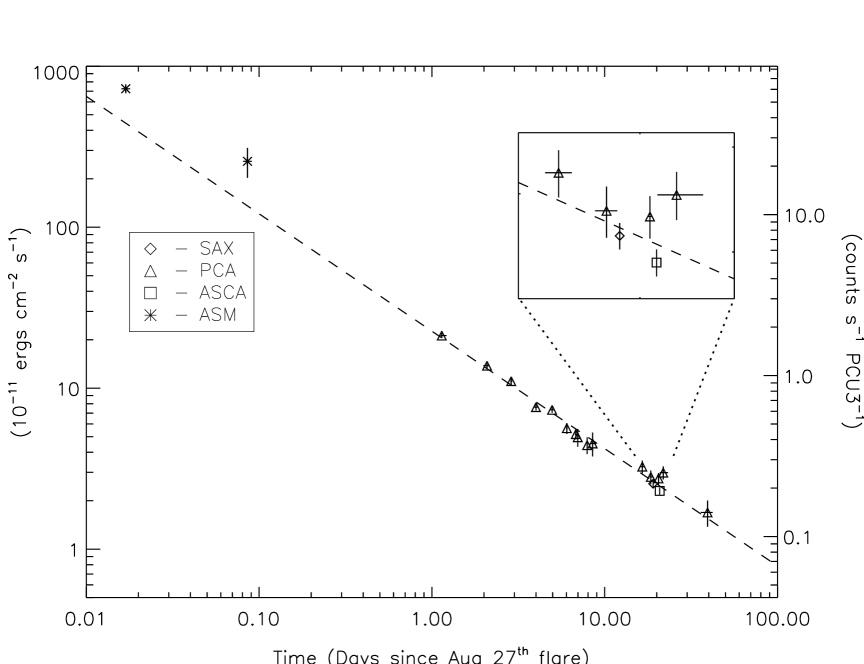
The flux history of SGR 190014 over 3.8 years is given in the middle panel of Figure 1. The scale on the left vertical axis corresponds to the BeppoSAX and ASCA measurements. The right axis applies to the PCA pulsed flux measurements. The relative normalization between the pulsed flux measurements and the net source flux measurements was calculated in the following way. Prior to burst reactivation of the source in 1998 May, there was one observation each with RXTE, BeppoSAX, and ASCA. The two flux measurements during quiescence with the two imaging instruments, BeppoSAX in 1997 May and ASCA in 1998 April, are consistent with one another. Since our only measurements of a change in source flux are during a burst active interval, we assume the SGR flux is constant in quiescence. Therefore, we defined the normalization to be the ratio of the source flux as measured by BeppoSAX prior to burst activity in 1997 May to the PCA pulsed intensity measurement from 1996 September. We use this normalization to define the source flux from the PCA measurements during the burst active period. Note the good agreement of the pulsed intensity measurements (PCA) to nearly simultaneous net source intensity measurements (BeppoSAX and ASCA) following reactivation (inset of Figure 2). This strengthens our initial hypothesis that the pulsed fraction remains constant, even during burst active phases of the source. The pulsed intensity observations made with the PCA suggest the net source intensity of SGR 190014 increased by a factor 20 over the quiescent level approximately 1 day after the giant flare.
We next compared the changes observed in source flux with the change in burst activity. We quantified the burst activity using the burst rate as observed with BATSE (top panel of Figure 1). Note the good correlation between the rise and decay of the burst activity and the rise and decay of the SGR flux. We find a significant increase of the source flux during the initial burst activity of 1998 May/June, which shows the flux enhancement correlates not only with the giant flare, but also with the more common recurrent bursts. The next measurements were made starting 1 day after the giant flare and found the SGR flux was more than an order of magnitude brighter than the level during quiescence. This transient flux enhancement was an artifact of the August 27th flare, lasting 40 days, and is discussed in greater detail below. The next sequence of pulsed flux measurements was acquired over the first seven months of 1999. During these observations, we observe a gradual decline of the X-ray flux as well as the burst occurrence rate of the SGR. It is not clear from these observations whether the flux enhancement within this portion of the X-ray lightcurve is connected with a slow decay component associated with the August 27th flare (Kouveliotou et al. 2001), or instead, the sum of multiple smaller enhancements from burst activity in the last few months of 1998 and the first half of 1999. The next observations of SGR 190014 were performed in 2000 MarchJuly, starting 11 months after the last recorded burst emission from the source. These observations found the source flux had returned to the pre-outburst level (see also section 2).
Focusing now on the large flux change observed following the giant flare, we find the net/pulsed flux decayed according to a power-law relative to the onset of the flare. Using both the net and the scaled pulsed flux measurements, we fit the data to a power-law and find a decay constant of 0.713 0.025. This value is consistent with the power-law flux decay (F t-0.8±0.1) found following the burst of August 29 (Ibrahim et al. 2000). Extrapolating the fit to the August 27th X-ray light curve back towards the flare itself, we find fair agreement between the flux level we would expect and the ASM flux measurements (Figure 2). We note, however, that each of the ASM measurements are significantly higher than the expectation from the fit. This discrepancy may be the result of assumptions made on the source spectrum and/or the instrumental response (see section 2.2), non-negligible flux enhancements following the numerous bursts during late September, a second component related to the flare itself, and/or a slightly later reference epoch. We know from the 1998 May/June PCA measurement that the recurrent burst activity increased the persistent SGR flux by a factor 2. The bursts following the giant flare in late August and early September do not likely contribute significantly to the already large enhancement present from the August 27th flare, however, the cumulative burst activity in mid/late September may provide comparable flux enhancements. This effect would tend to flatten the observed power-law decay slope. Another possibility is there are two components present in the ASM measurements directly after the flare; one associated with the long X-ray tail we observe for many days after the flare and one directly connected to the flare itself. Finally, the ASM measurements move closer to the fit when we push forward our reference epoch to 14 min after the onset of the flare. The observed duration of the August 27th flare in -rays (15 keV) is 6 min, so it is certainly conceivable that the SGR “afterglow” did not begin until somewhere near the end of the flare.
4 Pulse Profile Changes
In addition to undergoing large changes in source intensity, the pulse profile of SGR 190014 was altered dramatically during the burst active interval of 1998. Variation of the folded profile of the persistent X-ray source (210 keV) had been noted previously (Kouveliotou et al. 1999; Murakami et al. 1999; Woods et al. 1999b) as well as the pulse-to-pulse evolution (15 keV) found within the tail of the August 27th flare (Mazets et al. 1999; Feroci et al. 2000). Here, we combine the observations we have analyzed with the archival data in order to show the evolution of the folded profile over the last 3.8 years (Figure 3). The light curves in the top row were all recorded prior to the August 27th flare while the panels in the bottom row are all following. Both top and bottom rows are folded over the energy range 210 keV. The last panel on the top row was taken during/after significant burst activity in 1998 May/June, yet it shows very little change from previous observations. The two middle panels were generated from Ulysses data (25150 keV) of the giant flare. The left panel was created by folding the data from 40100 s after the onset of the flare, while the right panel displays the folded profile from 280330 s post-trigger. The time resolution of the Ulysses data is 0.5 s, therefore, these folded profiles are under-resolved. There are certainly finer structures in these profiles that are artificially removed due to this effect. The difference between the two light curves, however, is evident: the complexity of the pulse profile diminishes with time through the burst. This is in agreement with what has been reported elsewhere (Mazets et al. 1999; Feroci et al. 2000). The same qualitative behavior can be seen in the persistent emission by comparing the top and bottom rows of Figure 3, despite being generated over a different energy range (210 keV). From this observation, we conclude that the bulk of the pulse profile change observed in the persistent emission is independent of source flux and appears to depend solely on the temporal relation of the observations to the August 27 flare. This suggests that whatever caused the evolution of the pulse profile through the giant flare, also produced the change in the persistent X-ray light curve.

5 Discussion
We have shown that the X-ray counterpart to SGR 190014 underwent large changes in source intensity correlated with the burst activity of the source during 1998. Following the August 27 flare, the persistent SGR flux reached a maximum. This flux enhancement decayed over the next 40 days as a power-law in time with an exponent 0.71. All measurements of the RMS pulse fraction suggest this parameter remains constant despite the large excursion in the X-ray intensity of the SGR. Finally, we found the dramatic pulse profile change is independent of the change in luminosity of the source, but appears to be a direct consequence of the August 27th flare.
Pulse profile changes in a fixed energy band are not uncommon in accreting X-ray binaries. However, these changes are typically correlated with variations in mass accretion rate (see e.g. White, Nagase & Parmar 1995). For a constant mass accretion rate (i.e. X-ray luminosity), the pulse profiles tend to remain unchanged. This is not the case for SGR 190014. The persistent source flux has now (MarchJuly 2000) recovered to its quiescent level, yet the pulse profile has remained invariant since 1998 August 28. This result severely constrains all accretion models for SGRs.
The giant flare of August 27 released a large amount of energy in -rays ( ergs [Mazets et al. 1999]) within a relatively short time period (6 min). A fraction of a percent of this energy was stored by the star, and slowly re-radiated over the next 40 days to form the observed power-law decay of the persistent X-ray flux (Figure 2). Given the high luminosity associated with the giant flare, the radiative momentum released in the burst would excavate any hypothetical accretion disk out to a large radius where the diffusion time is of the order of months to years (Thompson et al. 2000). Therefore, accretion could not be re-established in such a short time (103 s) as to account for the giant flare afterglow. Furthermore, kinetic energy loss (rotation) is insufficient by orders of magnitude as an energy source. We conclude that the observed power-law flux decay is clear evidence for a fundamentally new type of energy dissipation in neutron stars.
The constant pulse fraction through the long X-ray tail, and the non-recovery of the pulse profile, argues strongly against the possibility of the afterglow from the August 27th flare being a strictly localized phenomenon. If the persistent, declining output were concentrated in a small fraction of the stellar surface or magnetosphere without reprocessing at larger radius, then the pulse fraction would be expected to change dramatically as the persistent flux returned to its baseline value. Taken at face value, this suggests that energy was released globally throughout the crust and magnetosphere of the star. The magnetosphere is the more likely location for the enhanced persistent emission because the BeppoSAX observations show the flux increase occured in the non-thermal power-law component of the persistent spectrum, not in the thermal blackbody.
We now address how the observed pulse profile change can be accommodated within the framework of the magnetar model. In the case of an isolated magnetar, the pulse shape of the persistent X-ray source is governed by the distribution of magnetic field and magnetospheric currents. Since the flux has recovered to the pre-outburst (i.e. quiescent) level, but the pulse profile has not, we conclude that either the X-ray flux is being reprocessed far outside the region where the non-thermal continuum is generated, or the distribution of currents within the magnetosphere was severely altered during the August 27th flare.
There is good evidence that the surface magnetic field of SGR 190014 had a multi-polar structure during the August 27th giant flare, based upon the complex profile observed in the large amplitude pulsations (Feroci et al. 2000). The hyper-Eddington flux of X-rays is easily channeled along (partially) open magnetic field lines in the presence of a small amount of matter. The reduction of the pulse profile from four sub-pulses to a single sub-pulse at the end of the giant flare has a simple explanation in terms of the diminishing volume of a trapped fireball (Feroci et al. 2000). Because the persistent X-ray flux is channeled passively along the field near the star, the higher multipoles are expected to remain following the giant flare. However, a giant flare may involve a global twist of the stellar magnetic field, which drives a long-lived electrical current to re-scatter X-rays at the electron cyclotron resonance near 10 stellar radii. In this model, the transient decay of the persistent emission requires the added presence of sharper field gradients, which could be created by a fracture of the rigid crust during the giant flare (Thompson et al. 2000). In light of these new observations, relevant concerns regarding this model would be the reappearance of the blackbody (presumably surface) emission in the presence of the optically thick scattering screen (which limits the amount of dissipation taking place within the screen), as well as the constancy of the pulse fraction before and after the giant flare.
We now consider an alternative explanation for the observed flux and pulse profile changes in which the magnetospheric currents of SGR 190014 are modified substantially through a global reconfiguration of the magnetic field. The reemergence of the blackbody component following the decay of the flux enhancement suggests that we are again observing radiation directly from the stellar surface. The observation of the simple pulse profile in the presence of the thermal component implies that the stellar magnetic field is now predominantly dipolar. Since the pulse profile was observed to change from complex (multi-polar field structure) to simple (di-polar field structure) within the August 27th flare, this line of reasoning suggests that the stellar magnetic field underwent a global reconfiguration at the time of the giant flare. This scenario requires a reorganization of the magnetic field both inside and outside the star, which would proceed on a hydromagnetic timescale rather than the much shorter dynamical time of the stellar magnetosphere, and could plausibly take as long as 300 s. A model suggesting a global field reconfiguration during the giant flare was proposed independently by Ioka (2000). Ioka’s model was developed to explain earlier observations related to the spin period evolution of this SGR near the time of the August 27th flare (Woods et al. 1999b). In Ioka’s model, gravitational energy was proposed to power the flare through a substantial change in the moment of inertia of the star and consequently, the total amount of magnetic energy released ( ergs) would exceed by several orders of magnitude the ergs observed in the -ray band. One may also consider a global field reconfiguration scenario with magnetic energy as the power source for the giant flare. If the higher multipoles carry a significant fraction of the external magnetic energy, then removing them would require expending some 1001000 times more energy than the observed output of the flare. In any model involving a global field reconfiguration of a magnetar, the total internal/external field energy must be nearly conserved during the transition, and currently, we find no compelling reason for this to be the case. In addition, if the magnetospheric currents were significantly modified during the giant flare, then the near equality between the “baseline” X-ray flux before and after the giant flare would be coincidental.
A strong, evolving magnetic field is the foundation of the magnetar model for the SGRs. The dramatic change in the pulse profile of SGR 190014 following the August 27th flare provides strong evidence for some type of large-scale reconfiguration of the magnetic field. The two models involving stellar field dynamics outlined above each have their own merits when compared to the observations, however, both involve some level of coincidence. Moreover, the global field reconfiguration model posesses a fundamental flaw in that the energetics of the model do not match the observations. Without a comprehensive model to explain the cause and long-lasting effects of the August 27th flare, the giant flares, and to a lesser extent SGRs in general, remain quite enigmatic.
References
- (1)
- (2) Duncan, R. & Thompson, C. 1992, ApJ, 392, L9
- (3)
- (4) Frail, D., Kulkarni, S. & Bloom, J. 1999, Nature, 398, 127
- (5)
- (6) Feroci, M., Hurley, K., Duncan, R.C. & Thompson, C. 2000, ApJ, in press
- (7)
- (8) Hurley, K., et al. 1999a, Nature, 397, 41
- (9)
- (10) Hurley, K., et al. 1999b, ApJ, 510, L111
- (11)
- (12) Hurley, K., Kouveliotou, C., Woods, P., Cline, T., Butterworth, P., Mazets, E., Golenetskii, S. & Frederiks, D. 1999c, ApJ, 510, L107
- (13)
- (14) Hurley, K. 2000, in AIP Conf. Proc. 526, Gamma-Ray Bursts: 5th Huntsville Symp., ed. R.M. Kippen, R.S. Mallozzi, & G.J. Fishman, (New York:AIP), 763
- (15)
- (16) Ibrahim, A., Strohmayer, T.E., Woods, P.M., Kouveliotou, C., Thompson, C., Duncan, R.C., Dieters, S., van Paradijs, J. & Finger M. 2000, submitted (astro-ph/0007043)
- (17)
- (18) Ioka, K. 2000, submitted (astro-ph/0009327)
- (19)
- (20) Kouveliotou, C., et al. 1993, Nature, 362, 728
- (21)
- (22) Kouveliotou, C., et al. 1998, Nature, 393, 235
- (23)
- (24) Kouveliotou, C., et al. 1999, ApJ, 510, L115
- (25)
- (26) Kouveliotou, C., et al. 2001, in preparation
- (27)
- (28) Lorimer, D. & Xilouris 2000, ApJ Letters, in press
- (29)
- (30) Marsden, D., Lingenfelter, R.E., Rothschild, R.E. & Higdon, J.C. 2000, ApJ, in press
- (31)
- (32) Mazets, E.P., et al. 1981, Ap&SS, 80, 3
- (33)
- (34) Mazets, E.P., Cline, T., Aptekar, R.L., Butterworth, P., Frederiks, D.D., Golenetskii, S.V., Il’inskii, V.N., & Pal’shin, V.D. 1999, Astron. Lett., 25, 635
- (35)
- (36) Murakami, T., Kubo, S., Shibazaki, N., Takeshima, T., Yoshida, A., & Kawai, N. 1999, ApJ, 510, L119
- (37)
- (38) Paczyński, B. 1992, Acta Astron., 42, 145
- (39)
- (40) Remillard, R., Smith, D. & Levine, A. 1998, IAUC 7002
- (41)
- (42) Thompson, C., & Blaes, O. 1998, Phys. Rev. D, 57, 3219
- (43)
- (44) Thompson, C., & Duncan, R. 1995, MNRAS, 275, 255
- (45)
- (46) Thompson, C., & Duncan, R. 1996, ApJ, 473, 322
- (47)
- (48) Thompson, C., Duncan, R., Woods, P.M., Kouveliotou, C., Finger, M.H., & van Paradijs, J. 2000, ApJ, 543, 340
- (49)
- (50) Vrba, F.J., Henden, A.A., Luginbuhl, C.B., Guetter, H.H., Hartmann, D.H. & Klose, S. 2000, ApJ, 533, L17
- (51)
- (52) White, N.E., Nagase, F. & Parmar, A. 1995, in X-ray Binaries, ed., W.H.G. Lewin, J. van Paradijs, E.P.J. van den Heuvel, Cambridge Univ. Press, 27
- (53)
- (54) Woods, P.M., Kouveliotou, C., van Paradijs, J., Finger, M.H., & Thompson, C. 1999a, ApJ, 518, L103
- (55)
- (56) Woods, P.M., et al. 1999b, ApJ, 524, L55
- (57)
- (58) Woods, P.M., et al. 2001, in preparation
- (59)
| Model | NH (1022 cm-2) | (keV) | Rbb (km)aaBlackbody radius without general relativistic correction (assumes d = 10 kpc) | bbPower law photon index | /dof |
|---|---|---|---|---|---|
| BBPL | 2.7 0.4 | 0.43 0.05 | 4 1 | 1.98 0.16 | 116.1/107 |
| PL | 2.4 0.2 | … | … | 2.45 0.06 | 146.8/110 |