Mid-Infrared observations of NGC 1068 with the Infrared Space Observatory††thanks: Based on observations with the ISO satellite, an ESA project with instruments funded by ESA Member States (especially the PI countries: France, Germany, the Netherlands and the United Kingdom) and with the participation of ISAS and NASA.
We report on Mid-Infrared (MIR) observations of the Seyfert 2 galaxy NGC 1068, obtained with ISOCAM in low-resolution spectro-imaging mode. The spatial resolution ( 5 ″) allows us to disentangle the circumnuclear starburst regions from the emission of the active galactic nucleus (AGN). The global spatial distribution of the Unidentified Infrared Bands (UIBs) is similar to the cold dust component, traced by the 450 m emission and the gaseous component obtained from the 12CO(1-0) map. However, a shift between the maximum of the UIB and 450 m emission is clearly seen in our maps. The UIBs in the MIR (5-16 m) originate almost exclusively from the starburst regions in the galactic disk with an emission peaking at the extremity of the stellar/gaseous bar at a distance of 1 kpc from the AGN. The spectrum of the nucleus is characterized over the whole 5-16 m range by a strong continuum which can be fitted with a power law of index . Moreover, the high [NeIII]/[NeII] ratio () in the nuclear region argues for a hard radiation field from the AGN. Observations indicate that the AGN in NGC 1068 contributes less than 5% to the total integrated UIB emission even though its hot dust continuum contributes as much as 75% to the total MIR flux. On the contrary, the nuclear contribution to the cold dust emission decreases considerably at submillimeter wavelengths and does not represent more than 25% of the total integrated emission at 450 m.
Key Words.:
Galaxies: active – Galaxies: individual: NGC 1068 – Galaxies: Seyfert – Galaxies: ISM – Infrared: galaxies1 Introduction
Due to its proximity (D=14.4 Mpc, 1 ″ on the sky corresponds to a physical separation of only 72 pc, Tully (1988)), NGC 1068 has become one of the best known active galaxies. It harbors the closest Seyfert 2 nucleus, it has been extensively observed from UV to radio wavelengths, and therefore it is regarded as a favorite target for high resolution observations. As a result, NGC 1068 is now the prototypical galaxy where one can test both models of emission due the presence of a central black hole (especially in the MIR; see Pier & Krolik (1992), Efstathiou et al. (1995), Granato et al. (1997)), as well as models describing the kinematics of circumnuclear starbursts associated with a bar, which are often encountered around active nuclei (e.g. Schinnerer et al. (2000) and references therein).
The presence of a massive black hole in the central region of this galaxy is supported by the observation of a radio jet which originates from an unresolved region of 60 mas (Muxlow et al. (1996)). Moreover, X-ray observations of the central region suggest large obscuration (e.g. Iwasawa et al. (1997), Matt et al. (1997)) presumably due to a thick torus invoked in the unified scheme (Antonucci 1993). Evidence for such a dusty torus and obscuring material around the nucleus have been recently reported in the Near-Infrared (NIR) using adaptive optics (e.g. Rouan et al. (1998)) and in the radio using VLBA observations (Gallimore et al. 1997). The precise localization of the central black hole is now accurately defined, in particular by the spatial coincidence of 1) the peak of the 12.4 m intensity (Braatz et al. (1993)), 2) the OH and H2O maser emission (Gallimore et al. 1996), 3) the center of the UV-optical polarization map (Capetti et al. (1995)), and 4) the apex of the conical shape of the narrow line region (NLR) observed by HST (Macchetto et al. (1994)).
Besides the contribution of the Seyfert nucleus, an important fraction of the bolometric luminosity of NGC 1068 (, Telesco et al. 1984) is also attributed to a circumnuclear star-forming ring of 3 kpc in diameter (Telesco & Decher 1988). Using the CO rotational line transitions as tracers of the cold molecular gas, the ring can be resolved into two distinct spiral arms (Helfer & Blitz (1995)) along which a string of several massive and clumpy HII regions is observed (Bland-Hawthorn & Sokolowski 1991a , 1991b ). These spiral arms originate from the ends of a gaseous and stellar bar observed at NIR wavelengths (Scoville et al. (1988), Thronson et al. (1989)). The same overall structure can also be seen in the cold/dense molecular gas via the HCN(1-0) emission (Tacconi et al. (1994)) as well as in more recent high resolution CO imaging of the galaxy (Schinnerer et al. (2000)). A study of the kinematics of the gas suggests that the molecular gas motions are explained in terms of Lindblad resonances associated with a barred potential, in combination with a warp of the gaseous disk in the ring (Schinnerer et al. (2000)). The bar as well as other gaseous features associated with cold dust emission in the spiral arms are also revealed in the Far-Infrared (FIR; Papadopoulos & Seaquist (1999)).
MIR observations appear to be particularly enlightening in studying NGC 1068 since the UV photons from the starburst and AGN activity are absorbed by dust and re-emitted in the MIR. Moreover, the lower extinction (A AV/70, Mathis (1990)) allows us to probe deeper into the regions which are obscured by large amounts of dust. After describing the ISO observations and data reduction in section 2, we present, in section 3, the details on the MIR morphology of the circumnuclear environment as well as the AGN/starburst spectral properties. We discuss the impact of these new data in section 4.
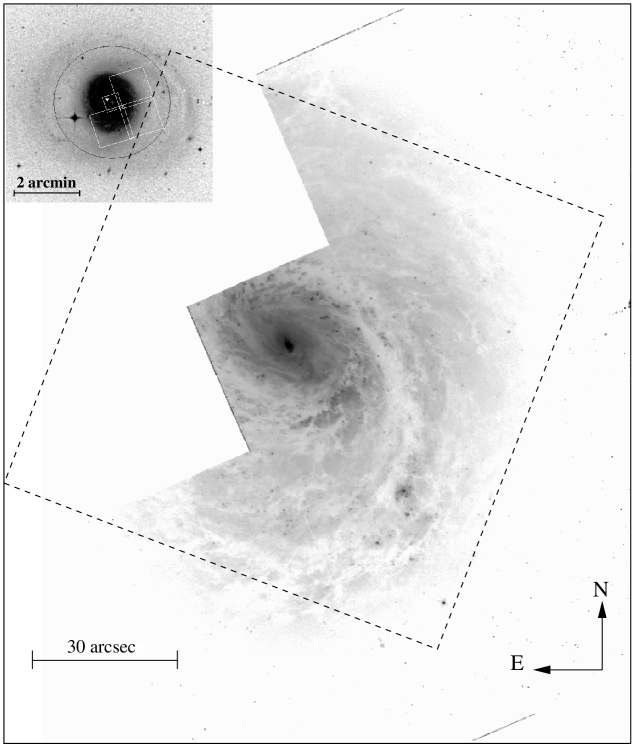
2 Observations and data reduction
NGC 1068 was observed with the ISOCAM camera (Cesarsky et al. 1996a ) on-board the Infrared Space Observatory (Kessler et al. (1996)). The data were obtained in low-resolution spectro-imaging mode, using the Continuously Variable Filter (CVF), resulting in a full coverage of the 5.1–16.3 m wavelength range with a spectral resolution between 30 and 40. The pixel size is 3 ″ providing a total field of view of 96 ″96 ″ (see Figure 1) with a full-width at half-maximum (FWHM) for the point spread function (PSF) between 4 ″ and 6 ″ from 5.2 to 16.3 m. The data reduction and analysis were performed using the CAM Interactive Analysis (CIA111CIA is a joint development by the ESA astrophysics division and the ISOCAM consortium.) following the standard techniques described in Starck et al. (1999) which include the correction for the dark current, the cosmic-rays and the memory effect of the detector. We also corrected the frames from the jitter effects which are due to the combination of 1) the satellite motion, 2) the continuous translation of the source on the detector as a function of the observed wavelength, which is an intrinsic feature of the ISOCAM CVF, and 3) the discontinuous shift of the target when changing from one CVF sector to another. This correction was performed by translating each resampled frame with respect to a common astrometric reference.
Several ghost images produced by multiple reflections between the detector and the filter plane are particularly present in CVF observations containing a bright point-like source (Okumura et al. 1998). The primary ghost which results from the first reflection is clearly observed in our CVF images (see Figure 2a). Its overall shape is characterized by a ring structure corresponding to the defocussed pupil image. Nevertheless, the surface brightness of the most luminous ghost is weak and represents only 7 of the average surface brightness of the central region (40 ″ in diameter). Moreover, as seen in Figure 5–16 in Okumura et al. (1998) which presents a ghost pattern similar to that of our observation, the ghost image is located essentially outside of the strong point-like source. Thus we conclude that the ghost did not affect significantly the photometry of the central region and therefore did not introduce a systematic bias in our analysis of the data.
The surface brightness of the PSF of the nucleus averaged over a region of 15 ″15 ″ is one order of magnitude greater than the surrounding starburst regions (see Figure 2a), so special care had to be taken in order to study the MIR spectral properties of the whole galaxy, and to correctly interpret the morphology of the environment surrounding the nucleus. The first method used was to subtract the contribution of the bright unresolved nucleus. This was done using a set of experimental PSFs created by observing stars during the calibration phase of the camera. An iterative method, which selected the best available PSF fit, was applied and the nuclear emission was subsequently removed. This subtraction of the central unresolved point source revealed two areas of strong MIR emission located in the circumnuclear ring which correspond to massive star-forming regions. Extensive tests showed that the use of experimental PSFs resulted in images with no observable artifacts up to 14 m. Beyond this limit, proper removal of the nuclear contribution was problematic since the experimental PSFs were obtained with various broad-band filters, and their large profiles beyond 14 m could not reproduce anymore that of the AGN observed with the CVF. The use of theoretically calculated PSFs was also envisionned but the results were of lower quality and consequently this method was not followed.
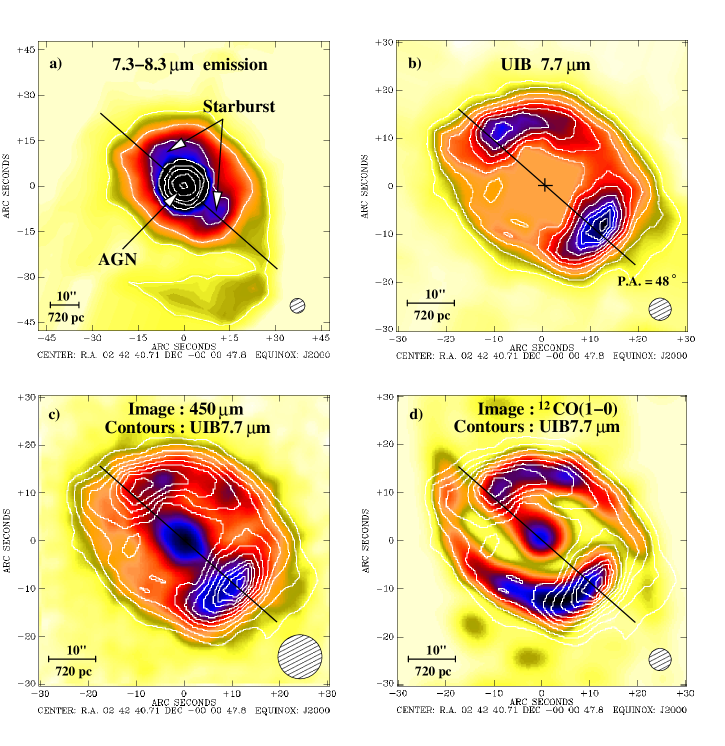
A second approach was to isolate the emission from MIR spectral features such as the various Unidentified Infrared Bands (UIBs) and to produce images of the spatial distribution of those features across the galaxy. This was done by identifying the spectral band of interest, which for the brighter UIB at 7.7 m was between 7.3 and 8.3 m, in all observed positions (pixels) on the galaxy and subtracting the underlying continuum emission (see Figure 3 for an illustration of the method). We have computed the flux density between 7.3 and 8.3 m in order to facilitate the comparison between the surface brightness of the UIB map and the original map including the continuum (see Figures 2a and 2b). Since it has now been widely demonstrated (see e.g. Laurent et al. 2000a, and references therein) that UIB emission is preferentially associated with regions of star formation and is markedly depleted in regions where a very hard radiation field is present such as those near an AGN, the spatial distribution of the UIB emission should trace the starburst regions of NGC 1068 quite accurately. Indeed, a picture similar to the one given by the PSF subtraction was obtained with this method, providing confidence on the reliability of the results. Consequently, this mapping of the spatial distribution of the UIB emission was used to produce the final picture of the starburst regions (cf. Figure 2b) and to analyze their morphology. In the central region (15 ″15 ″), the flux variation between each individual pixel resulting from the non-perfect correction of the jitter effect creates artificial noise and prevents us from estimating accurately the UIB emission. Furthermore, the [NeVI] emission line at 7.7 m does contaminate the UIB emission at that wavelength (Lutz et al. (2000)). To address this problem in a region of 15 ″15 ″ around the nucleus, where no UIBs were detected, we used as a template the starburst spectrum of Figure 3 in order to estimate an upper limit for the 7.7 m UIB emission based on the detectability of the 6.2m feature. The structures we detect applying this method are consistent with the 10.8 m observations of Telesco & Decher (1988). In particular, the agreement between the position angles of the different MIR spots suggests that the orientation angle of the ISOCAM data is well defined. This is also supported by the fact that no such angular uncertainties were ever reported in ISOCAM deep surveys where they would have been easily observed, because of the large number of detections on large spatial scales.
Due to their good spatial resolution, our observations also allowed us to analyze the different spectral energy distributions (SEDs) of the nuclear environment as well as the MIR emission in the ring surrounding it. Whereas the spectrum of the star-forming regions was obtained after the removal of the contribution from the unresolved point source, via the PSF subtraction method described earlier, the spectrum of the nucleus was directly measured in the CVF data and estimated over a central region of 700 pc in diameter. The only correction applied was to account for the varying size of the PSF at different wavelengths. The ISO-SWS spectrum of the nuclear region over an aperture of 14 ″20 ″ for 2.5–12 m and 14 ″27 ″ for 12–27.5 m presented by Lutz et al. (2000) is similar in shape and intensity to the ISOCAM spectrum of the AGN in Figure 4, while the intensity offset between the two spectra is less than 20. Our observations are also consistent to a 20 level with the 8–13 m spectrum published by Roche et al. (1984). Ground based observations with broad band filters obtained by Rieke Low (1975) and more recently by Bock et al. (2000) show also a general agreement with our data since the differences are lower than 30 and 15 respectively.
The relative photometric uncertainty on the AGN spectrum is mainly produced by 1) the non-perfect correction of the detector memory effect, estimated at 10 and 2) by the error on the PSF aperture correction which can reach 10 at longer wavelengths. The relative uncertainty varies from 10 at 5 m up to 15 at 16 m. We estimate that the absolute uncertainty of our photometric measurements is 20 for the AGN spectrum. This value is fully consistent with the different MIR observations of the central region of NGC 1068 obtained using a large variety of instruments. For the starburst spectrum presented in Figure 3, the photometry can be strongly affected by a residual AGN contribution at wavelengths above 14 m. Nevertheless, the shape of the UIBs is very similar to that observed in other starburst galaxies (Laurent et al. 2000a). Based on our experience with ISOCAM data we estimate that an uncertainty of 30 for the absolute photometry constitutes a conservative upper limit for the starburst contribution, which is typical for well detected extended sources.
3 The central region of NGC 1068 in the Mid-Infrared
3.1 Morphology of the circumnuclear environment
The images obtained by mapping the different UIB features at 6.2, 7.7, 8.6 and 11.3 m are consistent with one another. In Figure 2b, we map the spatial distribution of the 7.7 m feature, which is one of the strongest UIBs. One of the main advantages in using the 7.7 m feature is that contrary to the UIBs at 8.6 and 11.3 m, its intensity is not affected by the silicate absorption at 9.7 m (see the MIR spectrum of Arp 220 in Charmandaris et al. (1999)). It is also preferred to the feature at 6.2 m because of its higher flux, providing a better signal to noise ratio when subtracting the underlying continuum emission. As we discuss in the following section, the 7.7 m feature is considered as a powerful indicator of star forming environments (e.g. Genzel et al. 1998, Rigopoulou et al. (1999)). The two starburst regions detected with ISOCAM are located North-East and South-West of the nucleus, in agreement with the spots of MIR emission observed at 10.8 m by Telesco & Decher (1988). They are roughly extending on both sides of the extremities of the stellar bar (, P.A. , Scoville et al. (1988)). This concentration near the ends of the bar may be the result of density waves that compress and shock the gas present in the spiral structure, which in turn triggers the star-forming activity (Telesco & Decher 1988, Tacconi et al. (1994), Schinnerer et al. (2000)).
While the MIR observations allow us to map the hot dust and the UIB emission, the FIR emission reveals the distribution of the cold dust in the galaxy. FIR observations of NGC 1068 show that, in general, the cold dust is spatially correlated with the emission of the CO/HI gas (Papadopoulos & Seaquist (1999)). The extended FIR emission, which is attributed to a dust component with temperature of T10 K, seems to be associated with regions of high HI column density. More concentrated and warmer dust (T30 K) though, is found in the inner starburst and it follows the distribution of the molecular gas. In Figure 2c, the ISOCAM 7.7 m image is overlaid on the cold dust distribution traced by the 450 m FIR image obtained with SCUBA (Papadopoulos & Seaquist (1999)). The two images have been translated with respect to each other, so that the positions of the unresolved nucleus coincide. Comparing the ISOCAM and SCUBA data, a striking shift between the dominant peaks of emission in the Mid and Far-Infrared is apparent. This shift can not be a residual in the MIR data due to the contamination from the AGN continuum since the same morphology is also observed in the other UIB maps at 6.2, 8.6 and 11.3 m, even though the point-like emission of the AGN is different at these different wavelengths. A systematic error in the orientation angles of either the ISOCAM or SCUBA maps given the observed performance of both instruments over the years is highly unlikely. Furthermore, it does not seem possible to exactly overlay all the features of both maps with a simple rotation.
Since the inner regions of NGC 1068 rotate counterclockwise, the shift may indicate that the main features of the circumnuclear ring detected with ISOCAM lead by 5 ″ ( 360 pc) those observed by SCUBA. We mentioned already that the spots of emission revealed at submillimeter wavelengths could be attributed to large amounts of cold dust heated by the local interstellar radiation field. On the contrary, the UIB emission traces recent star-forming regions located at the extremities of the bar. This type of ISM morphology and formation of shocks in spiral arms have been predicted by theoretical models (e.g. Athanassoula & Bureau (1999)), where one observes that density enhancements in the gas coincide with the leading edges of rotating primary bars. Strong UIB emission along the leading edges of barred structures has also been observed by ISOCAM in other galaxies such as NGC 1097 (Roussel et al. (1999)) and Centaurus A (Mirabel et al. (1999)). Finally, we note that the UIB emission observed in NGC 1068 correlates well with the star formation spots revealed in H (Bland-Hawthorn & Sokolowski 1991a , 1991b ), as well as the Br emission which also peaks at the extremities of the stellar bar (Davies et al. (1998)).
The comparison between the UIB emission detected by ISOCAM and the distribution of molecular gas obtained with the IRAM interferometer (Schinnerer et al. (2000)) is presented in Figure 2d. The 12CO(1-0) emission clearly resolves the central region into two spiral arms extending from a molecular bar. In the South-Western knot, the molecular gas correlates well with the cold dust (see Figure 2 of Papadopoulos & Seaquist (1999)), and therefore slightly follows behind the MIR peak observed with ISOCAM. In the northern spiral structure, we also observe the same configuration with the MIR emission remaining enclosed near the extremity of the bar whereas the molecular gas and the cold dust are more extended along the arm. This implies that a large fraction of the molecular gas available for the star-formation process has not yet been converted into stars. The shift between the MIR and CO/FIR emission observed in both spiral arms may indicate, again, that the formation of young stars which heat the UIB emitting grains requires the presence of shocks and density enhancements rather than merely large amounts of gas. It is unclear from our data whether a bar of hot dust is present since the PSF of the AGN contaminates the central field of view where such a bar would be expected. Nevertheless, the comparison with the CO and FIR observations presented earlier, suggests that a possible hot dust bar could lead the stellar/FIR bar and it would appear at the place where shocks are being formed in the leading edge of the gaseous bar.
3.2 Spectral properties
3.2.1 The starburst energy distribution
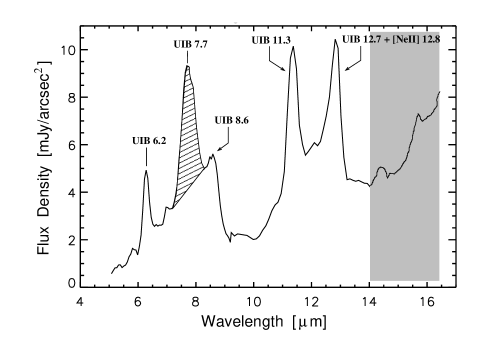
The MIR SEDs of the circumnuclear starburst regions show no spatial variation and the spectrum of the South-West peak is presented in Figure 3. It is typical of MIR spectra detected in star forming regions and can be decomposed into two main components (e.g. Tran (1998), Laurent et al. 2000a):
1) a very steeply rising continuum as a function of wavelength, which becomes important at 10–16 m. This is the most prominent characteristic of MIR spectra observed in galaxies showing evidence of intense starburst activity (Laurent et al. 2000a). It is attributed to the Very Small Grains (VSG, Désert et al. (1990)) and is produced in H ii regions, where dust is heated by massive hot young stars. It is thus considered as a good indicator to trace regions of massive star formation activity usually obscured in the visible (Mirabel et al. (1998)). An example of a MIR spectrum from a pure HII Galactic region can be seen in Cesarsky et al. 1996b .
2) the family of the Unidentified Infrared Bands, which are centered at 6.2, 7.7, 8.6, 11.3 and 12.7 m, and are clearly visible in our spectra. They are attributed to C=C and C–H vibrations in Polycyclic Aromatic Hydrocarbon molecules (PAH, Léger & Puget (1984), Alamandola et al. (1985)). These molecules are transiently heated by the stellar radiation field of massive stars and they are found in photo-dissociation regions (PDRs) surrounding HII regions. As a result, these UIB features are associated with star formation activity and they are typically found in MIR spectra of galaxies which form stars in either quiescent or more active manner (Helou et al. 2000).
Often, several ionic emission lines are also observed in the MIR spectra. The most ubiquitous one is the 12.8 m [NeII] line () which is present in almost all spectra of star forming regions, even though at the spectral resolution of ISOCAM (), it is blended with a UIB feature at 12.7 m. It has been noted that in most ISOCAM spectra of regions with low level of star formation activity, the intensity in the 12.7 m feature is smaller than the one at 11.3 m (Boulanger et al. (1996), Cesarsky et al. 1996c ). The fact that in NGC 1068 we observe the opposite is a strong indication that despite the blending the ionic line provides most of the flux. Another line, detected at 7 m, is attributed to the emission of the [ArII] line at 6.99 m which has been clearly identified in starburst galaxies with ISO-SWS (Sturm et al. (2000), Förster Schreiber et al. (2000)). It has a rather low ionizing potential () and as a consequence is produced essentially in starburst environments. The [ArII] line is seen only at weak levels in NGC 1068 by Lutz et al. (2000), possibly because of the dilution of the starburst spectral signature by the AGN, due to the extended size of the SWS aperture.
3.2.2 The nuclear Mid-Infrared spectrum
The 5–16 m spectrum of the nuclear region is displayed in Figure 4. The difference, compared to the MIR SED found in the starburst regions, is striking and its overall spectral shape is consistent with that found in other AGNs observed in the MIR (Lutz et al. (1998)). It is characterized by a strong continuum commonly attributed to the very hot dust which is present in the torus of molecular gas surrounding the nucleus as described in the unified scheme (see Krolik 1999, and references therein). Similarly rising continua can also be observed in nearby resolved HII regions (Contursi et al. (2000)). The MIR spectra of AGNs though are much flatter, and show an important continuum emission even at short wavelengths (3–6 m), because of dust particles heated to nearly their evaporation temperature (T 1000 K for silicates and T 1500 K for graphites) by the AGN. Since we know that NGC 1068 hosts an AGN, our spectrum thus confirms that a telltale sign of its presence is the high continuum level between 5 and 6 m (Laurent et al. 2000a).
Highly ionized emission lines such as [NeV] at 14.3 m () and [NeVI] at 7.6 m () are seen in our spectrum. These lines are clearly visible in the high spectral resolution spectrum obtained by ISO-SWS (Lutz et al. (2000)), which provides confidence that our detections are not due to other faint UIBs, often observed very close to these forbidden lines (Förster Schreiber et al. (2000)). Although the [NeV] and [NeVI] emission lines are also observed in supernova remnants (SNRs), the very weak MIR continuum associated with SNRs (Oliva et al. (1999)) can not account for the MIR spectrum of the nucleus of NGC 1068. The [NeIII] line is also clearly visible at 15.6 m, contrary to [NeII] at 12.8 m which is hardly detected. An effort was made to measure the [NeIII]/[NeII] ratio, which is often used to quantify the strength of a radiative field. However, subtracting the underlying continuum was not straightforward and only an upper limit could be estimated for the [NeII] intensity. We obtained a rather high [NeIII]/[NeII] ratio (), compared to what has been generally found in starburst galaxies ([NeIII]/[NeII] , Thornley et al. (2000)). This ratio is consistent with the value of 2.3 obtained with the ISO-SWS spectroscopic observations (Lutz et al. (2000)) and argues for a harder radiation field in the nucleus.
Other than the continuum and the Neon forbidden lines, we also note the absence of the family of UIBs in the nuclear MIR spectrum. This depletion is often interpreted as the destruction of PAH molecules by the extremely intense X-ray radiation field of the AGN (Voit (1991), Allain et al. (1996)). In principle, a comparison between the surface brightness of the starburst and the AGN can be carried out in order to estimate the level of the UIB contribution in the nuclear spectrum. However, as seen earlier, the noise associated with the AGN continuum is already higher than the average surface brightness of the star formation regions observed in the disk around the circumnuclear starburst (see Figure 2b). This prevents us from examining whether the lack of UIBs in the AGN spectrum is really due to a physical absence of the PAHs, or rather to a very low emission from the UIBs in the central regions which could originate from 1) foreground emission from the disk, 2) weak star formation or 3) the AGN. Nevertheless, even if the UIBs are present in the AGN spectrum at a faint level, their intensity is much lower than the UIB emission from the circumnuclear starburst presented in Figure 2b. Measuring the upper limit for UIB emission from a region of 15 ″15 ″ centered on the nucleus of the galaxy, we estimate that at least 95 of the UIB emission of NGC 1068 originates outside the nucleus. Thus the UIB features provide a reliable tracer of star formation unrelated to the AGN activity. This issue, regarding the possible destruction of UIBs in the central regions of the AGNs could be addressed in the future using more sensitive infrared spectrographs, such as the IRS on board SIRTF (Houck et al. (2000)).
4 Discussion
4.1 NGC 1068: A key object to distinguish an AGN from a starburst
The proximity of NGC 1068 coupled with the good spatial and spectral resolution of our data allows us to clearly disentangle both the spatial distribution and the spectral properties of the AGN from the emission of the surrounding starburst regions. Similar differences in spectral characteristics have already been reported in other nearby prototypes such as Centaurus A (Mirabel et al. (1999)) which, at a distance of 3.5 Mpc, is the closest radio galaxy to Earth. Such objects may be used as templates to distinguish AGN from starburst emission and evaluate the fraction of their respective contribution in spectra of more distant galaxies where the angular resolution is not sufficient to spatially separate the sources of the two components. Diagnostics based on this approach have been developed recently in the MIR by Genzel et al. (1998) and Laurent et al. (2000a). As we have already mentioned, the striking difference of the relative strength of UIBs observed in various radiation fields appears to be a canonical feature in the MIR SED in nearby objects: UIB emission is not detected in AGNs whereas it is very pronounced in regions of massive star formation. This is clearly demonstrated by the very distinct spatial separation between starburst regions and AGN visible in our 7.7 m map of NGC 1068 (see Figure 2).
The spatial resolution of ISOCAM does not allow us to study the distribution of the MIR emission near the extended NLR observed with high resolution MIR imaging (Braatz et al. (1993), Bock et al. (1998), Bock et al. 2000, Alloin et al. (2000)). Nevertheless, those high resolution images have shown that nearly 70 of the MIR flux originates from within a region of 1 ″ around the nucleus, which spatially coincides with the ionization cone. This implies that the integrated nuclear emission observed by ISOCAM in Figure 4 is produced essentially by hot dust located in the ionization cone and not in the torus. Hence one would expect that UIBs are also absent in those regions extending up to 70 pc (1 ″) from the nucleus. Moreover, the MIR SEDs of these regions rise from 7.9 to 10 m (Bock et al. 2000). This further suggests that in the range of 6–9 m no strong UIBs are present, since if they were the spectrum would have been flatter. Consequently, the radiation field produced by the AGN must be able to heat the dust at T150 K (Lumsden et al. (1999)) and to destroy UIBs at distances of several tens of parsecs from the nucleus as predicted by Voit (1992). Recently, MIR observations at 11 and 20 m of the central 6 ″6 ″ region of NGC 1068 revealed even more extended emission 4 ″ away from the AGN which follows the radio jet structure (Alloin et al. (2000)). This resolved MIR emission which extends up to 300 pc from the central region including the NLR and the torus (0.6 ″0.9 ″) contributes about 5 of the total MIR emission at 11.2 m and should contribute to the ISOCAM spectrum of the AGN, but only at faint levels. The observed MIR spectral differences between star forming regions and the NLR could be used in combination with the NLR emission line ratio proposed by Genzel et al.(1998) to identify AGNs with optically thick tori in MIR.
Another noticeable feature in the nuclear spectrum of NGC 1068 spectrum is the weak silicate absorption at 9.7 m. Based on a screen model (dust absorption law of Dudley & Wynn-Williams (1997)) applied to a power law of spectral index , the best fit of the nuclear spectrum leads to a visual extinction of only mag (see also Figure 10 of Laurent et al. 2000a). This is consistent with the value (; mag) inferred by Roche et al. (1984). One may wonder why the silicate absorption at 9.7 m is fairly weak in our spectrum ( mag) which is in rather sharp contrast with the strong extinction, mag, derived for the very hot dust ( 1000 K) seen through the obscuring torus using polarimetry techniques on NIR emission lines (Young et al. (1995)) and on Near and Mid-Infrared imaging (Lumsden et al. (1999)). This apparent contradiction already mentioned by several authors (e.g. Braatz et al. (1993), Efstathiou et al. (1995), Bock et al. (1998)) can be explained by the fact that we observe an extended MIR emission. High resolution images have shown that of the MIR flux originates from optically thin dust in this region which is unaffected by extinction and also dilutes the more obscured MIR emission from the torus. Recently, Bock et al. (2000) have clearly confirmed the absence of silicate absorption in the regions of the ionization cone regions whereas the unresolved nuclear region presents a clear dip at 10 m. Furthermore, Maiolino et al. (2000) have shown observational evidence that dust in the environment of the AGN should have different properties from the dust found in the Galactic diffuse interstellar medium. This dust would be characterized by a deficiency of small dust grains less than 3 m in size, such as the silicate particles responsible for the absorption feature at 9.7 m. The weakness of silicate absorption could then be explained in terms of both a small intrinsic absorption in the ionization cone, from where a large fraction of the MIR emission originates, as well as a smaller fraction of silicates in the dusty torus.
Since in NGC 1068, our data allow the separation of the starburst and AGN components, we can investigate the reliability of MIR activity diagnostic tools as a function of the amount of extinction affecting the AGN component. To do so, we apply an increasing extinction (in a screen model and assuming a standard Galactic extinction law) to the AGN component before combining it to the starburst component. As the extinction increases, one notes that not only does the silicate feature at 9.7 m become deeper, but also the continuum at shorter wavelengths (5–10 m) decreases significantly, becoming less important than the UIB emission (Laurent et al. 2000b ). According to the recent discovery by Maiolino et al. (2000), the depletion of silicate particles in the AGN torus will produce the same extinction to the continuum but without a deep silicate absorption feature. Since, as we mentioned in the previous section, this hot continuum is used as an AGN indicator, the total spectrum of the galaxy integrated over a region 40 ″ in diameter would show prominent UIB features, leading to an “apparent” starburst-classified galaxy. We note however that in the case of NGC 1068, the additional extinction should be applied only to the torus emission which contributes only 30% to the MIR nuclear emission. Therefore in this galaxy the hot dust emission would never be completely suppressed by a strong absorption in the torus.

A point which should be noted is that only the inner part of the galaxy (96 ″96 ″) has been observed with ISOCAM and that the MIR contribution of the outer disk is not taken properly into account (see Figure 1). If one were to use a B-band image of the galaxy (Schild et al. (1985)) as a tracer of star formation in the galaxy, nearly 60% of it occurs outside the area of 40 ″ in diameter, where the strong circumnuclear starburst revealed by the MIR band emission and the CO barred spiral pattern are found. Even though the radial scale length of the dust should be smaller than that of the blue light, since the MIR emission of the disk is very likely UIB rich (see Roussel et al. 1999, 2000), one would expect that the starburst characteristics in the MIR will increase if we take the whole galaxy into account. This is an important effect which should be considered when one extrapolates these results to distant galaxies (Laurent et al. (1999)). Only 20% of the total blue light is emitted from regions outside the area mapped by ISOCAM. Using the UIB map (Figure 2b) we compute that the fraction of 7.7 m emission from the region outside the inner starburst ring (40 ″ in diameter) compared to the total integrated UIB emission on the ISOCAM field of view is 53. A photometric calculation over the same areas on a B-band image gives 55 suggesting that the B-band light and the UIB emission have similar scale lengths in the disk of NGC 1068. Consequently we can use the blue light and the high signal to noise UIB measurements within the inner 40 ″ of the galaxy to apply a correction for the unaccounted 60% of the MIR flux from the spatially extented UIB emission (see Figure 4). Doing so, we have implicitly assumed that the extended disk emission of quiescent star formation does not differ strongly from the starburst emission along the ring observed with ISOCAM. Helou et al. (2000) have recently shown that among 28 galaxies with diverse properties (R(60/100)0.28-0.88), the MIR spectral shape from 5.7 to 11.6 m varies only weakly. Hence, our proportional correction factor applied to the starburst spectrum should give us a consistent result in the UIB region under 12 m even though some uncertainties are still present at longer wavelengths (12–16 m). One can further check the consistency of this photometric correction for the extended size of NGC 1068, by comparing the observed IRAS 12m flux density of the galaxy to the one we can calculate using the ISOCAM SED and the transmission of the IRAS 12m filter. The value we find using our CVF data is 36.8 Jy for the integrated emission before correction (40 ″ in diameter), and 43.6 Jy for the total integrated emission after correction (200 ″ in diameter). One notes that even though the correction of the starburst UIB emission is important (60), the overall MIR flux at 12m is largely dominated by the AGN and as result does not change by a large factor (see Figure 4). The value we find for the equivalent IRAS 12m filter after the correction is slightly more than the observed 12m IRAS flux density, which was quoted as 39.7 mJy in Moshir et al. (1990) and 36.1 Jy in Soifer et al. (1989) assuming 10 of flux uncertainty. This suggests that the correction of 60 (20% of the MIR flux is outside of the ISOCAM field of view) cannot be much larger at 8–15m and therefore the spectrum shown in Figure 4 represents a good estimate of the total MIR emission of NGC 1068.
4.2 AGN/starburst flux ratio
In NGC 1068, the total MIR spectrum integrated over a region of 40 ″ in diameter has been decomposed into the contribution of the unresolved AGN, and the residual which is attributed to the circumnuclear starburst emission. In Figure 4, we present the fraction of the MIR flux coming from the nuclear region with respect to the total MIR emission detected from that galaxy as a function of wavelength. One can notice that the nuclear region contributes over most of the ISOCAM MIR spectrum but it decreases to at the wavelengths corresponding to the PAH emission (note how the 6.2, 7.7, 8.6, 11.3 and 12.7 m features anti-correlate with the UIB emission of the startburst spectrum of Figure 3). Of course this fraction must be viewed as an upper limit since the disk of NGC 1068 is larger than the field we imaged in the MIR. However, in the spectrum corrected for this effect the AGN contribution still dominates the total emission but at a lower level. The highest starburst contribution to the continuum flux density (50%) occurs at 7.7 m. It is interesting to note that we can use this spectral behaviour to disentangle the AGN from the starburst contribution using only broad band imaging since the contrast of the AGN is enhanced at 5 m and 10 m compared to the starburst regions. Recently, Krabbe et al. (2000) have shown that ground-based MIR observations at 10.5 m (N-band) are reliable in identifying obscured AGNs previously only detected in hard X-rays (2-10 keV). The N-band filter is rather wide though (8 to 13 m) and integrates the UIBs at 8.6, 11.3 and part of the 7.7 m feature. If one is to find obscured AGNs using their MIR spectral properties, then using the M band filter (4.2-5.5 m) would be a better choice since at these wavelengths both the UIB contamination is relatively faint and the extinction caused by silicate particles is negligible. This dominance of the nucleus in the MIR contrasts strongly with what is observed in the optical and FIR wavelengths. Using the SCUBA data, we have estimated that the contribution of the nucleus does not represent more than 25% of the total emission at 450 m. Moreover, the spatial distribution of the SCUBA image shows that the cold dust emission is mainly associated with the starburst regions.
Finally, considerable efforts have been recently devoted to examine whether luminous infrared galaxies (LIGs) are mainly powered by AGN or starburst activity (see Sanders & Mirabel (1996) for a review). A recent spectroscopic MIR survey (Lutz et al. (1998)) has shown that starbursts dominate the energy budget in 85% of the objects below , whereas AGNs seem to be always present in ultraluminous galaxies with . At , 3 kpc corresponds to approximately 2 ″ ( km s-1 Mpc-1), and represents the typical scale of the circumnuclear starburst in NGC 1068. Thus, at higher redshifts, the angular resolution of ISO (as well as the one of SIRTF in the future) is not sufficient for a spatial AGN/starburst discrimination. However, deep ISOCAM imaging surveys of distant galaxies have revealed a significantly higher detection rate in the LW3 band (15 m) than in LW2 (6.75 m) and the nature of those objects resembles more that of starburst galaxies (Aussel et al. (1999), Elbaz et al. (1999)). It has been suggested though that this result may also be due to an extreme absorption since recent X-ray observations indicate that a large number of high redshift objects harbor active nuclei (Mushotzky et al. (2000)). As such, our MIR spectral imaging of the nearby prototypical Seyfert 2 galaxy NGC 1068, may be used as a template to investigate the observational bias on LIG deep counts at cosmological distances.
5 Conclusions
Based on the ISOCAM data presented in the previous sections we conclude that:
1) The MIR emission of the Seyfert 2 galaxy NGC 1068 is dominated at 75% by an unresolved point source, probably arising from hot dust heated by the radiation field from the AGN. The MIR spectrum associated with the AGN is characterized by a strong continuum and by a non-detection of Unidentified Infrared Bands (UIBs). Recent MIR high resolution imaging suggests that the intense and hard radiation from the AGN is probably able to heat the dust and destroy the PAHs not only in the inner torus but also at large distance in the narrow line region. The AGN MIR spectrum also exhibits [NeV] and [NeVI] emission lines, indicative of the hard radiation field.
2) More than 95 of the UIBs and at least 75 of the FIR emission at 450 m originate from a circumnuclear starburst ring of 3 kpc diameter and from the disk of the galaxy.
3) The UIB map, which traces the young massive stars, shows a spatial distribution which is in general agreement with the molecular gas and the cold dust emission. However, the two peaks of UIB emission observed in the circumnuclear arms of NGC 1068 display a small spatial shift of 5 ″ ( 360 pc) towards the leading edge of the arms at the extremity of the gaseous/stellar bar where shocks and density enhancements have been predicted by theoretical models of barred spiral galaxies.
Acknowledgements.
We are particularly grateful to L. Tacconi, and P. Papadopoulos, for providing their published data displayed in Figure 2, and to the valuable comments of an anonymous referee. IFM acknowledges partial support from CONICET, Argentina.References
- Alamandola et al. (1985) Alamandola L.J., Tielens A.G.G.M., Barker J.R., 1985, ApJ 290, L25
- Allain et al. (1996) Allain T., Leach S., Sedlmayr E., 1996, A&A 305, 602
- Alloin et al. (2000) Alloin D., Pantin E., Lagage P.O., Granato G.L., 2000, A&A, 363, 926
- Antonucci (1993) Antonucci R., 1993, ARA&A 31, 473
- Athanassoula & Bureau (1999) Athanassoula E., Bureau M., 1999, ApJ 622, 599
- Aussel et al. (1999) Aussel H., Cesarsky C., Elbaz D., Starck J.L., 1999, A&A 342, 313
- (7) Bland-Hawthorn J., Sokolowski J., 1991a, ApJ 375, 78
- (8) Bland-Hawthorn J., Sokolowski J., 1991b, PASP 103, 906
- Bock et al. (1998) Bock J.J., Marsh K.A., Ressler M.E. & Werner M.W., 1998, ApJ 504, L5
- (10) Bock J.J., Neugebauer G., Matthews K., et al., 2000, AJ 120, 2904
- Boulanger et al. (1996) Boulanger F., Reach W.T., Abergel A., et al., 1996, A&A 315, 325
- Braatz et al. (1993) Braatz J.A., Wilson A.S., Gezari D.Y., Varosi F., Beichman C.A., 1993, ApJ 409, L5
- Capetti et al. (1995) Capetti A., Macchetto F.D., Axon D.J., Sparks W., Boksenberg A., 1995, ApJ 452, L87
- (14) Cesarsky C., Abergel A., Agnese P., et al., 1996a, A&A 315, L32
- (15) Cesarsky D., Lequeux J., Abergel A., et al., 1996b, A&A 315, L309
- (16) Cesarsky D., Lequeux J., Abergel A., et al., 1996c, A&A 315, L305
- Charmandaris et al. (1999) Charmandaris V., Laurent O., Mirabel I.F., et al., 1999, Ap&SS 266, 99
- Contursi et al. (2000) Contursi A., Lequeux J., Cesarsky D., et al., 2000, A&A 362, 310
- Davies et al. (1998) Davies R.I., Sugai H., Ward M.J., 1998, MNRAS 300, 388
- Désert et al. (1990) Désert F.-X., Boulanger G., Puget J.-L., 1990, A&A 237, 215
- Dudley & Wynn-Williams (1997) Dudley C.C., Wynn-Williams C.G., 1997, ApJ 488, 720
- Efstathiou et al. (1995) Efstathiou A., Hough J.H., Young S., 1995, MNRAS 277, 1134
- Elbaz et al. (1999) Elbaz D., Cesarsky C., Fadda D., et al., 1999, A&A 351, L37
- Förster Schreiber et al. (2000) Förster Schreiber N.M., Laurent O., Sauvage M., et al., 2000, A&A, in preparation
- (25) Gallimore J.F., Baum S.A., O’Dea C.P., Brinks E., Pedlar A., 1996, ApJ 462, 740
- (26) Gallimore J.F., Baum S.A., O’Dea C.P., 1997, Nature 388, 852
- Granato et al. (1997) Granato G.L., Danese L., Franceschini A., 1997, ApJ 486, 147
- (28) Genzel R., Lutz D., Sturm E., et al., 1998, ApJ 498, 579
- Houck et al. (2000) Houck J.R. et al. 2000, in ISO beyond the Peaks: the 2nd workshop on analytical spectroscopy, in press (astro-ph/0003226)
- Helfer & Blitz (1995) Helfer T., Blitz L., 1995, ApJ 450, 90
- (31) Helou G., Lu N., Werner M., Malhotra S. & Silbermann N., 2000, ApJ 532, L21
- Iwasawa et al. (1997) Iwasawa K., Fabian A.C., Matt G., 1997, MNRAS 289, 443
- Kessler et al. (1996) Kessler M.F., Steinz J.A., Anderegg M.E., et al., 1996, A&A 315, L27
- (34) Krabbe A., Böker T. & Maiolino R., 2000, ApJ, submitted (astro-ph/0010119)
- (35) Krolik J., 1999, in Active Galactic Nuclei, Princeton Series in Astrophysics, Princeton University Press
- Laurent et al. (1999) Laurent O., Mirabel I.F., Charmandaris V., et al., 1999, in XIXth Moriond Astrophysics Meeting: Building the Galaxies: From the Primordial Univers to the Present., p. 79 (astro-ph/0005377)
- (37) Laurent O., Mirabel I.F., Charmandaris V., et al., 2000a, A&A 359, 887
- (38) Laurent O., Mirabel I.F., Charmandaris V., et al., 2000b, in ISO beyond the Peaks: the 2nd workshop on analytical spectroscopy, in press (astro-ph/0003288)
- Léger & Puget (1984) Léger A., Puget J.-L., 1984, A&A 137, L5
- Lumsden et al. (1999) Lumsden S., Moore T., Smith C., et al., 1999, MNRAS 303, 209
- Lutz et al. (1998) Lutz D., Spoon H.W.W., Rigopoulou D., Moorwood A.F.M., Genzel R., 1998, A&A 505, L103
- Lutz et al. (2000) Lutz D., Sturm E., Genzel R., et al., 2000, ApJ 536, 697L
- Macchetto et al. (1994) Macchetto F.D., Capetti A., Sparks W., Axon D.J., Boksenberg A., 1994, ApJ 435, L16
- Maiolino et al. (2000) Maiolino R., Marconi A., Salvati M., et al., 2000, A&A , in press (astro-ph/0010009)
- Mathis (1990) Mathis J.S., 1990, ARA&A 28, 37
- Matt et al. (1997) Matt G., Guainazzi M., Frontera F., et al., 1997, A&A 325, L13
- Mirabel et al. (1998) Mirabel I.F., Vigroux L., Charmandaris V., et al., 1998, A&A 333, L1
- Mirabel et al. (1999) Mirabel I.F., Laurent O., Sanders D.B., et al., 1999, A&A 341, 667
- Moshir et al. (1990) Moshir M., Kopan G., Convrow T., et al., Infrared Astronomical Satellite Catalogs, 1990, The Faint Source Catalog - Version2.
- Mushotzky et al. (2000) Mushotzky R.F., Cowie L.L., Barger A.J., Arnaud K. A., 2000, Nature 404, 459
- Muxlow et al. (1996) Muxlow T.W.B., Pedlar A., Holloway A.J., Gallimore J.F., Antonucci R.R.J., 1996, MNRAS 278, 854
-
(52)
Okumura K., Pérault M. & Longval Y., 1998, Technical report, “http://www.iso.vilspa.esa.es/users/expl
_lib/CAM_list.html: Ghosts in ISOCAM images” - Oliva et al. (1999) Oliva E., Moorwood A.F.M., Drapatz S., Lutz D., Sturm E., 1999, A&A 343, 943
- Papadopoulos & Seaquist (1999) Papadopoulos P.P., Seaquist E.R., 1999, ApJ 514, L95
- Pier & Krolik (1992) Pier E., Krolik J.H., 1992, ApJ 401, 99
- Rieke & Low (1975) Rieke G.H., Low F.J., 1975, ApJ 199, L13
- Rigopoulou et al. (1999) Rigopoulou D., Spoon H.W.W., Genzel R., et al., 1999, AJ 118, 2625
- Roche et al. (1984) Roche P., Aitken D., Phillips M. & Whitmore B., 1984, MNRAS 207, 35
- Rouan et al. (1998) Rouan D., Rigaut F., Alloin D., et al., 1998, A&A 379, 687
- Roussel et al. (1999) Roussel H., Vigroux L., Sauvage M., et al., 1999, in The Universe as seen by ISO, ESA-SP 427, March 1999, p. 957
- Roussel et al. (2000) Roussel H., Vigroux L., Sauvage M., et al., 2000, A&A, in preparation
- Sanders & Mirabel (1996) Sanders D.B., Mirabel I.F., 1996, ARA&A 34, 749
- Schild et al. (1985) Schild R., Tresch-Fienberg R., Hushra J, 1985, AJ 90, 441
- Schinnerer et al. (2000) Schinnerer E., Eckart A., Tacconi L.J., et al., 2000, ApJ 533, 850
- Scoville et al. (1988) Scoville N., Matthews K., Carico D., Sanders D., 1988, ApJ 327, L61
- Soifer et al. (1990) Soifer B.T., Boehmer L., Neugebauer G. & Sanders D.B., AJ 98, 766
- Starck et al. (1999) Starck J.L., Abergel A., Aussel H., et al., 1999, A&AS 134, 135
- Sturm et al. (2000) Sturm E., Lutz D., Tran D., et al., 2000, A&A 358, 481
- Tacconi et al. (1994) Tacconi L.J., Genzel R., Blietz M., et al., 1994, ApJ 426, L77
- (70) Telesco C.M., Becklin E.E., Wynn-Williams C.G., 1984, ApJ 282, 427
- (71) Telesco C.M., Decher R., 1988, ApJ 334, 573
- Thornley et al. (2000) Thornley M.D., Förster Schreiber N.M., Lutz D., et al., 2000, ApJ 539, 641
- Thronson et al. (1989) Thronson H., Tacconi L., Kenney J., et al., 1989, ApJ 343, 158
- Tran (1998) Tran D., 1998, PhD thesis, University of Paris XI, France
- Tully (1988) Tully R.B., 1988, Nearby Galaxies Catalogue. Cambridge Univ. Press, New York
- Voit (1991) Voit M., 1991, ApJ 379,122
- Voit (1992) Voit M., 1992, MNRAS 258, 841
- Young et al. (1995) Young S., Hough J.H., Axon D., Bailey J., Ward M., 1995, MNRAS 272, 513