1]Southampton University, UK 2]Centre d’Etude Spatiale des Rayonnements, France
Flat-Fielding BATSE Occultation Data for use in a Hard X-Ray All Sky Survey
Abstract
The BATSE mission aboard CGRO can be used to observe hard X-ray sources by using the Earth occultation method. This method relies on measuring a step in the count rate profile in each BATSE detector as a source rises above or sets below the Earth’s limb. A major problem in determining the step sizes (and hence the flux) is in extracting the steps from the varying background. A technique for flat-fielding the response of -ray detectors has been developed at Southampton. The technique uses a dynamic Monte-Carlo model to simulate the dominant components of the gamma-ray background encountered by the experiment at any point in its orbit. A maximum likelihood imaging method is also being developed that will be used to make a sky survey with all 9 years of the BATSE CONTINUOUS data set in the 20 - 500 keV range. An all sky map of 25 - 35 keV emission has been made using 60 days of data and has a 3 flux sensitivity of 14 mCrab.
keywords:
BATSE; Hard X-Rays; Survey1 Introduction
The Burst and Transient Source Experiment (BATSE) consisted of eight 2025 cm2 NaI(Tl) Large Area scintillation Detectors (LADs), sensitive from 20 keV - 2 MeV. BATSE monitored the whole sky continuously from April 1991 - June 2000 as an experiment aboard the Compton Gamma-Ray Observatory (CGRO). The continuous whole sky exposure makes BATSE an ideal facility for the production of the first all sky hard X-ray survey since HEAO A-4 of 1977-1978 (Levine et al. (1984)). A survey performed with BATSE will not only be the first in the few hundreds of keV band but will have the ability to detect weak persistent sources and continuously monitor variable and transient sources. The BATSE CONTINUOUS data set contains usable count rates in 15 energy channels recorded in 2.048 s time bins.
2 BATSE Earth Occultation Observations
BATSE was developed primarily to detect and locate -ray bursts. The individual BATSE detectors have no positional sensitivity, hence to locate the position of a source of -rays the relative count rates from several detectors are combined, along with the point spread function of each detector (Pendleton et al. (1999)). Prior to launch however it was realised that that the instrument could also be used as a sensitive all sky monitor of point like -ray sources by using the Earth to modulate the flux at the CGRO orbital period (Paciesas et al. (1985)). Sharp steps are seen in the count rate profile of the detectors as point sources rise and set over the Earth’s limb, the size of which give the source flux (Harmon et al. (2000)). About 70% of the whole sky is occulted twice per 90 minute orbit. The precession of the orbit is such that the whole sky undergoes occultation every 53 days. The key to measuring the flux values correctly is in accurately determining the varying background count rate. Ling et al. (2000) have recently published a catalogue of 34 moderately strong -ray sources observed with BATSE during the first three phases of the CGRO mission (May 1991 through October 1994). They use an empirical fit to find the background, which is hampered by systematic errors and large computation time (Harmon et al. (2000)), and make no attempt to image the sky.
3 Southampton BATSE Background Model
The BATSE model is based on The INTEGRAL Mass Model (TIMM), which is a GEANT based Monte-Carlo simulation code devloped at Southampton to investigate the performance of the instruments aboard the INTEGRAL mission pre-launch (Lei et al. (1999)). It considers three components to the background; cosmic rays, cosmic diffuse gamma rays and -rays from interactions of cosmic rays in the Earth’s atmosphere. These same techniques are easily extended to other experiments and has been proposed for use with the BAT burst monitor aboard SWIFT.
3.1 Dynamic Generation of Background Components
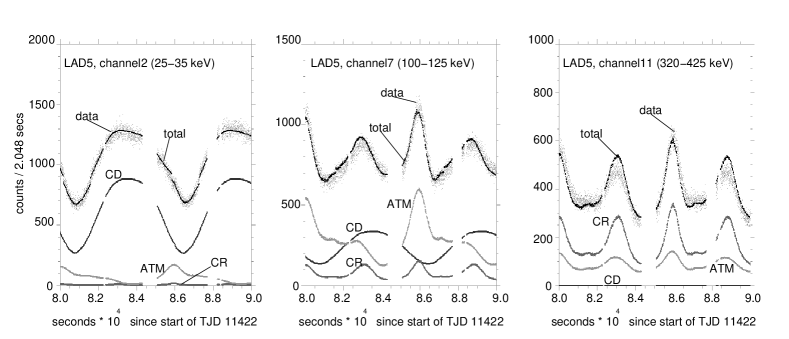
With BATSE we are interested in the dynamical behaviour of the background within the CGRO orbit. The background is a complicated function of the pointing of the detectors, the position of CGRO in the Earth’s magnetic field and its irradiation history. A novel two step method has been developed to account for the background at any point in the CGRO lifetime. Firstly CGRO is assumed to be in deep space without any interference from Earth. Here it receives isotropic fluxes of cosmic rays, cosmic diffuse -rays and atmospheric -rays and a database, containing information about all the events interacting in the BATSE modules is created. The second stage filters the database with the physical criterea corresponding to CGRO’s position and pointing. This information is used to create the background for any orbital position and pointing. The component due to the atmospheric -rays is found by scaling and sampling of the detector pointings and finally the radio-activation of the detector materials is simulated. The first stage is computationally very intensive, but only needs to be done once for the whole lifetime of the experiment. To compute the second stage of the background simulation requires only a few hours for all of the eight BATSE modules for one day. Figure 1 shows the excellent agreement between the modelled data and the count rate profile in the BATSE LADs for three energy channels.
| 3 flux | Angular resolution | |
|---|---|---|
| (bins) | sensitivity (mCrab) | (HWHM∘) |
| 5 | 270 | 0.5 |
| 20 | 199 | 0.9 |
| 40 | 88 | 2.4 |
| 60 | 77 | 2.9 |
| 120 | 74 | 5.3 |
4 Production of Sky Images
Sky images are produced using a maximum likelihood method originally developed by J. Knödlseder at CESR (Knödlseder (1999)). This method has been adapted at Southampton for use with the flat-fielded CONTINUOUS data and developed into the LIMBO code (Likelihood Imaging Method for BATSE Occultation).
4.1 Flat-Fielding of Data
The data is flat-fielded by subtracting the modelled background and the result passed to a simple differential filter of width bins, given by
| (1) |
The filtered data, , is transformed from a count rate containing occultation steps to a set of occultation peaks. A square step at bin will be transfromed to a triangular peak of width . The choice of has implications for the sensitivity and angular resolution of the imaging technique; larger will give a more significant occultation peak and improve sensitivity, smaller returns less significant but sharper peaks that will lead to better angular resolution. The gain in sensitivity from increasing begins to level out as the steps from other sources enter the filter. Table 1 summarises the sensitivity and angular resolution obtained from images made from one day’s observation of Cygnus X-1 using energy channel 2 (25 - 35 keV). The creation of images is discussed further in section 4.2. The raw BATSE data contains occasional gaps where, for example, the instrument is turned off during passage through the South Atlantic Anomaly (SAA) or where contact is lost between CGRO and telemetry relay satellites. Left untreated the gaps cause large artificial peaks in the data near each gap so a linear interpolation is used to fill the gaps in the background subtracted data. The gap data is not used further in the analysis.
4.2 Maximum Likelihood Imaging
The imaging method used here differs from the Radon transform method used by other groups (e.g. Zhang et al. (1993)) in that it produces the results of statistical tests for emission at each point in the map rather than a deconvolution of the data. The occultation peak dataset, , is fitted to a response vector, , which describes the expected position, shape and amplitude of the peaks as a function of source strength and position on the sky. The fit determines a scaling factor of the response vector, which is proportional to the flux received from each point in the sky for all eight LADs. The scaling factor, , is given by
| (2) |
where is the statistical error on . A maximum likelihood ratio test is used to determine the significance of the flux detection and returns a skymap for a given grid of source positions (Cash (1976)). The maximum likelihood ratio, , is distributed as with degrees of freedom. It is calculated from the difference , the statistics for the null (no source is fitted to ) and source (a source with free strength is fitted to ) hypotheses respectively, where
| (3) | |||||
| (4) |
When searching for a known source and hence the detection significance, in gaussian , is given by . For searches of new sources of -rays (Knödlseder (1999)). The image is built up from the superposition of the arcs caused by the occultation of point sources by the Earth’s limb. The angular resolution perpendicular to the limb depends on , the angle at the geocentre between the orbital plane and the source. Sources seen with 45∘ yield good information since the rising and setting limbs are almost orthogonal.
The maximum likelihood method has an advantage over the Radon transform method in that there is no limit to the size of map that can be generated. The Radon transform is not well behaved for regions much larger than 2020∘ (Harmon et al. (2000)). Likelihood maps can be made for short periods of time and then added together to increase source significance whilst retaining the ability to investigate variability on short timescales. The total likelihood ratio from a total of individual daily maps, indexed by , is where
| (5) |
and and are the daily values of the numerator and denominator of equation 2 respectively. The quantity is the total flux for all days being considered, i.e. .
5 Results
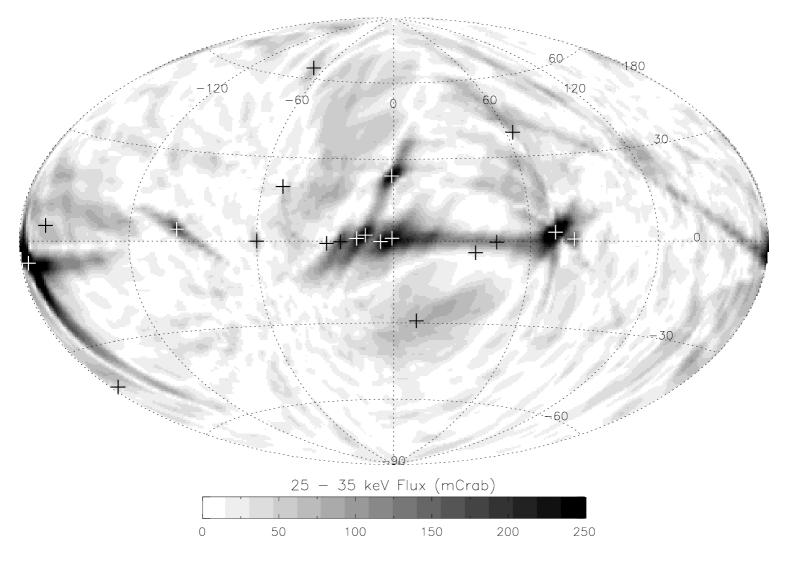
Figure 2 shows the total likelihood map for the whole sky created from channel 2 CONTINUOUS data for 60 days between Truncated Julian Days (TJD) 10840 - 10900. The energy calibration of BATSE channel 2 is such that the range of photon energies it detects is approximately constant at 9 keV with a lower limit of 255 keV. The Crab, Cygnus X-1 and several Galactic Centre sources have been identified along with other faint sources as summarized in table 2. Some artifacts remain around the brighter sources, which we aim to reduce by removing the brighter sources iteratively. The 3 flux sensitivity of the map is 14 mCrab. The map was created using a 22∘ sky grid and . Table 1 suggests that it would be worthwhile increasing the grid resolution to 0.50.5∘, which would increase the computation time and disk space requirements by a factor of 8. The current maps are 600 kB in size per day and energy channel and LIMBO takes 45 mins to run on a PentiumIII Linux workstation, although the code is not fully optimised as yet. On the basis of this preliminary analysis LIMBO shows a lot of promise as a method of surveying the sky. We will continue to develop LIMBO with the aim of creating a database of daily maps in each energy channel for the entire BATSE observation. Sources found in the surveys will be studied in more detail for location, variability and spectroscopy (see also presentations by Dean and Westmore at this meeting).
| Source | Peak | Flux | Peak | Distance |
|---|---|---|---|---|
| Name | (mCrab) | (l,b) | (degs) | |
| Crab | 212 | 1000 | ( -177, -6) | 1.58 |
| CygX-1 | 154 | 727 | ( 71, 4) | 0.99 |
| ScoX-1 | 71 | 338 | ( -1, 24) | 0.24 |
| 4U1700 | 67 | 319 | ( -13, 2) | 0.77 |
| 1E1740 | 62 | 294 | ( -1, 0) | 1.05 |
| OAO1657 | 60 | 282 | ( -15, 2) | 1.44 |
| GX354+0 | 58 | 273 | ( -5, 0) | 0.72 |
| VelaX-1 | 49 | 231 | ( -99, 4) | 2.06 |
| 4U1630-47 | 40 | 188 | ( -25, 0) | 1.93 |
| CygX-3 | 38 | 181 | ( 77, 0) | 2.92 |
| GRS1915 | 28 | 132 | ( 43, 0) | 1.94 |
| AqlX-1 | 20 | 94 | ( 35, -2) | 2.26 |
| GX301-2 | 20 | 93 | ( -61, 0) | 1.10 |
| Mrk501 | 18 | 84 | ( 61, 40) | 2.82 |
| PKS2005 | 17 | 80 | ( 11, -30) | 0.81 |
| Geminga | 16 | 77 | ( -163, 2) | 2.94 |
| 4U1608 | 16 | 77 | ( -29, -2) | 1.15 |
| CenA | 14 | 67 | ( -49, 18) | 2.06 |
| 3C273 | 16 | 74 | ( -69, 62) | 2.58 |
| HR1099 | 14 | 65 | ( -175, -40) | 1.57 |
References
- Cash (1976) Cash W., 1976, A&A, 52, 307
- Harmon et al. (2000) Harmon B.A. et al. 2000, submitted to Astrophysical Journal
- Knödlseder (1999) Knödlseder J. 1999, CESR internal report
- Lei et al. (1999) Lei F. et al. 1999, Astrophysical Letters and Communications, 39, 373
- Levine et al. (1984) Levine A.M. et al. 1984, ApJS, 54, 581
- Ling et al. (2000) Ling J.C. et al. 2000, ApJS, 127, 79
- Paciesas et al. (1985) Paciesas W.S. et al. 1985, in Proc. 19th ICRC, La Jolla, 3, 351
- Pendleton et al. (1999) Pendleton G.N. et al. 1999, ApJ, 512, 362
- Zhang et al. (1993) Zhang S.N. et al. 1993, Nature, 366, 245