GALACTIC CHEMICAL ABUNDANCES AT I: First Results from the Echellette Spectrograph and Imager
Abstract
We present the first results from an ongoing survey to discover and measure the metallicity of damped Ly systems with the Echellette Spectrograph and Imager (ESI) on the Keck II telescope. Our motivation arises from a recent study on the damped Ly systems suggesting only mild evolution in the cosmic metallicity from to 4. The Echellette Spectrograph and Imager, which provides two complementary spectroscopic modes, is the ideal instrument for a damped Ly survey. We describe our observing strategy and report on the discovery and analysis of 5 new damped Ly systems acquired in a single night of observing. These observations further support the principal conclusions of the previous study: (1) the cosmic metallicity in neutral gas inferred from the damped Ly systems does not evolve significantly from to 4; (2) the unweighted metallicity exhibits a statistically significant decrease with increasing redshift; and (3) not a single damped Ly system has a metallicity below Fe/H . We discuss the implications of these results and comment on recent theoretical studies which attempt to explain the observations.
Accepted to the Astrophysical Journal December 22, 2000
1 INTRODUCTION
Determining the chemical enrichment history places fundamental constraints on the processes of galaxy formation. Both the stellar and gas metallicity are diagnostics of a number of physical processes including: the star formation rate, metal transport, the initial mass function, and metal production yields. For several decades, researchers have investigated the chemical enrichment history of the universe by examining in great detail the chemical evolution of our Galaxy (Chiosi, 1980; Chiappini, Matteucci, & Gratton, 1997; Boissier & Prantzos, 1999). Specifically, one examines the age-metallicity relation of various Galactic stellar populations and extrapolates these results to the universe as a whole under the assumption that our Galaxy is not overly peculiar. This extrapolation not withstanding, the approach is limited by the large uncertainties in measuring stellar ages and metallicities, particularly in the most metal-poor and presumably oldest stars (Edvardsson et al., 1993). While it is possible to obtain spectroscopy of individual stars for several nearby galaxies (e.g. Smecker-Hane & McWilliam, 1999; Shetrone, Cote, & Sargent, 2000), metallicities of external galaxies are usually determined by examining spectra of the integrated light (Trager et al., 2000). Unfortunately this approach is severely limited by the well-known age, metallicity, dust degeneracy and pursuing metallicity measurements beyond the local universe is extremely challenging. At high redshift (), Pettini et al. (2000) have introduced a method for estimating the metallicity of the Lyman break galaxies, but unfortunately they have applied it to only a single galaxy as the analysis requires a relatively bright galaxy in order to obtain a moderate-resolution, high signal-to-noise spectrum.
Quasar absorption line studies, which examine the gas properties of galaxies, allow an independent and complementary method for studying chemical evolution. In particular, studies of the damped Ly systems – neutral hydrogen gas layers with HI column densities in excess of – provide a measure of the mean metallicity of the universe in neutral gas from = 0 to 5 (Pettini et al., 1994, 1997; Pei & Fall, 1995; Prochaska & Wolfe, 2000). Because the damped Ly systems are detected in absorption they are believed to present a more representative sample of protogalaxies at high redshift (i.e. probing the entire galactic mass function) than galaxies observed in emission (Kauffmann, 1996; Gardner et al., 1997; Mo, Mao, & White, 1998, e.g.). With observations of the damped Ly systems, one directly studies the mean galactic enrichment as a function of time and can test scenarios of chemical enrichment (e.g. Pei et al., 1999). Furthermore, measurements of the relative abundances of elements like Si, Zn, Mn, Fe (Lu et al., 1996; Prochaska & Wolfe, 1996, 1997, 1999) provide an investigation into the star formation rate and initial mass function of these protogalaxies.
| QSO | [Fe/H] | Ion | |||||
|---|---|---|---|---|---|---|---|
| PSS0808+52 | 4.45 | 18.82 | 3.114 | Fe II 2374 | |||
| PSS0957+33 | 4.25 | 17.59 | 3.279 | Fe II 2344 | |||
| 4.178 | Fe II 1608 | ||||||
| PSS1248+31 | 4.35 | 18.9 | 3.696 | Fe II 1608 | |||
| PSS1432+39 | 4.28 | 18.6 | 3.272 | Ni II 1751, Cr II 2056 |
In a recent paper (Prochaska & Wolfe 2000; hereafter PW00) we presented evidence that the mean metallicity of the damped Ly systems exhibits no significant evolution from to 4. This result is in contradiction with the majority of chemical evolution models all of which significantly underpredict the observed enrichment at (e.g. Edmunds & Phillips 1997; Pei et al. 1999; Mathlin et al. 2000; but see Cen & Ostriker 1999; Prantzos & Boissier 2000 as discussed below). For this epoch, however, the observational result was based on [Fe/H] measurements of only protogalaxies and therefore suffered from small number statistics. Observationally, it is very expensive to analyze damped Ly systems with high resolution spectrographs (e.g. HIRES, UVES) because the majority of known damped Ly systems lie towards faint quasars. To address the uncertainty arising from the small sample size at , we have initiated a program using the new Echellette Spectrograph and Imager on the Keck II telescope. The project takes advantage of the unique capabilities of this instrument. The combination of high efficiency, moderately high resolution (), and complete wavelength coverage from Å provide an ideal match to a survey of damped Ly systems. In this Letter we present our first results from the survey, specifically metallicity measurements for five damped Ly systems discovered during one night at Keck Observatory. We compare these measurements against the results from PW00 and discuss the implications for chemical enrichment in the early universe. In a future paper, we will present the complete set of observations and investigate chemical abundance patterns of elements like Si, Fe, Al, and Ni.
2 OBSERVATIONS AND REDUCTION
The Echellette Spectrograph and Imager (ESI; PI: Joe Miller, UCSC) is mounted at the cassegrain focus of the W.M. Keck II 10m telescope. The instrument has two spectrographic modes: (1) a prism-dispersed low resolution mode with resolution decreasing linearly from at 3900 Å to at ; and (2) a multi-order echellette mode with over the entire spectrum ( km/s/pix). Both modes have continuous wavelength coverage from Å.
We observed the 4 quasars listed in Table 1 on the night of April 7, 2000. All of them were drawn from the Palomar Sky Survey (Djorgovski et al., 1998) kindly made public by G. Djorgovski and collaborators111http://www.astro.caltech.edu/george/dposs/index.html. At the time of the observations, none of the quasars were known to exhibit damped Ly systems. We acquired 400s exposures of each quasar in the low dispersion mode with a slit and reduced the data in real time with the IRAF task apall and related tasks. We then obtained two or three 1200s exposures in the echellette mode (0.75′′ slit lending resolution FWHM km/s) of those quasars with promising damped Ly candidates; i.e., a Ly line with rest equivalent width Å (e.g. Wolfe et al., 1995). In this fashion we were able to identify a significant number of new damped Ly systems and measure their metallicity in the same night of observing. Because the quasars were previously unobserved at a resolution sufficient for a damped Ly study, this survey will also help improve the statistics of the cosmological neutral gas density at (Storrie-Lombardi & Wolfe, 2000; Peroux et al., 2000).
We reduced the echellette observations with the echelle suite of IRAF tasks, in part following a recipe developed by S. Castro222http://www.astro.caltech.edu/smc/esi.html. After subtracting the overscan and dividing by a normalized quartz flat, we traced the curved orders of a bright standard star, determined the offset for each faint object, and extracted the data with apall. We then extracted a CuArHgXe arc-lamp spectrum for each quasar and determined a wavelength solution using ecidentify. Finally, the data were flux calibrated by correcting the observed flux to our observations of the spectrophotometric standard Hiltner 600 (Massey & Cronwall, 1990), and normalized to unit flux using a package similar to the IRAF task continuum. In the future, we intend to reduce the data with a modified version of the makee packaged developed by T. Barlow for HIRES echelle data333http://spider.ipac.caltech.edu/staff/tab/makee/. For most of the observations, the S/N per pixel is redward of Ly emission decreasing to at Å and Å.
3 METALLICITY ANALYSIS AND RESULTS
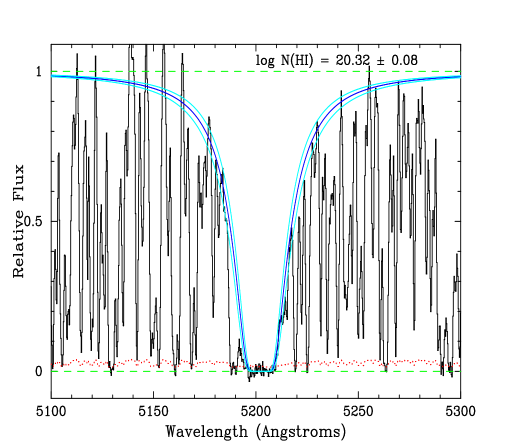
We searched each of the normalized echellette spectra for potential damped Ly systems and fitted the Ly profiles with Voigt profiles to estimate their HI column densities . At a resolution , the typical Ly forest cloud is just resolved and we could account for the majority of contaminating features in the wings of the Ly profile. As an example, Figure 1 presents the Ly profile for the damped Ly system at towards PSS0957+33. The dark curve overplotted on the data is a Voigt profile with and the light grey lines represent a conservative error estimate of dex. The values and errors for each of the damped Ly systems are listed in column 5 of Table 1.
With a FWHM resolution of km/s, we had concerns that the absorption lines from some systems would be unresolved and our analysis would underestimate the metallicity. To quantify this potential systematic error, we analyzed an ESI echellette spectrum of the very bright quasar PH957. There is a known damped Ly system at towards PH957 with previous HIRES observations (Wolfe et al., 1994; Prochaska & Wolfe, 1999) which reveal that the metal-line profiles exhibit the majority of absorption within a 20 km/s interval, i.e. well within the ESI resolution. We compared the column density measurements determined from the apparent optical depth method (Savage and Sembach, 1991) from 10 absorption lines observed with both ESI and HIRES. For absorption lines with Å all of the column density values agreed to within the statistical error and were within . Even several obviously saturated profiles yielded column densities to within 0.2 dex. Therefore, we expect that transitions with Å will yield column density measurements free of saturation and we have focused on these transitions in our analysis.
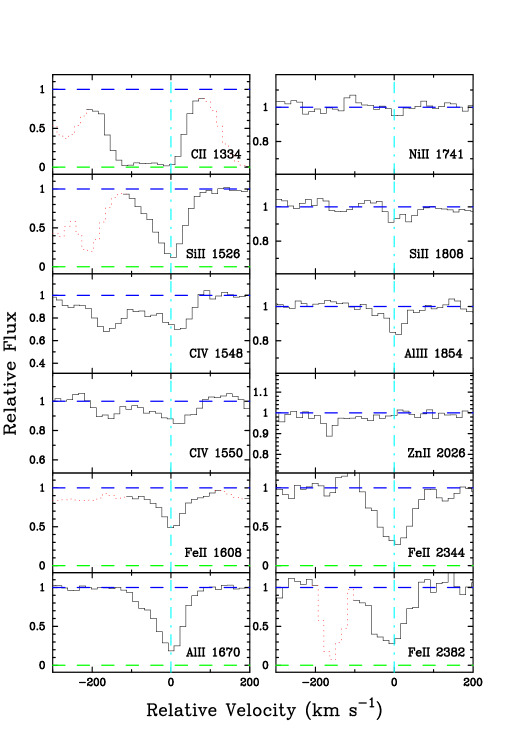
Depending on the absorption redshift, the HI column density, and the metallicity of the damped system, the absorber will exhibit various metal-line profiles which can be analyzed to assess its metallicity (e.g. Figure 2). Ideally, we measured an Fe+ column density for each system from the Fe II 1608,1611,2344,2382 transitions. These measurements were checked for consistency against the , , observations by considering the relative abundance patterns typically observed for the damped Ly systems (Lu et al., 1996; Prochaska & Wolfe, 1999). In one case (PSS1432+39) all of the observed Fe II profiles were blended with significant absorption features or too weak/strong to provide a reliable column density measurement. To estimate the metallicity we relied on the observations of other ions, in particular Ni+ and Cr+ which show very nearly solar relative abundances (i.e. [Ni/Fe]=0) in nearly every damped Ly system. For this system, we adopted an additional 0.05 dex error. The metallicities and errors are presented in Table 1 for each system. We also indicate the most important metal-line transition(s) used in determining the metallicity.
Because we have relaxed our definition of the Fe metallicity to include systems with observed Ni, Al, or Cr transitions, we now include several other systems from our echelle database (BR001915, BRI134603; Prochaska & Wolfe 1999). Following our practice for the ESI observations, we adopt an additional 0.05 dex error for these metallicities. We have also revised our [Fe/H] estimates for the systems towards Q1215+33 and Q000026 as the former system had an [Fe/H] value based on a saturated Fe II 1608 profile and we believe the Fe abundance for Q000026 is more reliably given by [Ni/H] which agrees well with the Fe abundance derived by Molaro et al. (2000). Finally, we also include two new observations from the literature: the UVES observations of J03074945 (Dessagues-Zavadsky et al., 2000) and the measurement the damped Ly system towards Q0201+11 (Ellison et al., 2000). Table 2 summarizes all of the echelle measurements. Even with our relaxed criteria, we exclude a single damped Ly system at towards BRI095104 for which we have only detected Si II transitions, [Si/H] (Prochaska & Wolfe, 1999). Because this system exhibits a low HI column density, its inclusion would not significantly affect any of the following analysis except for the observed scatter in [Fe/H] at .
| QSO | [Fe/H] | RefeeKey to References – 1: Prochaska & Wolfe (1999); 2: Prochaska & Wolfe (1997); 3: Lu et al. (1996); 4: Lu et al. (1997); 5: Prochaska & Wolfe (1996); 6: Prochaska & Wolfe (2000); 7: Ellison et al. (2000); 8: Molaro et al. (2000); 9: Dessagues-Zavadsky et al. (2000) | ||
|---|---|---|---|---|
| Q1331+17 | 1.776 | 21.18 | 1 | |
| Q2230+02 | 1.864 | 20.85 | 1 | |
| Q2206-19 | 1.920 | 20.65 | 2 | |
| Q1215+33aa[Fe/H] estimated from Ni | 1.999 | 20.95 | 1 | |
| Q0458-02 | 1.999 | 21.65 | 1 | |
| Q2231-002 | 2.066 | 20.56 | 1 | |
| Q2206-19 | 2.076 | 20.43 | 2 | |
| Q2359-02 | 2.095 | 20.70 | 1 | |
| Q0149+33 | 2.141 | 20.50 | 1 | |
| Q0528-2505bb[Fe/H] estimated from Cr | 2.141 | 20.70 | 3 | |
| Q2359-02 | 2.154 | 20.30 | 1 | |
| Q0216+08 | 2.239 | 20.45 | 3 | |
| Q2348-14 | 2.279 | 20.56 | 1 | |
| PH957 | 2.309 | 21.40 | 1 | |
| Q0841+12aa[Fe/H] estimated from Ni | 2.375 | 20.95 | 1 | |
| Q2343+12 | 2.431 | 20.34 | 4 | |
| Q0201+36 | 2.463 | 20.38 | 5 | |
| Q1223+17ddNote the tabulated metallicity for the system towards Q1223+17 is erroneous in PW00. The correct value, however, was used in all of the figures and analysis of PW00. | 2.466 | 21.50 | 6 | |
| Q0841+12 | 2.476 | 20.78 | 1 | |
| Q2344+12 | 2.538 | 20.36 | 4 | |
| Q1759+75 | 2.625 | 20.80 | 1 | |
| Q1425+6039 | 2.827 | 20.30 | 3 | |
| Q0347-38 | 3.025 | 20.80 | 1 | |
| Q1055+46 | 3.317 | 20.34 | 4 | |
| Q0201+11 | 3.386 | 21.26 | 7 | |
| Q0000-2619aa[Fe/H] estimated from Ni | 3.390 | 21.41 | 8 | |
| BR0019-15aa[Fe/H] estimated from Ni | 3.439 | 20.92 | 1 | |
| BRI1108-07 | 3.608 | 20.50 | 6 | |
| BRI1346-03cc[Fe/H] estimated from Al | 3.736 | 20.72 | 1 | |
| BRI0951-04 | 3.857 | 20.60 | 1 | |
| BR2237-0607 | 4.080 | 20.52 | 3 | |
| BRI0952-01 | 4.203 | 20.55 | 6 | |
| PSS1443+27 | 4.226 | 20.80 | 6 | |
| BR1202-07 | 4.383 | 20.60 | 3 | |
| J0307-4945 | 4.466 | 20.67 | 9 |
4 DISCUSSION
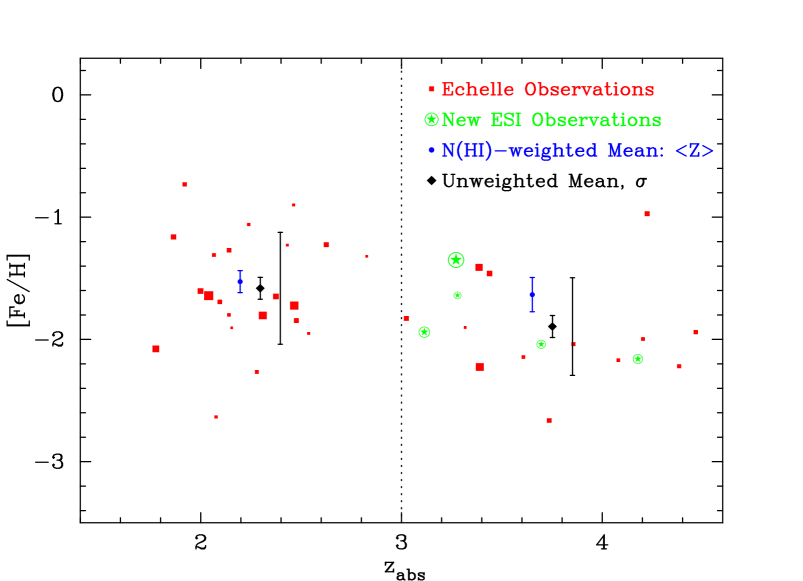
Figure 3 presents the [Fe/H] metallicity measurements for against absorption redshift444This redshift corresponds to the optical atmospheric cutoff for the detection of the Ly transition. The open squares are measurements derived from echelle observations. and the new ESI measurements are presented as stars. For all data points, the size of the data points is linear with the log of the HI column density. Following PW00, we plot the column density weighted mean metallicity for two epochs: and with median , . We have calculated a statistical error in based on standard error propagation and estimated the uncertainty due to sample variance with a bootstrap analysis (PW00). We find (statistical error) with a bootstrap error of 0.09 dex and with bootstrap error 0.12 dex. Similarly the unweighted logarithmic means for the two samples with bootstrap errors only are and . Finally, the scatter in the two samples is and each with a bootstrap error of 0.07. Comparing the three statistical moments for the two epochs, we note the values for the sample are in excellent agreement with those from PW00 (there is no change for the sample). As discussed in PW00, there is no significant evolution in yet a decrease in and . Performing a Student’s t-test and the F-test on the and statistics which test for the likelihood that two the samples have a common mean and variance respectively, we find that they are inconsistent with one another at the 97 and 43 c.l. We are now confident that the unweighted mean (i.e. the metallicity of any given damped system) is decreasing with increasing redshift, but less certain that the scatter in the [Fe/H] distribution decreases at high .
The additional 7 systems considered here nearly double the total HI content of the sample and the new total () well exceeds the value measured for any single system. Therefore, the results are more robust to addition of individual systems. For example, since the publication of PW00 we have received criticism that the results were largely biased by the single system towards PSS1443+22 (; ). Removing that data point from the current set of measurements reduces the mean statistics ( by 0.1 dex and by 0.05) but statistically the effect is only significant in the scatter as this data point dominates . Eliminating PSS1443+22 reduces by 0.06 and a new F-test indicates the and distributions are inconsistent at c.l. Perhaps more intriguing, however, is that if one were to split the bin at into two sub-samples, eliminating the PSS1443+22 system would have the effect that would decrease markedly ( dex) at . We stress, however, that there is no physical justification for disregarding the system towards PSS1443+22; both the HI and Fe column densities are well measured and there may be a significant number of high metallicity systems at . As our sample size increases significantly in the upcoming year, we will further investigate smaller redshift intervals.
Along with the results from PW00, the new results imply an evolution in the mean metallicity of neutral gas which is inconsistent with the majority of chemical evolution models. This includes the analyses of Pei et al. (1999), Edmunds & Phillips (1997), and Malaney and Chaboyer (1996) all of which predict a significantly larger decrease in than observed. Prantzos & Boissier (2000) have noted that the absence of evolution in could be explained by a dust obscuration scenario where no system with [Zn/H] + is observed. While this model matches the observations well, these authors did not incorporate their model within the formalism of Fall & Pei (1993) which is very likely to minimize the effects of dust obscuration. There is an ongoing survey of a sample of radio-selected QSO’s which will help emperically assess the effects of dust obscuration (Ellison, 2000). Recently, Mathlin et al. (2000) presented a comprehensive chemical evolution model for the damped Ly systems which included the Press & Schechter (1974) cosmological formalism, the Fall & Pei (1993) dust obscuration treatment, and a detailed galactic chemical evolution scenario along the lines of Prantzos & Boissier (2000). Their results have the same failing as the majority of previous models: an underprediction of and at . While they suggest that galaxy interactions and mergers may resolve this discrepancy, it is unclear why these processes would not significantly alter their results at . Cen & Ostriker (1999) have included the effects of mergers and feedback in their numerical simulations and their results indicate a milder evolution in from for objects they identify as damped Ly systems. Unfortunately, this treatment did not extend to , but preliminary results appear to agree with the results presented in this Letter (Cen & Ostriker 2000; priv. comm.).
In PW00, we noted that none of the systems with have large HI column density. This could be explained by dust obscuration (e.g. Boiss et al., 1998), but it is also naturally explained by scenarios where a significant fraction of neutral gas has been converted into stars as well as galactic models with a metallicity gradient and a central HI hole (Wolfe & Prochaska, 1998; Efstathiou, 2000). The latter scenarios also account for the increasing scatter in [Fe/H] provided the gas begins to be significantly consumed at . Examining Figure 3, one notes that none of the new systems have and the total sample ) has no system with dex. We emphasize that the ESI measurements are sensitive to metallicities well below dex555Our 2 limits on the metallicity are [Al/H]= , [Fe/H] , and [O/H] assuming the feature spans 3 pixels with a SNR=20 and and not a single system has been removed from the analysis because no metal-lines were detected. While future measurements may reveal a system or two with , we contend that there is a physical lower limit to the metallicity of the damped Ly systems at all epochs. Whether this lower limit on [Fe/H] is a function of Pop III pre-enrichment (e.g. Wasserburg & Qian, 2000; Ellison et al., 2000) or rapid metal enrichment is still a matter of debate.
We expect our efficiency on future nights with ESI to be higher yielding at least 7 new [Fe/H] measurements at per night. Therefore, in the next two years our survey and other similar ongoing projects (Sargent, Djorgovski; priv. comm.) will reveal over 50 new measurements from ESI alone. In fact, with one more successful night we will have more systems in the sample than the sample. By pushing to lower magnitude limits ), we will also be able to examine correlations between the metallicity and quasar brightness.
References
- Boiss et al. (1998) Boiss, P., Le Brun, V., Bergeron, J., & Deharveng, J.-M. 1998, A&A, 333, 841
- Boissier & Prantzos (1999) Boissier, S. & Prantzos, N. 1999, MNRAS, 307, 857
- Cen & Ostriker (1999) Cen, R. & Ostriker, J.P. 1999, ApJ, 519, 109L
- Chiappini, Matteucci, & Gratton (1997) Chiappini, C., Matteucci, F., & Gratton, R. 1997, ApJ, 477, 765
- Chiosi (1980) Chiosi, C. 1980, A&A, 83, 206
- Dessagues-Zavadsky et al. (2000) Dessauges-Zavadsky, M., D’Odorico, S., McMahon, R.G., Molaro, P., & Ledoux, C. 2000, submitted
- Djorgovski et al. (1998) Djorgovski, S.G., Gal, R.R., Odewahn, S.C., de Carvalho, R.R., Brunner, R., Longo, G., & Scaramella, R. 1998, in “Wide Field Surveys in Cosmology”, eds. S. Colombi & Y. Mellier, (astro-ph/9809187)
- Edmunds & Phillips (1997) Edmunds, M.G. & Phillips, S. 1997, MNRAS, 292, 733
- Efstathiou (2000) Efstathiou, G. 2000, MNRAS, 317, 697
- Edvardsson et al. (1993) Edvardsson, B., Anderson, J., Gutasfsson, B., Lambert, D.L., Nissen, P.E., and Tompkin, J. 1993, A&A, 275, 101.
- Ellison (2000) Ellison, S.L. 2000, PhD thesis, Cambridge University
- Ellison et al. (2000) Ellison, S.L., Songaila, A., Schayem, J., & Pettini, M. 2000, AJ, 120, 1175
- Ellison et al. (2000) Ellison, S.L., Pettini, M., Steiel, C.C., & Shapely, A.E. ApJ, in press (astro-ph/0010427)
- Fall & Pei (1993) Fall, S.M. & Pei, Y.C. 1993, ApJ, 402, 479
- Gardner et al. (1997) Gardner, J.P., Katz, N., Weinberg, D.H., & Hernquist, L. 1997, ApJ, 486, 42
- Kauffmann (1996) Kauffmann, G. 1996, MNRAS, 281, 475
- Lu et al. (1996) Lu, L., Sargent, W.L.W., Barlow, T.A., Churchill, C.W., & Vogt, S. 1996, ApJS, 107, 475
- Lu et al. (1997) Lu, L., Sargent, W.L.W., & Barlow, T.A. 1997, astro-ph/9711298
- Malaney and Chaboyer (1996) Malaney, R.A. and Chaboyer, B. 1996, ApJ, 462, 57
- Maller et al. (1999) Maller, A.H., Somerville, R.S., Prochaska, J.X., & Primack, J.R. 1999, After the Dark Ages: The 9th Annual October Astrophysics Conference, in press (astro-ph/9812369)
- Massey & Cronwall (1990) Massey, P. & Cronwall, C. 1990, ApJ, 358, 344
- Mathlin et al. (2000) Mathlin, G.P., Baker, A.C., Churches, D.K., & Edmunds, M.G. 2000 (astro-ph/0009226)
- Mo, Mao, & White (1998) Mo, H.J., Mao, S., & White, S.D.M. 1998, MNRAS, 295, 319
- Molaro et al. (2000) Molaro, P., Bonifacio, P., Centurin, M., D’Odorico, S., Vladilo, G., Santin, P., & Di Marcantonio, P. 2000, ApJ, 541, 54
- Pei & Fall (1995) Pei, Y.C. & Fall, S.M. 1995, ApJ, 454, 69
- Pei et al. (1999) Pei, Y.C., Fall, S.M., & Hauser, M.G. 1999, ApJ, 522, 604
- Peroux et al. (2000) Peroux, C., Irwin, M.J., McMahon, R., Storrie-Lombardi, L. 2000, in “The Evolution of Galaxies. I - The Observational Clues”, eds. J.M. Vilchez, G. Stasinska, & E. Perez, (astro-ph/0008172)
- Pettini et al. (1994) Pettini, M., Smith, L. J., Hunstead, R. W., and King, D. L. 1994, ApJ, 426, 79
- Pettini et al. (1997) Pettini, M., Smith, L.J., King, D.L., & Hunstead, R.W. 1997, ApJ, 486, 665
- Pettini et al. (2000) Pettini, M., Steidel, C.C., Adelberger, K.L., Dickinson, M., & Giavalisco, M. 2000, ApJ, 528, 96
- Prantzos & Boissier (2000) Prantzos, N. & Boissier, S. 2000, MNRAS, 315, 82
- Press & Schechter (1974) Press, W.H., & Schechter, P. 1974, ApJ, 187, 425
- Prochaska & Wolfe (1996) Prochaska, J. X. & Wolfe, A. M. 1996, ApJ, 470, 403
- Prochaska & Wolfe (1997) Prochaska, J. X. & Wolfe, A. M. 1997, ApJ, 474, 140
- Prochaska & Wolfe (1999) Prochaska, J. X. & Wolfe, A. M. 1999, ApJS, 121, 369
- Prochaska & Wolfe (2000) Prochaska, J. X. & Wolfe 2000, ApJ, 533, L5, (PW00)
- Savage and Sembach (1991) Savage, B. D. and Sembach, K. R. 1991, ApJ, 379, 245
- Shetrone, Cote, & Sargent (2000) Shetrone, M., Cote, P., Sargent, W.L.W. 2000, ApJ, in press, (astro-ph/0009505)
- Smecker-Hane & McWilliam (1999) Smecker-Hane, T. & McWilliam, A. 1999, in “Spectro-Photometric Dating of Stars and Galaxies”, ed: I. Hubeny, S. Heap, & R. Cornett, ASP Conference, (astro-ph/910211)
- Storrie-Lombardi & Wolfe (2000) Storrie-Lombardi, L.J. & Wolfe, A.M. 2000, ApJS, in press
- Trager et al. (2000) Trager, S.C., Faber, S.M., Worthey, G., & Gonzlez, J.J. 2000, AJ, 120, 165
- Wasserburg & Qian (2000) Wasserburg, G.J. & Qian, Y.-Z. 2000, ApJ, 538, L99
- Wolfe et al. (1994) Wolfe, A. M., Fan, X-M., Tytler, D., Vogt, S. S., Keane, M. J., & and Lanzetta, K. M. 1994, ApJ, 435, L101
- Wolfe et al. (1995) Wolfe, A. M., Lanzetta, K. M., Foltz, C. B., and Chaffee, F. H. 1995, ApJ, 454, 698
- Wolfe & Prochaska (1998) Wolfe, A.M. & Prochaska, J.X. 1998, ApJ, 494, 15L