The early X-ray emission from V382 Velorum (=Nova Vel 1999):
An internal shock model
Abstract
We present the results of ASCA and RXTE observations of the early X-ray emission from the classical nova V382 Velorum. Its ASCA spectrum was hard (kT10 keV) with a strong (1023 cm-2) intrinsic absorption. In the subsequent RXTE data, the spectra became softer both due to a declining temperature and a diminishing column. We argue that this places the X-ray emission interior to the outermost ejecta produced by V382 Vel in 1999, and therefore must have been the result of a shock internal to the nova ejecta. The weakness of the Fe K lines probably indicates that the X-ray emitting plasmas are not in ionization equilibrium.
1 Early X-ray Emission from Classical Novae
Classical novae (or simply, novae) are explosions caused by thermonuclear runaways on accreting white dwarfs (see, e.g., Chapter 5 of Warner (1995) for a review). In common with many other astrophysical explosions, a significant fraction of the energy goes into the kinetic energy of the ejecta: for an ejecta mass of 10-4M⊙ and an ejecta velocity of 1,000 km s-1, one obtains 1045 ergs as the ejecta kinetic energy; these may be taken as typical values. Of course, not all novae are identical; “fast” novae are visually brighter at maximum, its visual light decays faster, and ejecta velocities are higher, than the “slow” novae. The fastness can be characterised by the time it takes the nova to decline by 2 (t2) or 3 (t3) visual magnitudes; there is a well-known correlation between the peak absolute magnitude and the rate of decline, which makes novae useful as distance indicators. The white dwarf mass and other factors are known to influence the fastness of a nova, although full details are still being worked out. Another important distinction can be discerned from the abundances of the nova ejecta: roughly a third of recent novae are neon novae, those believed to occur on O-Ne-Mg white dwarfs, while the remainder are believed to occur on C-O white dwarfs.
The underlying binary is a cataclysmic variable (CV), that is, a white dwarf accreting from a late type companion, usually a Roche-lobe filling dwarf on or near the main sequence. Under certain conditions, the accreted material becomes degenerate; a sufficient accumulation of this fresh fuel causes a thermonuclear runaway. A nova typically reaches its peak visual brightness within a few days after the onset of brightening. In the early decay phase, the intense wind from the still nuclear-burning white dwarf creates a huge pseudo-photosphere, completely obscuring the underlying binary. The declining mass-loss rate shrinks the photosphere, during which the bolometric luminosity remains roughly constant, at about the Eddington limit, and the effective temperature increases. Finally, when the photosphere has shrunk to the original radius of the white dwarf, the nova may become a super-soft source, exhibiting an intense, optically thick radiation from the white dwarf surface, with an effective temperature of the order 50 eV. Such super-soft emission is observed 6 months to several years after the visual peak of the nova. Recently, Starrfield et al (2000) performed Chandra grating observations of V382 Vel and V1494 Aql and discovered line-rich X-ray spectra, superimposed on a super-soft continuum in the case of the latter but not the former. These cast some doubt on the reliability of the parameters derived from lower resolution X-ray observations (such as with ROSAT PSPC), although the gross characterization of the super-soft component is probably secure in many cases.
In addition, an early, hard X-ray component has been observed in several recent novae. V838 Herculis (=Nova Herculis 1991, V) was detected 5 days past optical maximum at 0.16 ct s-1 in ROSAT PSPC (Lloyd et al, 1992). V1974 Cygni (=Nova Cygni 1992, V) was detected 60 days past maximum at 0.02 ct s-1 in ROSAT PSPC (Balman et al, 1998). Nova Scorpii 1997 (V) was detected 100 days past maximum at 0.07 and 0.02 ct s-1 respectively in BeppoSAX LECS and MECS (Orio et al, 1997). Finally, the ROSAT PSPC detection of V351 Puppis (=Nova Puppis 1991) 16 months after the visual maximum, at 0.223 ct s-1 may also be due to the same component (Orio et al, 1996).
Early X-ray emissions have also been detected from the recurrent nova, RS Ophiuchi, following its January 1985 outburst, using EXOSAT LE and ME instruments (Mason et al, 1986). The mass donor in this system is a red giant, unlike in the short-period classical nova systems. The early X-ray data for this system have been interpreted in terms of the nova ejecta colliding with the red giant wind. In the classical nova systems with Roche-lobe filling dwarf companions, any wind from the secondary would be too weak for this mechanism to work.
In this paper, we report on the results of an ASCA Target-of-opportunity (TOO) observation and an RXTE monitoring campaign of the early, hard X-ray emission from V382 Vel. Observations are described in §2, results are presented in §3 and interpreted in §4.
2 Observations
V382 Velorum (=Nova Velorum 1999) was discovered on 1999 May 22 at V 3. The pre-discovery photographs extend the detection back to May 20.923 UT at magnitude 7.0–7.25; the nova was undetected at May 20.57 to a limiting magnitude of 13. We estimate that peak of thermonuclear runaway, initial ejection of mass, and the beginning of visual brightening all occurred around 1999 May 20.5 (=JD 2451319.0); we will refer to this as time 0 of this nova in this paper. Given the rapid rise, this estimate is probably accurate to better than a day, which is adequate for our purposes.
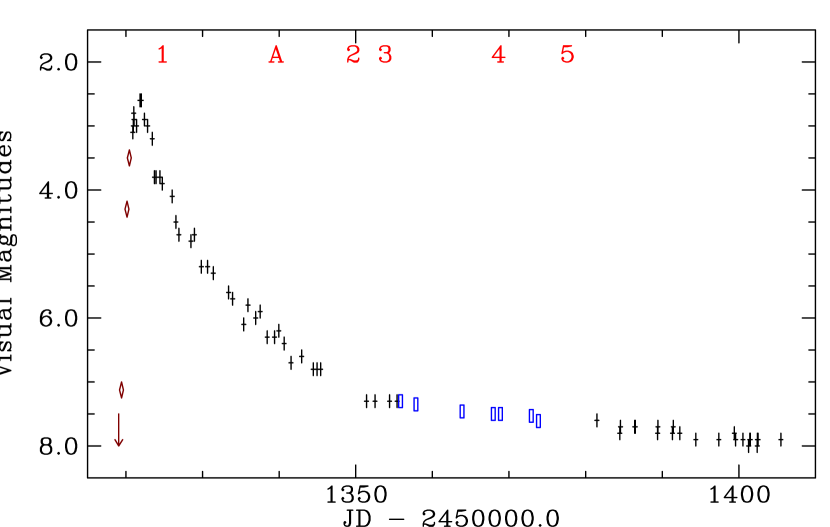
V382 Vel appeared to have peaked near at about day 2.0, making this the brightest nova since V1500 Cygni (=Nova Cygni 1975), and declined rapidly. In Fig. 1, we have plotted the visual magnitude estimates of V382 Vel as published in various IAU Circulars (nos. 7176, 7177, 7179, 7184, 7193, 7203, 7209, 7236, and 7238), since they provide the best overall coverage throughout the first 3 months of the nova. We have supplemented these with magnitude estimates from pre-discovery photographic plates, and with photometry at Mt. John University observatory (Kilmartin (1999) and Gilmore (1999)) between Jun 26 and Jul 14 (a period for which no visual magnitude estimates are available in IAUCs), although there could be an offset between visual magnitudes and photographic or photoelectric measurements. V382 Vel is a very fast nova: Della Valle et al (1999) have measured the rate of decline of the nova to be t2=6 days and t3=10 days, and hence estimated a peak absolute visual magnitude MV of ; this implies a distance to the nova of about 2 kpc. It is also a neon nova (Woodward et al, 1999), as evidenced by the detection of strong [NeII] 12.81 line.
Table 1. RXTE and ASCA Observations of V382 Velorum.
| Date | Satellitea | Exposure (ksec)b | Count Rate c |
|---|---|---|---|
| 1999 May 26 (day 5.7) | RXTE (0123) | 2.4 | 0.110.03 |
| 1999 Jun 9/10 (day 20.5) | ASCA | 33.6/39.5 | 0.1610.002/0.1400.002 |
| 1999 Jun 20 (day 31) | RXTE (02)d | 1.3 | 3.590.06 |
| 1999 Jun 24 (day 35) | RXTE (0123) | 0.7 | 3.240.06 |
| 1999 Jul 9 (day 50) | RXTE (023) | 2.1 | 2.940.04 |
| 1999 Jul 18 (day 59) | RXTE (123) | 1.0 | 2.010.06 |
aFor RXTE observations, the PCUs that were used for the observations are indicated in parentheses. bGood on-source time after standard screening. For the ASCA observation, exposures for GIS and SIS are shown. cFor the RXTE observations, 2.5–10 keV count rates per PCU are shown; for the ASCA observation, the average GIS rate and the average SIS rate are shown. dThis observation included a scan to confirm that the nova was the only source of hard X-rays.
The rare brightness of the nova (the brightest since the advent of imaging X-ray astronomy) has made V382 Vel a prime target for X-ray observations. Accordingly, by the end of 1999, V382 Vel has been observed with RXTE (5 times), BeppoSAX (twice), ASCA (once) and Chandra (once, with three more pointings during 2000; Starrfield et al (2000)). Here we concentrate on the RXTE and ASCA data (summarized in Table 1; see also Fig. 1). We also cite the preliminary results of the BeppoSAX observations (Orio et al (1999a) and Orio et al (1999b)).
The ASCA observation (see also the preliminary report by Mukai & Ishida (1999)) was performed between 1999 June 9 13:09 UT and June 10 16:01 UT, for approximately 40 ksec on-source. We have performed standard data screening and extraction, and combined the data from 2 pairs of similar instruments for spectroscopic analysis (i.e., producing one SIS spectrum and one GIS spectrum, each with an associated response and a background file). For our light curve analysis, we have combined the data from all 4 instruments.
There have been 5 public TOO observations of V382 Vel with RXTE, from which we have only analyzed the PCA data (a simple extrapolation of PCA spectral model would argue against a HEXTE detection; even if a hard X-ray source was to be detected, we cannot be confident of its true origin). All were performed with Epoch 4 gain setting, with varying number of Proportional Counter Units (PCUs) on (see Table 1), obtaining usable data of V382 Vel for 0.7–2.4 ksec per visit. In addition, during the middle of observation 2, a raster scan was performed to confirm that V382 Vel is the only source of hard X-rays in this area of the sky. We have used the faint source model for background subtraction (specifically, pca_bkgd_faintl7_e04v03.mdl and pca_bgd_faint240_e04e03.mdl in addition to pca_saa_history). We have used responses created by pcarmf v7.01 for spectral fitting.
3 Results
3.1 First RXTE observation
This observation was performed at day 5.7 in our convention, or only about 3 days past the visual maximum. Had a secure detection been obtained, this would have been the earliest hard X-ray detection of a classical nova. However, this was not the case, as has been reported earlier (Mukai & Swank, 1999). Even though there is a statistically significant count excess over the background model in the 2.5–10 keV band (our refined value is 0.110.03 ct s-1 per PCU), this cannot be considered a secure detection, given the point-to-point fluctuation in the cosmic X-ray background, particularly at such a low Galactic latitude (). A 0.2 ct s-1 per PCU source cannot be excluded, roughly corresponding to 2.5 ergs cm-2s-1 in the 2–10 keV band.
3.2 ASCA data
The imaging capability of ASCA leaves no doubt that V382 Vel was strongly detected on day 20.5 (see also Orio et al (1999a) for the slightly earlier, and equally secure, detection by BeppoSAX).
The combined 64-s bin light curve was analyzed for variability. The best straight-line fit has a positive slope (combined count rates increasing from 0.564 ct s-1 to 0.583 ct s-1 during our 1 day observation), i.e., increasing with a timescale of 30 days at day 20.5. This fit has a of 1.15 for 626 degrees of freedom, implying that the source was variable on a shorter timescale formally at a 99.4% confidence level. However, a Fourier analysis reveals no significant periodicity, to a limiting amplitude of 5%, and the apparent variability at this level may well be due to imperfect background subtraction and other instrumental effects.
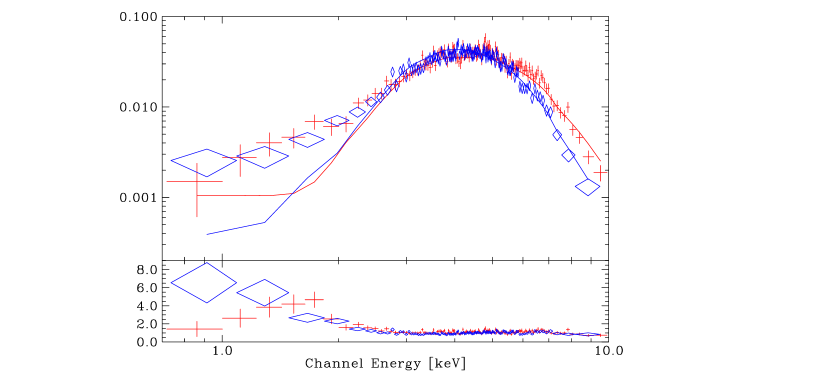
We have fitted the GIS and SIS spectra of V382 Vel with a Bremsstrahlung continuum model (Fig. 2). The choice of this model was dictated by a combination of physical considerations and the quality of the fits, not only of this observation but of the later RXTE data as well. We find that a single-component Bremsstrahlung model with a uniform absorber gives a poor fit, with excesses at low energies. A partial-covering absorber model results in a marked improvement to the fit: the absorbing column is found to be 1.01 cm-2, with a covering fraction of 99.5%. The bremsstrahlung model has a temperature of kT=10.2 keV. There is a weak detection a Fe K line at 6.630.11 keV with an equivalent width of 130eV. We have also attempted fitting the ASCA spectra with the mekal plasma emission model (Mewe et al (1985); Mewe et al (1986); Liedahl et al (1995)). Since the continuum temperature is such that strong 6.7 and 6.97 keV Fe K lines are expected, the fit fails unless the abundances are allowed to vary; in this case, the abundance of Fe (the only element the ASCA data are sensitive to) of less than 10% Solar is indicated. The observed flux is 2.13 ergs s-1cm-2 and inferred luminosity (corrected for absorption and for an assumed distance of 2 kpc) is 4.5 ergs s-1. The inferred emission measure (EM) is 1.7 cm-3.
3.3 Follow-up RXTE observations: Spectral Evolution
Table 2. Results of Spectral Fits.
| Day | NH | kT | Line E | Line EqW | Luminosity | EM |
|---|---|---|---|---|---|---|
| (1022 cm-2) | (keV) | (keV) | (eV) | (erg s-1) | (cm-3) | |
| 20.5 | 10.10.5 | 10.2 | 6.630.11 | 130 | 4.5 | 1.7 |
| 31 | 7.72.0 | 4.0 | 6.2 | 190 | 7.9 | 6.3 |
| 35 | 6.01.9 | 3.5 | 6.40.4 | 220150 | 7.2 | 5.6 |
| 50 | 3.11.2 | 2.50.3 | 7.1 | 220 | 7.6 | 5.9 |
| 59 | 1.7 | 2.4 | 4.9 | 4.0 |
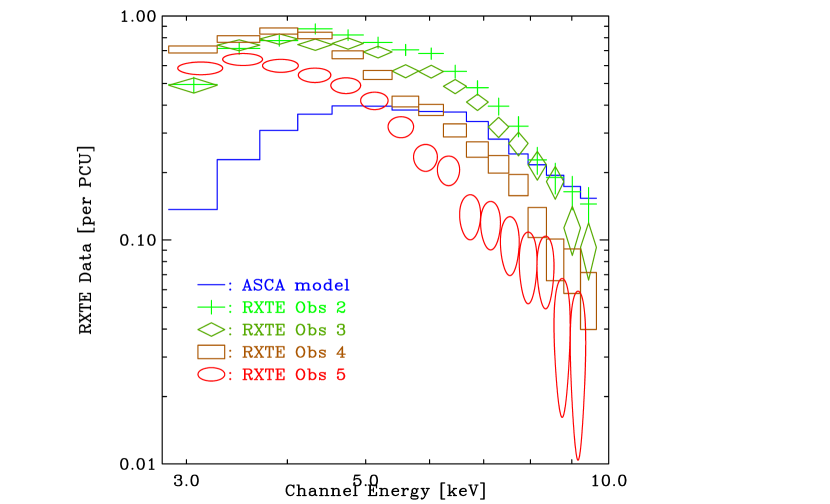
During the subsequent RXTE campaign, V382 Vel was strongly detected, and showed a marked softening from the ASCA observation (day 20.5) to the last RXTE observation (day 59). The spectra are shown in Fig. 3.
For these RXTE spectra, we have used a simple absorber model, since RXTE PCA is not sensitive to the type of soft excess seen in the ASCA spectrum. The column densities deduced from the fits decrease to an almost undetectable (to RXTE) level, accompanied by a decrease in the temperature of the bremsstrahlung model; either change in itself is not sufficient to explain the observed spectral softening. The Fe K line is securely detected above the bremsstrahlung continuum model in observations 2 & 3. However, even then, the lines are weaker than the plasma models would suggest.
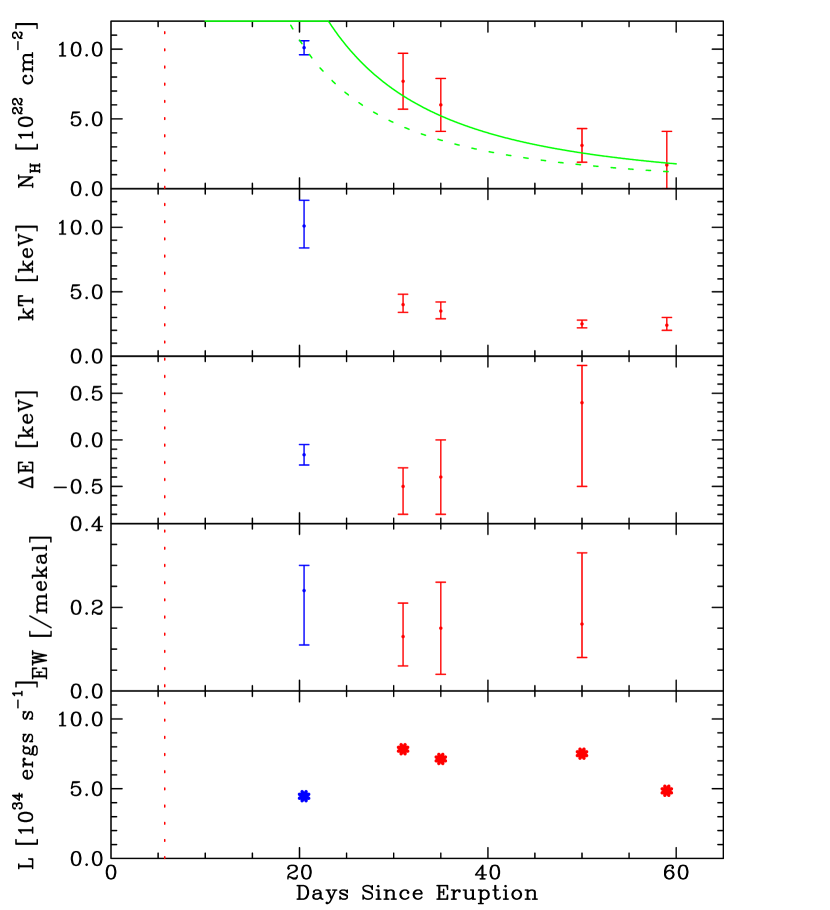
These results are summarized in Table 2 and in Fig. 4.
4 Discussion
CVs long after a nova eruption are often seen as X-ray sources with luminosities in the 1030–1034 ergs s-1 range. However, it is unlikely that accretion can explain the X-rays we observed in V382 Vel, given that the underlying binary was buried deep within the optically thick wind at the epochs of these observations, quite apart from the question of whether accretion could have been reestablished within several weeks of the onset of the nova eruption.
Three nova-specific mechanisms for hard X-ray emission have been proposed: radioactive decays, super-soft emission, and shock emission. Radioactive decays of 22Na produces 1.275 MeV -ray line, which could produce X-rays via Compton-degradation (Livio et al, 1992). However, resulting X-rays predominantly originate from a surface with Compton optical depth 1, i.e., NH cm-2; this is far in excess of even the highest column density seen in V382 Vel, 1.0 cm-2 measured with ASCA, hence we exclude radioactive decays from further considerations. The super-soft emission is the optically thick radiation from the white dwarf surface, with an effective temperature of the order 50 eV, thus clearly of the wrong shape to explain our observations. This component was, however, observed with BeppoSAX in November, 1999 in V382 Vel (Orio et al (1999b)).
This leaves shock emission as the only viable candidate as the origin of X-rays from V382 Vel observed with ASCA and RXTE between day 20.5 and 59.
In one version of the shock model (see, e.g., Lloyd et al (1992)), the nova ejecta interact with pre-existing, circumstellar material. There is a severe problem with such an external shock model: as Lloyd et al (1992) point out, the presence of an unevolved secondary in most classical nova makes the likelihood of extensive pre-outburst circumstellar material low. The amount of interstellar medium that the nova ejecta can encounter during the first year is obviously too small, and there is no evidence for a dense circum-binary material in classical novae before an eruption. As previously mentioned, in a system with a red giant mass donor (such as RS Oph), the external shock model works well (Mason et al (1986); see also Lloyd et al (1992)). There is no indication to date that V382 Vel has a giant mass donor, however.
We therefore discard the external shock explanation for the early X-ray emissions in classical (non-recurrent) novae.
4.1 Internal Shock Model
The ASCA and RXTE observations reported here provide three valuable clues as to the nature of the putative shock: the NH history, the kT history, and the behavior of the Fe K line.
The observed NH cannot be interstellar, because it is variable. Moreover, the UV observations (Shore et al, 1999) indicate a reddening EB-V of perhaps 0.2, or NH 3 cm-2. This is also consistent with the November, 1999, BeppoSAX observation, from which an X-ray column of NH = 2 cm-2 has been determined (Orio et al, 1999b).
A simple model consisting of a discrete shell of mass 5 M⊙ expanding at 1000 km s-1, ejected at time 0 (the presumed peak of the thermonuclear runaway), is successful in describing the time history of NH as measured with RXTE if one assumes a point-like X-ray source at its center. For an extended source, photons from near the limb has longer path lengths through the cold outer shell, thus the above shell mass is an overestimate, particularly for a limb-brightened X-ray source. The point-source model that fits the RXTE observation overpredicts the ASCA NH by 50%. This may be due, in part, to the simplistic treatment of the complex geometry; or the outer shell may have been partially ionized at early stages, allowing low energy photons to escape and hence complicating our spectral fits (a similar mechanism may have allowed the very early detection of V838 Her with ROSAT (Lloyd et al, 1992)). Extrapolation of this model back to day 5.7, the epoch of the initial RXTE observation, implies that the column would have been cm-2, too high to allow X-rays escape even allowing for some overprediction. That is, the NH history is suggestive of an origin in an expanding shell, the ejecta from the 1999 nova eruption itself. The mass in this shell is probably somewhat less than 5 M⊙ if, as seems likely, the X-ray emission is from a limb-brightened inner shell.
This model of the NH history leads naturally to an internal shock model. An expanding outer shell provides the observed NH, with the X-ray producing shock residing inside. The simplest model, then, consists of two distinct shells of nova ejecta. The initial ejecta provide the absorbing column; a layer of later, and faster-moving, ejecta plough into the initial ejecta. The high shock temperature of kT10 keV requires a strong shock with velocity differential of 3000 km s-1. Later observations show a softer spectrum, in kT as well as in NH, which suggests that the two sets of ejecta are merging to form a single layer. This is a scenario first proposed by Friedjung (1987), which was motivated by the vast literature on the optical spectra of classical novae in eruption.
Quantitative models of optical spectra of classical novae are generally based on a single-component, optically thick wind approximation (Bath & Shaviv, 1976). However useful this formalism may be, it is clear from the rich taxonomy of optical spectra of novae (summarized most notably by Payne-Gaposchkin (1957)) that nova ejecta are far more complex than this. Several distinct systems are often recognized. In time order, these are called pre-maximum, principal, diffuse enhanced, and Orion components. As the name implies, the pre-maximum component is the first absorption features seen, before the visual light curve reaches its maximum; their typical velocities are in the 100–1000 km s-1 range. This component therefore is associated with the initial ejecta from the nova eruption, which presumably carries the pseudo-photosphere with it as it expands. The principal system follows next, with a higher velocity and a higher ionization; this is the system that persists decades after the eruptions and can be identified with the expansion velocity of the nova shells. Diffuse enhanced and Orion systems are yet of higher ionizations and higher velocities (1000 km s-1 in slow nova to as high as 4000 km s-1 in very fast novae).
We see ever deeper into the optically thick wind as time goes by, due to the decrease in the mass loss rate, hence the optical depth at a given physical location. This does explain the increasing trend in ionization; however, we should observe less accelerated material as time goes on in a one-zone wind model. The fact that the observed velocities increase with time probably requires at least two distinct components. For example, Friedjung (1987) explains the principal component as due to the result of a collision between the slow-moving pre-maximum system with the faster-moving diffuse enhanced/Orion system. Applied to a fast nova, this model predicts a collision between pre-maximum component moving typically at 1000 km s-1 and the fast wind with a typical velocity of 4000 km s-1, with the resulting shock of kT10 keV. This is just the X-ray temperature we observe in V382 Vel. Since we are unaware of any pre-maximum spectroscopy, we simply adopt the “typical” value of 1000 km s-1; as for the fast wind, (Shore et al, 1999) report a terminal velocity of 5000 km s-1for Al III 1860 and Si IV 1400 lines. Thus the shock in V382 Vel may have been capable of producing an even higher X-ray temperature, but is consistent with the observed value.
In more theoretical terms, the pre-maximum system can be associated with the dynamical ejection of the white dwarf envelop at near the peak of the thermonuclear runaway; the faster materials can then be associated with radiation-driven wind due to the continued shell hydrogen burning, whose other manifestation is the super-soft X-ray emission from the hot photosphere to be observed several month later.
Assuming that the shock is due to the collision between the pre-maximum system and a fast-moving wind, what are the likely physical conditions? First, the density of the pre-maximum ejecta can be estimated as follows. Let us assume an ejecta mass of 2 M⊙ (as we have argued that the 5 M⊙ figure from NH history was likely a slight overestimate). The ejecta are expanding as a shell with radius , where is the ejection velocity 1000 km s-1 and the time since explosion. There is likely to be a velocity dispersion (say, 200 km s-1) in the ejecta; taking the increasing radial spread into account, the volume of the pre-maximum system at 20 days after eruption is cm3 and the density is estimated to be 7.5 cm-3.
For the fast wind, since we assume this to be a continuous (and slowly changing) phenomenon, velocity dispersions would not affect the density. For a wind mass loss rate of 2 g s-1 (or M⊙ in 100 days) at a wind velocity of 4000 km s-1, the wind density at the pre-maximum shell would be 7.5 cm-3. It appears likely that the fast wind will be initially assimilated into the pre-maximum shell, after undergoing a shock, with a post-shock density of the order 3 cm-3.
If our interpretation is correct, the physical conditions of the early X-ray emission source in V382 Vel is orders of magnitudes denser than in supernova remnants, and orders of magnitudes more rarified than in accretion shocks in CVs, two well-studied classes of shock heated, X-ray emitting, plasmas. Although it may be comparable to stellar coronae in density alone, the heating mechanism and the environment are different. Applications of existing spectral models (widely tested in supernova remnants and stellar coronae) must therefore proceed with caution.
4.2 Comparison with the Interacting Winds Model of O’Brien et al (1994)
Such an internal shock model has already been suggested as a possibile explanation of the early ROSAT detection of V838 Her (Lloyd et al, 1992). O’Brien et al (1994) has developed this into a detailed numerical model assuming a constant mass loss rate, with ejection velocity of 1000 km s-1 for the 1st day, increasing linearly to 3600 km s-1 by day 5, and remaining constant thereafter. Our model and theirs are similar in that X-rays are generated from an internal shock. However, O’Brien et al (1994) and we have chosen different sets of simplyfing assumptions. O’Brien et al (1994) assume a constant mass loss rate, with a smoothly changing ejection velocity; in contrast, we have assumed a two distinct phases of mass loss with a discontinuous change in velocity. Are the differences significant, and if so, which is the better framework on which to build future, more detailed, models?
Let us first examine how the specific predictions of the O’Brien et al (1994) numelical model compare with our data on V382 Vel: we find two significant differences.
First difference concerns the predicted temperature of the X-ray emitting region. The O’Brien et al (1994) model predicts 2 to 2K (or kT0.2–2 keV) X-ray emitting plasma, matching one of the two thermal plasma model parameters that fit the ROSAT PSPC spectrum of V838 Her (model RS2 in Table 2 of O’Brien et al (1994)), whereas we observe KT10 keV on Day 20.5 in V382 Vel. Secondly, O’Brien et al (1994) claims that “for these parameter values the consequent reduction in low-energy X-rays is small,” whereas low-energy photons are decimated by intrinsic absorption in the ASCA spectrum of V382 Vel.
Note that, while the O’Brien et al (1994) model does predict a high temperature region (TK) 10 days after eruption, the density predicted in this region is orders of magnitude too low to result in significant X-ray emission (from their Figure 1, we estimate emission measure of order 1046 cm-3, compared to cm-3 estimated from ASCA and RXTE spectra). Moreover, since this high temperature is seen at the outermost edge of the ejecta, little absorption is predicted (to be precise, half the emission should have interstellar NH, while the other half could suffer relatively high intrinsic absorption).
Thus, the specific numerical model presented in O’Brien et al (1994) cannot explain our data on V382 Vel; however, this is not surprising. We now ask the more reasonable question: what changes in model parameters might bring the predictions of the O’Brien et al (1994) model into line with our observations of V382 Vel?
The penultimate paragraph of §3.2 of O’Brien et al (1994) makes it clear that their model parameters are reasonably constrained by observations. The mass loss rate is determined by the observed X-ray luminosity: Given the similar X-ray luminosities inferred for V838 Her and V382 Vel, we cannot siginificantly increase the mass loss rate adopted for the former by O’Brien et al (1994). Without adjusting the mass loss rate, it does not appear possible to match the NH we observe in V382 Vel. The temperature of the X-ray emitting region in their model is determined by the velocity contrast, ; because the line velocities measured in V382 Vel is similar to those in V838 Her (Vanlandingham et al (1996) reports a terminal velocity of 3000 km s-1 and O’Brien et al (1994) assumed 3600 km s-1), we cannot arbitrarily increase the velocity contrast, hence are unable to match the high temperature (kT10 keV) in V382 Vel.
It appears that there is not much room to adjust the parameters, from their own analysis of their numerical model. Given this, we conclude that we probably need to abandon some of the simplifying assumptions adopted by O’Brien et al (1994). We suggest that the simple arguments we presented in §4.1 may serve as a starting framework on which to construct detailed models, without the difficulties encountered by the O’Brien et al (1994) version.
Finally, we note that any model that can succesfully explain V382 Vel may apply, with minor modifications, to V838 Her. This is because the ROSAT PSPC data on V838 Her can be fitted with a thermal model with kT4 keV (model RS1 in Table 1 of O’Brien et al (1994)).
4.3 Weak Fe K Lines: Underabundant or Underionized?
The weakness of the Fe K line is consistent with the shock model, provided either that the Fe abundance is low in the ejecta, or that the shocked plasma is not in ionization equilibrium.
There is no theoretical objection to a low Fe abundance in nova ejecta. This could arise either because the white dwarf accretes low Fe abundance material from the secondary, or because the heavy elements have settled down to deeper layers of the primary in before the nova eruption. However, V382 Vel has been classified as a Fe II nova, because its optical spectra include strong and broad Fe II lines (Steiner et al (1999), Della Valle et al (1999)). In addition, the X-ray continuum shape in the 5–10 keV region measured with ASCA suggest the presence of an Fe edge at a level consistent with a Solar composition absorber with N cm-2 (NB this is not a secure result on its own, as the Fe edge depth is linked with the Fe emission line strength and the continuum shape in our fit). Clearly, Fe is present in the ejecta of V382 Vel. Therefore, we prefer to discount a low abundance as the explanation for the weak Fe K features in the X-ray spectra.
Instead, we consider it likely that the Fe in the nova ejecta is underionized. Studies of supernova remnants typically find that the ionization equilibrium is archived with a timescale such that cm-3s (e.g., Masai (1994)). In young supernova remnants with cm-3s, the iron atoms are in the process of being ionized and this can result in weaker Fe K line at an energy somewhat lower than at equilibrium. We do not have a detailed model of how this might apply to V382 Vel, and it may not be wise to apply the existing non-equilibrium models of supernova remnants without carefully considering the different conditions.
One observational constraint we have on the density is the emission measure, which can be derived from the normalization of the bremsstrahlung model: they are 1.7 cm-3 for the ASCA data and cm-3 for the subsequent RXTE spectra. If the emission region of volume has a uniform density , emission measure simply equals . We can calculate the minimum density consistent with the observed X-ray spectrum by taking the volume of the sphere within the 1000 km s-1 pre-maximum ejecta front at day 20 ( cm3), and assuming a filling factor of 1/4 (since a strong shock compresses by a factor of 4): it is cm-3 (for the assumed 2 kpc distance). Such a plasma will stay in nonequilibrium for half a day. This short timescale for reaching ionization equilibrium is a problem for this interpretation: perhaps the observed X-ray emissions are dominated by recently shocked materials. On the positive side, there is a hint that the detected lines were at lower energies than those predicted by the ionization-equilibrium plasma models (Table 2 and Fig. 4), which is predicted by the non-equilibrium models. Clearly, we need higher quality observations of future bright novae, as well as further modelling of nova ejecta, to discover for certain the cause of weak Fe K lines in V382 Vel.
5 Conclusions
We have observed early X-ray emission from a bright classical nova, V382 Vel. The X-ray spectrum was hard with kT10 keV and NH = 1 cm-2 3 weeks after the onset of the eruption, declining to 2.5 keV and cm-2 2 months after the peak in the optical. Given an assumed distance of 2 kpc, V382 Vel maintained an X-ray luminosity of ergs s-1 for at least 20, perhaps as long as 40, days. The fluence in the X-ray component during this interval was about ergs, a small fraction of the estimated total kinetic energy of the ejecta.
This evolving hard X-ray emission can be best modelled as due to an internal shock within the nova ejecta. Such a shock was originally postulated by Friedjung (1987) to explain the taxonomy of optical lines. We have argued that a detailed model developed by O’Brien et al (1994) to explain the ROSAT PSPC data on V838 Her cannot be adopted to explain our data on V382 Vel; we have outlined our own model, broadly of the same type but with different assumptions, that may serve as a starting point for future modelling works.
Sensitive X-ray observations of other bright novae are necessary to clarify the dependence of hard X-ray properties on the speed class. However, slower novae will almost certainly have a lower peak temperature and remain obscured for a longer period. Frequent optical spectroscopy is also necessary to obtain the velocities of various ejecta components, to be compared with the X-ray temperature evolution. Perhaps most importantly, the field of early X-ray emissions from classical novae is still in its infancy such that a single bright and well-observed system can significantly improve our level of knowledge, as we hope we have demonstrated in this paper. Given the presence of X-ray observatories of unprecedented capabilities during the first decade of the 21st century, we can only hope to see a dramatic increase in our knowledge.
References
- Balman et al (1998) Balman, S., Krautter, J. & Ögelman, H. 1998, ApJ, 499, 395.
- Bath & Shaviv (1976) Bath, G.T. & Shaviv, G. 1976, MNRAS, 197, 305.
- Della Valle et al (1999) Della Valle, M., Pasquini, L, Williams, R. 1999, IAUC 7193.
- Friedjung (1987) Friedjung, M. 1987, A&A, 180, 155.
- Gilmore (1999) Gilmore, A.C. 1999, IAUC 7226.
- Kilmartin (1999) Kilmartin, P.M. 1999, IAUC 7216.
- Liedahl et al (1995) Liedahl, D.A., Osterheld, A.L. & Goldstein, W.H. 1995, ApJ, 438, 115.
- Livio et al (1992) Livio, M., Mastichiadis, A., Ögelmann, H. & Truran, J.W. 1992, ApJ, 394, 217.
- Lloyd et al (1992) Lloyd, H.M., O’Brien, T.J., Bode, M.F., Predehl, P., Schmitt, J.H.M.M., Trümper, J., Watson, M.G. & Pounds, K.A. 1992, Nature, 356, 222.
- Masai (1994) Masai, K. 1994, ApJ, 437, 770.
- Mason et al (1986) Mason, K.O., Córdova, F.A., Bode, M.F. & Barr, P. 1987, RS Ophiuchi (1985) and the Recurrent Nova Phoenomenon, p167, ed. Bode, M.F., (Utrecht: VNU Science Press).
- Mewe et al (1985) Mewe, R., Gronenschild, E.H.B.M. & van den Oord, G.H.J. 1985, A&AS, 62, 197.
- Mewe et al (1986) Mewe, R., Lemen, J.R. & van den Oord, G.H.J. 1986, A&AS, 65, 511.
- Mukai & Ishida (1999) Mukai, K. & Ishida, M. 1999, IAUC 7205.
- Mukai & Swank (1999) Mukai, K. & Swank, J. 1999, IAUC 7206.
- O’Brien et al (1994) O’Brien, T.J., Lloyd, H.M. & Bode, M.F. 1994, MNRAS, 271, 155.
- Orio et al (1996) Orio, M., Balman, S., Della Valle, M., Gallagher, J. & Ögelman, H. 1996, ApJ, 466, 410.
- Orio et al (1997) Orio, M., Trussoni, E., Balman, S., Ögelman, H., Gallagher, J., de Martino, D, Della Valle, M., Gonzalez-Riestra, R. & Salvelli, P. 1997, IAUC 6778.
- Orio et al (1999a) Orio, M., Torroni, V., Ricci, R. 1999a, IAUC 7196.
- Orio et al (1999b) Orio, M., Parmar, A.N., Capalbi, M., Piro, L., Mineo, T. 1999b, IAUC 7325.
- Payne-Gaposchkin (1957) Payne-Gaposchkin, C., The Galactic Novae, (Amsterdam: North-Holland).
- Shore et al (1999) Shore, S.N., Bond, H.E., Downes, R., Starrfield, S., Gehrz, R.D., Krautter, J. & Woodward, C.E. 1999, IAUC 7261.
- Starrfield et al (2000) Starrfield, S., Shore, S.N., Butt, Y., Drake, J., Bond, H.E., Downes, R., Krautter, J., Wagner, R.M., Gehrz, R.D., Woodward, C.E., Della Valle, M., Hauschildt, P.H. & Truran, J.W. 2000, BAAS, 32, 1253.
- Steiner et al (1999) Steiner, J.E., Campos, R. & Cieslinski, D. 1999, IAUC 7185.
- Vanlandingham et al (1996) Vanlandingham, K.M., Starrfield, S., Wagner, R.M., Shore, S.N. & Sonneborn, G. 1996, MNRAS, 282, 563.
- Warner (1995) Warner 1995, Cataclysmic Variables (Cambridge: Cambridge Univ. Press).
- Woodward et al (1999) Woodward, C.E., Wooden, D.H., Pina, R.K. & Fisher, R.S. 1999, IAUC 7220.