Chandra Observations of the Gravitationally Lensed System 2016+112
Abstract
An observation of the gravitationally lensed system 2016+112 with the Chandra X-ray Observatory has resolved a mystery regarding the proposed presence of a dark matter object in the lens plane of this system. The Chandra ACIS observation has clearly detected the lensed images of 2016+112 with positions in good agreement with those reported in the optical and also detects 13 additional X-ray sources within a radius of 3.5 arcmin. Previous X-ray observations in the direction of 2016+112 with the ROSAT HRI and ASCA SIS have interpreted the X-ray data as arising from extended emission from a dark cluster. However, the present Chandra observation can account for all the X-ray emission as originating from the lensed images and additional point X-ray sources in the field. Thus cluster parameters based on previous X-ray observations are unreliable. We place a 3 upper limit on the 2-10keV flux and luminosity of the cluster of 1.6 10-14 erg s-1 cm-2 and 1.7 1044 erg s-1, respectively. We estimate an upper limit on the mass-to-light ratio within a radius of 800 -1 kpc of /LV 190 ⊙. None of the additional point X-ray sources are associated with the galaxy cluster members recently detected in deep optical and IR observations (Soucail et al. 2000).
The lensed object is quite unusual, with reported narrow emission lines in the optical that suggest it may be a type-2 quasar (Yamada et. al. 1999). Our modeling of the X-ray spectrum of the lensed object implies that the column density of an intrinsic absorber must lie between 3 and 85 1022 cm-2 (3 confidence level). The 2-10 keV luminosity of the lensed object, corrected for the lens magnification effect and using the above range of intrinsic absorption, is 3 1043 - 1.4 1044 erg s-1.
Subject headings:
gravitational lensing — galaxies: clusters: general — galaxies: active — X-rays: galaxies1. INTRODUCTION
Wide-separation bona fide gravitational lens (GL) systems with spectroscopically confirmed lens redshifts have been found to contain, in many cases, galaxy-cluster or galaxy-group lenses. The presence of such massive deflectors contributes significantly to the large deflection angles observed in these systems. Solid cases of wide image separation systems containing galaxy cluster lenses are RXJ0911+0551 (Burud et al. 1998) and Q0957+561 (Walsh, Carswell & Weyman 1979; Garrett et al. 1992; Angonin et al. 1994). 2016+112 also falls in the category of confirmed wide-separation GL systems and was first identified by Lawrence et al. (1984) to be comprised of at least three lensed images of an AGN at a redshift of 3.273. The lens contains a giant elliptical galaxy at = 1.01 (Schneider et al. 1986; Langston, Fisher, & Aspin 1991; Lawrence, Neugebauer, & Matthews 1993). The initial deep optical observations of 2016+112 (Schneider et al. 1985; 1986; Lawrence, Neugebauer, & Matthews 1993) did not reveal a galaxy cluster near the lens position.
Hattori et al. (1997) reported the detection of resolved X-ray emission at 1 centered on the giant elliptical. This result was based in part on the detection of an X-ray line at 3.35 keV in the ASCA SIS spectra of 2016+112; the feature was interpreted as Fe-K line emission originating from a cluster at . One of the significant conclusions of the Hattori et al. (1997) detection was the unexpectedly large M/L ratio 3000 implied by the X-ray luminosity (LX(2-10 keV) = 8.5 1044 erg s-1) and the blue luminosity of the giant elliptical lens galaxy (LB = 1.1 1011 ). Their spectral fits to the ASCA SIS spectra of 2016+112 also imply a high iron abundance, Z = 1.7 . One of the puzzling aspects of the Hattori et al. (1997) result was the non-detection of optical and IR emission from the stars in the cluster galaxies even though the X-ray data suggested the presence of metal rich galaxies (Mushotsky et al. 1997). The spatial resolution of 3 arcmin and positional accuracy of 1 arcmin of ASCA were inadequate to establish whether the detected X-ray emission was extended.
Detection of extended X-ray emission near the giant elliptical galaxy was needed to confirm the presence of a galaxy cluster, so 2016+112 was observed with the ROSAT HRI, which has a spatial resolution of 5 arcsec. Hattori et al. (1997) detected a “diffuse” source with 76 24 counts (0.2 - 2 keV), (1.4 0.4) 10-3 counts s-1, within 1 arcmin radius. The Hattori et al. (1997) analysis suggested that the object was extended. Benitez et al. (1999) re-analyzed the ROSAT HRI data and found a faint, elliptical X-ray source spatially coincident with a red galaxy over-density. In particular, their deep imaging in and bands using Keck identified a red sequence of galaxies in color-magnitude diagrams of vs. , suggesting that these are members of a galaxy cluster at 1. Additional spectroscopic observations have confirmed the presence of several red galaxy members at a redshift 1 (Kneib et al. 1998; Soucail et al. 2000; Clowe et al. 2000). This faint X-ray source is considered in their analysis as the counterpart of the optical galaxy cluster. Two additional X-ray sources are detected in the vicinity of 2016+112 that were smoothed together in the analysis by Hattori et al. (1997).
The Benitez et al. (1999) analysis indicated that the cluster lens is an order of magnitude more luminous in the optical than previously reported and the X-ray luminosity is lower than previously estimated. A revised mass-to-light ratio of M/LV = 372 94 (M/LV)⊙ , within a radius of 400 kpc, for the cluster lens of 2016+112 was reported by Benitez. The hypothesis of the presence of a dark matter lens in 2016+112 is not supported with the Benitez et al. (1999) analysis and the recent Chandra observation presented in this letter.
With the launch of the Chandra X-ray observatory on 23 July 1999, it has been possible for the first time to spatially resolve the components of most GL systems in the X-ray band. The GL system 2016+112 was observed with Chandra as part of a snapshot survey of GL quasars aimed at finding suitable candidates for time-delay measurements.
In this letter we describe our observation of 2016+112 using the Chandra Advanced CCD Imaging Spectrometer (ACIS; Garmire et al. 2000, in preparation), results from our data analysis and the comparison to previous X-ray results. We use = 50 km s-1 Mpc-1, q0 = 0.5, and = 0, unless mentioned otherwise.
2. CHANDRA OBSERVATIONS AND DATA ANALYSIS
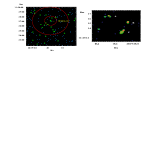
The GL system 2016+112 was observed with Chandra on April 12, 2000 for 7.7 ks. The X-ray image of the Chandra observation is shown in figure 1a. A comparison of this image with that taken with the ROSAT HRI has resolved the mystery surrounding the reported detection of extended X-ray emission that was attributed to a dark cluster of galaxies at a redshift of z 1. With the Chandra observation, we clearly identify several point-sources in this region and detect the three lensed images, A, B, and C (see figure 1b). The image presented in figure 1b was obtained by binning the X-ray event positions to 0.1′′ and smoothing the binned image with a Gaussian of width = 0.2′′.
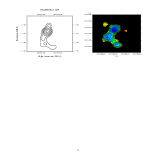
The X-ray image of 2016+112 obtained by the ROSAT HRI and presented in Hattori et al. (1997) is shown in figure 2a. In figure 2b, we show the Chandra image of 2016+112 rebinned by a factor of 12 and smoothed with a Gaussian of width = 15′′, to reproduce the Hattori el al. 1997 analysis of the ROSAT HRI image. It is obvious that the extended component in the ROSAT HRI observation was merely an artifact produced by the inadequate spatial resolution of the ROSAT HRI and image smoothing. The unbinned Chandra image shows several point sources in the vicinity of 2016+112. Chandra has resolved the image components with locations in good agreement with recently reported optical and radio positions for this object. Table 1 lists the relative positions of the lensed images B and C with respect to A as observed with Chandra and HST. The properties of the detected sources in the vicinity of 2016+112 are presented in Table 2.
The reported ROSAT HRI count-rate for 2016+112 of 1.4 0.4 10-3 cnts s-1 (Hattori et al. 1997) was extracted within a 1 arcmin circle centered on 2016+112 and would have included the three additional point sources resolved with Chandra (see figure 2). We converted the observed ROSAT HRI and ASCA SIS count-rates of 2016+112 to ACIS-S S3 CCD count-rates of 1.9 0.6 10-2 cnts s-1 and 3.4 0.3 10-2cnts s-1, respectively, assuming an absorbed power law model with a Galactic column density of 15.6 1020 cm-2 and a photon spectral index of 2. The total count-rate observed with the ACIS-S S3 CCD from the lensed images of 2016+112 and three additional point sources within a circle of 1 arcmin radius centered on 2016+112 is 1.4 0.2 10-2cnts s-1, consistent with the ROSAT HRI count-rate. The total count-rate detected with ACIS from the lensed images of 2016+112 and additional point sources within a circle of 3.5 arcmin radius centered on 2016+112 is 3.3 0.2 10-2cnts s-1 consistent with the ASCA count-rate.
As an additional comparison between the ASCA and Chandra results, we extracted a composite spectrum from only the point-like sources located within a circle of 3.5 arcmin radius of 2016+112. Following the standard Chandra X-ray Center (CXC) analysis procedures, we applied the appropriate gain map correction, eliminated times with bad aspect and created response and anciliary files using the CXC software tools mkrmf and mkarf. During the Chandra observation of 2016+112 the background detected on the ACIS CCD S3 was fairly constant with a rate of approximately 4.4 10-7 counts s-1 pixel-1 within the energy band 0.4 to 8 keV and for events with standard ASCA grades 0,2,3,4,6. Our simple spectral fit to the Chandra composite spectrum of all point sources within 3.5 arcmin centered on 2016+112 yields a 2-10 keV X-ray luminosity of LX = 9.0 erg s-1. The 2-10 keV X-ray luminosity reported for the ASCA observation of 2016+112 is LX = 8.4 erg s-1. We conclude that the X-ray flux attributed to a galaxy cluster in the lens plane of the 2016+112 GL system is accounted for by point-like X-ray sources resolved by Chandra.
We compared the locations of the X-ray sources detected with Chandra in the field of 2016+112 (Table 2) to those detected in the optical with the Nordic Optical Telescope (Table 1 in Soucail et al. 2000). We find no matches within 5′ of 2016+112, indicating that the detected X-ray sources are not associated with the galaxies detected by Soucail et al. (2000) that are bound to the = 1.01 cluster. We also searched the USNO catalog and found no optical counterparts to the X-ray sources.
3. CLUSTER MASS AND MASS-TO-LIGHT ESTIMATES
The lenses of several candidate gravitationally lensed systems with image separations larger than 3 arcsec have eluded detection in the optical and radio bands. These non-detections have lead to the hypothesis of the existence of large dark matter lenses with mass-to-light ratios (Schneider, Ehlers, and Falco 1992). The GL system 2016+112 was originally proposed as containing a dark matter lens based on the X-ray mass estimate of 3.6 1014 M⊙ within 500 kpc (Hattori et. al. 1997) and the blue luminosity of the lensing galaxy D.
As described in the introduction, recent deep optical and IR observations have detected several galaxy cluster members, significantly revising the luminosity of the cluster. Specifically, the reported value for the luminosity of the galaxy cluster members is 3.2 1011 LV⊙ within a radius of 400 kpc (Benitez et. al. 1999). The significant galactic extinction in the direction of 2016+112 has made it extremely difficult to obtain reliable estimates for the luminosities of the galaxy cluster members, even in the band. By applying the cluster virial theorem to 6 galaxies of the cluster Soucail et al. (2000) find a virial mass of = 2.8 1014 M⊙ within a radius of 350 kpc.
Our Chandra observations indicate that the cluster mass estimates based on previous X-ray measurements must be revised. In particular, Chandra has clearly resolved the three X-ray lensed images of 2016+112, and 13 additional point-like sources within 3.5 arcmin centered on the lensed AGN. Our estimated X-ray 2-10 keV fluxes within circles of radii 1 and 3.5 arcmin centered on 2016+112 and originating from point-like sources alone are 0.7 0.2 10-13 erg s-1 cm-2 and 1.3 0.1 10-13 erg s-1 cm-2, in good agreement with the reported values from similar sized regions of ROSAT HRI and ASCA. The ASCA spectrum of this source was therefore dominated by emission from point-like objects unrelated to the cluster. Any cluster parameters derived from the ASCA spectral analysis cannot be considered reliable. Also previous estimates of the cluster core radius and parameter based on the ROSAT HRI observations are incorrect. Obviously, the previously reported total mass of the cluster lens of 2016+112 derived from cluster parameters , rc and must be considered unreliable.
To estimate the upper limit on the X-ray luminosity of an extended component we extracted events within a 1.56 arcmin radius ( 0.8 Mpc) centered on 2016+112 and excluded all point sources within this region listed in Table 2. We used an iterative procedure to place 3 upper bounds on the intracluster temperature and 2-10 keV luminosity. We began with a initial guess of 3 keV for the cluster temperature and estimated the X-ray luminosity assuming a Raymond-Smith thermal spectrum for the ICM gas, a redshift of = 1.01, an abundance of 0.3 cosmic, and a column density (Galactic) of NH = 0.15 1022 cm-2. From the relation for clusters of galaxies (Markevitch, 1998), we select a new trial cluster temperature and repeat the calculation of the cluster luminosity. We repeat this iterative process untill the solution converges. We place a 3 upper limit of 3.7 keV on the cluster temperature and 3 upper limits of 1.7 1044 erg s-1 and 1.6 10-14 erg s-1 cm-2 on the 2-10 keV luminosity and flux of the cluster.
Using the empirically derived relation between total cluster mass and ICM temperature, M500 = 2.00 1015 M⊙ (TX/10 keV)3/2, where M500 is the mass within the radius r500, in which the mean overdensity is 500, and r500 = 2.37 Mpc (TX/10 keV)1/2, (Mohr, Mathiesen, & Evrard, 1999) we find that our temperature limit of 3.7 keV corresponds to a mass limit of, M500 4.5 1014 M⊙ with r500 = 1.44 Mpc. We use a luminosity from all galaxy types of LV = 1.28 1012 LV⊙ within a radius of 800 kpc, as derived by Benitez et. al. (1999), and our estimated upper-bound on the cluster mass to derive a mass-to-light ratio limit of M/L 190 (M⊙/LV⊙) within 800 kpc.
Our 7.7 ks Chandra observation does not yield any useful upper limit on emission from a possible redshifted Fe-K line originating from the cluster of galaxies. A much deeper observation of 2016+112 with the ACIS-I CCD that has lower background than the ACIS-S CCD may result in the detection and characterization of the properties of the distant z=1.01 cluster of galaxies. In addition to the cosmological implications of detecting clusters of galaxies at high redshifts, an estimate of the center of mass and mass distribution will improve gravitational lens models of this system. These improved models may yield an estimate for the Hubble constant and also provide the absolute distance to the lensing cluster.
4. X-RAY PROPERTIES OF LENSED AGN
The optical spectra of the lensed images of 2016+112 are quite unusual; strong and narrow emission lines of Ly, N, C, He and C at a redshift of 3.273 are detected in all images (Lawrence et al. 1984; Yamada et al., 1999). It has been recently proposed that the lensed object is a luminous type-2 quasar (Yamada et al. 1999). Here we define as a type-2 quasar an AGN that contains no broad optical emission-lines and is sufficiently luminous (i.e., LX (2-10 keV) 2 1044 erg s-1 ) to qualify as a quasar. We investigated the nature of the lensed object by estimating its unabsorbed X-ray luminosity. Unfortunately, the lensed AGN is quite faint in X-rays with 6, 5, and 12 detected counts in images A, B and C respectively. The similarity of the optical and radio spectra of images A and B suggests that they are produced from the gravitationally lensing of a background AGN by the giant elliptical galaxy D and the host cluster of galaxies. Yamada et al. (1999) conclude that the optical spectra of images A, B and C are consistent in showing a type-2 spectrum. Yamada et al. (1999) attribute the observed differences in the optical emission line ratios in images B and C to the different degree of photoionization of the lensed regions that produce the emission of these images. In particular, recent lens modeling of 2016+112 (Benitez et al. 1999) can reproduce the observed morphology, including the extended nature of image C, by placing the center of the lensed source just outside the magnification caustic and an extended emission component within the caustic. The optical emission in image C, thus, may arise from larger radii of the narrow line region (NLR), its radio emission from a possible jet, and its X-ray emission may be lensed synchrotron self Compton (SSC) emission from the jet. Since we are interested in estimating the unlensed luminosity of the central object we only consider the emission from images A and B. We modeled the Chandra spectrum of 2016+112 images A and B with an absorbed power-law with the Galactic contribution to the column density held fixed at NH = 0.15 1022 cm-2, an intrinsic absorption column at = 3.27 and a spectral slope fixed at 2. The 90% confidence range for the intrinsic absorption column is (3 - 85) 1022 cm-2. The luminosity in the rest frame 2-10 keV band corrected for lens magnification for the above range of intrinsic absorption is 3 1043 - 1.4 1044 erg s-1. We assumed magnification factors of 8.5 and 6 for the observed X-ray images A and B respectively, based on the lens models of Benitez et al. (1999). Our upper bound on the X-ray luminosity of the lensed object places it near the “grey” area between low and high luminosity AGN’s.
5. CONCLUSIONS
A Chandra observation of the GL system 2016+112
has clearly resolved the image components of this
system in agreement with previous optical and radio observations.
Derived parameters for the mass and M/L of
the lensing cluster based on previous X-ray observations are
unreliable due to the contamination produced by several
X-ray sources in the field.
Based on the non-detection of the lensing cluster of galaxies
in this 7.7ks Chandra observation we place a 3 upper limit
of 1.7 1044 erg s-1 on the 2-10 keV luminosity of the cluster.
We place upper limits on the mass and mass-to-light
ratio of the galaxy cluster of 2.5 1014 M⊙
and /LV 190 ⊙
within 800 -1 kpc, respectively.
With the detection of galaxy members of the cluster in the optical band
(Soucail et al., 2000; Benitez et al. 1999)
and the present revision of the cluster X-ray luminosity,
we conclude that the lensing cluster of 2016+112
can be ruled out as a dark cluster candidate.
The nature of the lensing source is still unclear.
We estimate that the X-ray luminosity of the
lensed object (corrected for intrinsic absorption and the magnification effect)
must be less than 1.4 1044 erg s-1 at
the 3 level which is within the range of a Seyfert galaxy.
We would like to thank M. Eracleous for helpful discussions and comments. We acknowledge financial support by NASA grant NAS 8-38252 and AST99-00703 (DPS).
| TABLE 1 | |||||
| Optical and X-ray Offsets of 2016+112 Images | |||||
| Telescope | (RA, Dec)A a | (RA, Dec)B a | (RA, Dec)C a | B/A b | C/A b |
| arcsec | arcsec | arcsec | |||
| HST | (0,0) | (-3.010,-1.506) | (-2.057,-3.255) | 0.97 0.02 | 1.20 0.04 |
| CHANDRA | (0,0) | (-2.9,-1.2) | (-2.0,-3.2) | 0.8 0.6 | 2 1.3 |
NOTES-
a Offsets in RA and Dec with respect to image A
b Image flux ratios.
The Chandra and HST flux ratios are calculated in the 0.4-8 keV
and H bands (centered on 1600 Å), respectively.
The HST offsets and flux ratios are taken from the
CfA-Arizona Space Telescope LEns Survey (CASTLES) of gravitational lenses
website http://cfa-www.harvard.edu/glensdata/.
| TABLE 2 | ||||
| Sources in the Near Vicinity of 2016+112 | ||||
| Object | RA (J2000) | DEC (J2000) | Distance a | Source Counts b |
| arcsec | cnts | |||
| CXO J201917.3+112751 | 20 19 17.37 | 11 27 51.8 | 39.9 | 42.9 6.5 |
| CXO J201920.1+112627 | 20 19 20.13 | 11 26 27.9 | 54.2 | 30.8 5.6 |
| CXO J201917.7+112555 | 20 19 17.78 | 11 25 55.7 | 78.0 | 23.9 4.9 |
| CXO J201921.3+112831 | 20 19 21.36 | 11 28 31.6 | 91.4 | 17.9 4.2 |
| CXO J201915.5+112458 | 20 19 15.58 | 11 24 58.5 | 140.2 | 34.6 5.9 |
| CXO J201916.0+112454 | 20 19 16.01 | 11 24 54.8 | 142.2 | 10.9 3.3 |
| CXO J201929.0+112855 | 20 19 29.06 | 11 28 55.0 | 190.2 | 14.8 3.9 |
| CXO J201921.6+112356 | 20 19 21.62 | 11 23 56.3 | 203.8 | 17.8 4.2 |
| CXO J201908.7+112434 | 20 19 8.782 | 11 24 34.3 | 210.3 | 12.8 3.6 |
| CXO J201930.3+112450 | 20 19 30.34 | 11 24 50.0 | 229.8 | 42.3 6.6 |
| CXO J201929.1+112931 | 20 19 29.11 | 11 29 31.9 | 212.5 | 14.9 3.9 |
| CXO J201931.4+112902 | 20 19 31.49 | 11 29 02.2 | 224.3 | 9.8 3.2 |
| CXO J201922.3+112227 | 20 19 22.35 | 11 22 27.5 | 292.6 | 11.4 3.5 |
NOTES-
a Distance from image 2016+112 C.
b Source counts extracted with the CXC software tool wavdetect
in the 0.4-8 keV band.
References
Angonin-Willaime, M.-C., Soucail, G., Vanderriest, C., 1994, A&A, 291, 411
Benitez, N., Broadhurst, T., Rosati, P., Courbin, F., Gordon, S., Lidman, C., & Magain, P., 1999, ApJ, 527, 31
Burud, I., Courbin, F., Lidman, C., Jaunsen, A. O., Hjorth, J., Ostensen, R., Andersen, M. I., Clasen, J. W., Wucknitz, O., Meylan, G., Magain, P., Stabell, R., and Refsdal, S., 1998, ApJ, 501, L5
Clowe, D., Trentham, N., and Tonry, J., 2000, A&A, astro-ph/0001309
Garrett, M. A., Walsh, D., and Carswell, R. F., 1992, MNRAS, 254, 27
Hattori, M., Ikebe, Y., Asaoka, I., Takeshima, T., Bohringer, H., Mihara, T., Neumann, D. M., Schindler, S., Tsuru, T., & Tamura, T., 1997, Nature, 388, 146
Kneib, J.-P., Soucail, G., Jaunsen, A., Hattori, M., Hjorth, J., & Yamada, T., 1998, CFHT Inf. Bull. 38.
Langston, G., Fischer, J. & Aspin, C., 1991, AJ, 102, 1253
Lawrence, C. R., Neugebauer, G. & Matthews, K. 1993, AJ, 105, 17
Lawrence, C. R., Schneider, D. P., Schmidt, M., Bennett, C, L., Hewitt, J. N., Burke, B. F., Turner, E. L., and Gunn, J. E., 1984, Science, 223, 46
Markevitch, M., 1998, , 504, 27
Mohr, J. J., Mathiesen, B. & Evrard, A. E., 1999, , 517, 627
Mushotzky, R., 1997, Nature, 388, 126
Schneider, D. P., Lawrence, C. R., Schmidt, M., Gunn, J. E., Turner, E. L., Burke, B. F. and Dhawan, V., 1985, ApJ, 294, 66
Schneider, D. P., Gunn, J. E., Turner, E. L., Lawrence, C. R., Hewitt, J. N., Schmidt, M. & Burke, B. F. 1986, AJ, 91, 991
Soucail, G., Kneib, J.-P., Jansen, A. O., Hjorth, J., Hattori, M., and Yamada, T., 2000, submitted to A&A, astro-ph/0006382
Yamada, T., S. Yamazaki, M. Hattori, G. Soucail, and J.- P. Kneib, submitted to A&A, astro-ph/9908089
Walsh, D., Carswell, R. F., & Weymann, R. J., 1979, Nature, 279, 381.