The halo model and numerical simulations
Abstract
Recently there has been a lot of attention focussed on a virialized halo-based approach to understanding the properties of the matter and galaxy power spectrum. A key ingredient in this model is the number and distribution of galaxies within dark matter halos as a function of mass. This quantity has been predicted from semi-analytic modeling and from fits to observational data. Here we present predictions for the occupation number and spatial distribution of sub-halos based on a high-resolution hydrodynamical simulation including cooling, star-formation and feedback.
Subject headings:
cosmology: theory – large-scale structure of universe1. Introduction
For hierarchical models of structure formation based on the inflationary cold dark matter paradigm, the clustering and evolution of dark matter halos is now quite well understood and can be reliably simulated using N-body techniques. In contrast, a theory for the formation and evolution of galaxies is one of the central unsolved problems in cosmology. Such a theory should at the very least specify the relationship between galaxies and the dark matter halos in which they reside, and it is this question which we wish to address.
Several authors (Ma & Fry 2000a ; 2000b ; Seljak 2000a ; Peacock Pea (2000); Peacock & Smith PeaSmi (2000)) have recently developed a new way of describing the non-linear clustering of dark matter and galaxies. This formalism postulates that all the mass in the universe lies in halos of various masses (Press & Schechter PreSch (1974)) and further that on large scales the halos cluster according to linear theory while on small scales the power is dominated by halo profiles (Neyman, Scott & Shane NeyScoSha (1953); Peebles Pee (1974)). The galaxies are assigned to halos using simple rules. While this model requires many ingredients to be fixed by numerical experiments (typically N-body simulations or semi-analytic modeling) it provides a useful structure for thinking about gravitational clustering which gives insights into several outstanding problems (see e.g. Seljak 2000a ; Peacock & Smith PeaSmi (2000); Seljak, Burwell & Pen SelBurPen (2000); Atrio-Barandela & Mucket AtrMuc (1999); Cooray, Hu & Miralda-Escude CorHuMir (2000); White Whi (2001); Scoccimarro et al. SSHJ (2001); Guzik & Seljak GuzSel (2000); Seljak 2000b ; Sheth et al. SDHS (2000)).
Here we shall be primarily interested in the 2-point function of galaxy clustering, either in Fourier space (the power spectrum) or real space (the correlation function). The 2-point function is one of the most fundamental quantities in large-scale structure. It is robust, but sensitive to several cosmological parameters such as the Hubble constant, the matter density and of course the primordial power spectrum. The key insight of the halo model is that an accurate prediction of this quantity requires a knowledge of the occupation number of galaxies in dark matter halos and their spatial distribution (see also Benson et al. BCFBL (2000)). With only these ingredients the model can make predictions about a wide variety of quantities of interest. In addition, these quantities allow one to “graft” galaxies onto pure N-body simulations of large-scale structure to make mock galaxy catalogues (Benson et al. BCFBL (2000); Peacock & Smith PeaSmi (2000)).
The occupation number distribution, and at the 2-point level, and the spatial distribution of galaxies thus make an ideal point of contact between observations and theory. They can, in principle, be predicted from a model of galaxy formation, and they can be measured observationally.
Seljak (2000a ) measured from semi-analytic models of structure formation (Kauffmann et al. KCDW (1999); but see also Somerville & Primack SomPri (1999) and Benson et al. BCFBL (2000)) and used this to make predictions for the clustering of galaxies. A similar procedure has been followed by Wechsler et al. (2000) where simulations are used in place of analytic techniques. Peacock & Smith (PeaSmi (2000)) and Scoccimarro et al. (SSHJ (2001)) took the opposite approach of trying to infer this distribution from observations as a check on semi-analytic modeling. The agreement between the two methods is at most qualitative at present. Here we present predictions for these functions from a cosmological hydrodynamic simulation which includes star-formation and feedback.
2. The simulation
Throughout, we shall use a new simulation of the Ostriker & Steinhardt (OstSte (1995)) concordance model, which has , , with , , and (corresponding to ). This model yields a reasonable fit to the current suite of cosmological constraints and as such provides a good framework for making realistic predictions.
We have used the Tree/SPH code Gadget (Springel, Yoshida & White SprYosWhi (2000)) to run a million particle simulation of this model in a periodic box of size Mpc. Equal numbers of gas and dark matter particles were employed, so and and the gravitational softening was kpc, fixed in comoving coordinates. The simulation was started at redshift and evolved to .
In addition to the gravitational interactions and adiabatic hydrodynamics, the code follows radiative cooling and heating processes in the presence of a UV radiation field in essentially the same way as described in Katz, Weinberg & Hernquist (KatWeiHer (1996)). We model the UV radiation field using a Haardt & Madau (HaaMad (1996)) spectrum with reionization at . Star formation (and feedback) is handled using a modification of the “multi-phase” model of Yepes et al. (YepKatKhoKly (1997)) and Hultman & Pharasyn (HulPha (1999)). Each SPH particle is assumed to model a co-spatial fluid of ambient hot gas, condensed cold clouds, and stars. Hydrodynamics is only followed for the hot gas phase, but the cold gas and stars are subject to gravity, add inertia, and participate in mass and energy exchange processes with the ambient gas phase. The algorithm will be described in more detail in a forthcoming paper.
From the simulation outputs at and 3 we have constructed catalogues of halos and their sub-halos using the algorithm Subfind described in detail in Springel et al. (SWTK (2000)). First, the Friends-of-Friends algorithm (with a linking length of ) is used to define a parent halo catalogue, and then bound sub-halos within each parent are identified. These sub-halos typically consist of cold, dense gas that has been able to efficiently cool and form stars and should be identified with galaxies in the real universe, at least statistically.
We have used a linking length of 0.15 rather than the more canonical 0.2 in defining the parent halos, because we found for the larger linking length neighboring halos were being linked with one then identified as a sub-halo of the other. While this problem is not eliminated entirely using 0.15, it is significantly reduced. Only very close halo pairs or triplets, possibly in the process of merging, are joined with this linking length. In some instances the FOF algorithm finds halos which are not bound; these halos are not included in the analysis.
At there are a total of 31,737 halos and 34,529 sub-halos with an average star formation rate of . At the numbers are 37,940 and 39,579 respectively, with an average star formation rate of .
3. Halo occupation number
We show in Figs. 1, 2 the distribution from the simulation. Ideally we would identify the sub-halos as galaxies by some observational property, such as luminosity or color. Unfortunately we are unable to reliably compute such properties from this simulation. Even though we track the star-formation rate in the simulation, the outputs are too infrequent to graft on population synthesis codes, and any transformation we apply to the outputs would simply introduce additional uncertainties and modeling into our predictions. Thus we have focussed on the number of sub-halos as a function of sub-halo (total) mass, sub-halo stellar mass and sub-halo “instantaneous” star-formation rate which we can reliably extract from the simulation. Additional modeling will be presented elsewhere.
Since the FOF groups can be irregular and their mass difficult to interpret, we compute spherically averaged masses using the group particles. The center of the halo is taken to be the point of minimum potential, considering the halo particles in isolation. This corresponds very closely to the densest particle and the most bound particle for all but the most disturbed systems. For the total halo mass we use the mass interior to a radius () inside of which the mean density is 500 times the critical density. For some sub-halos the halo is truncated before this radius in which case we use all of the bound mass in the halo. The stellar mass is simply the mass in stars within and the star formation rate is also summed over all star-forming particles within this radius.
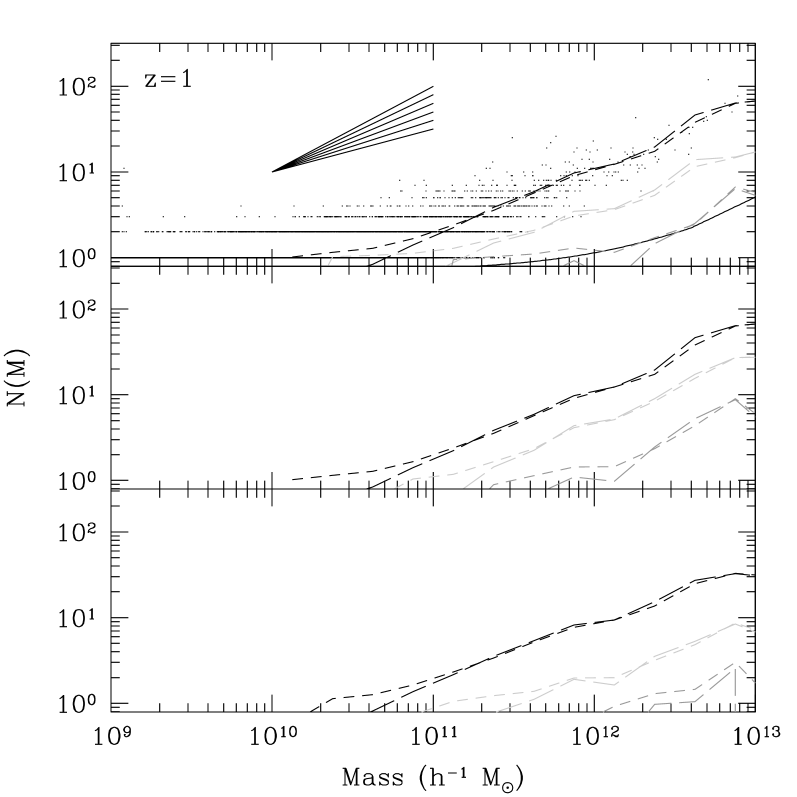
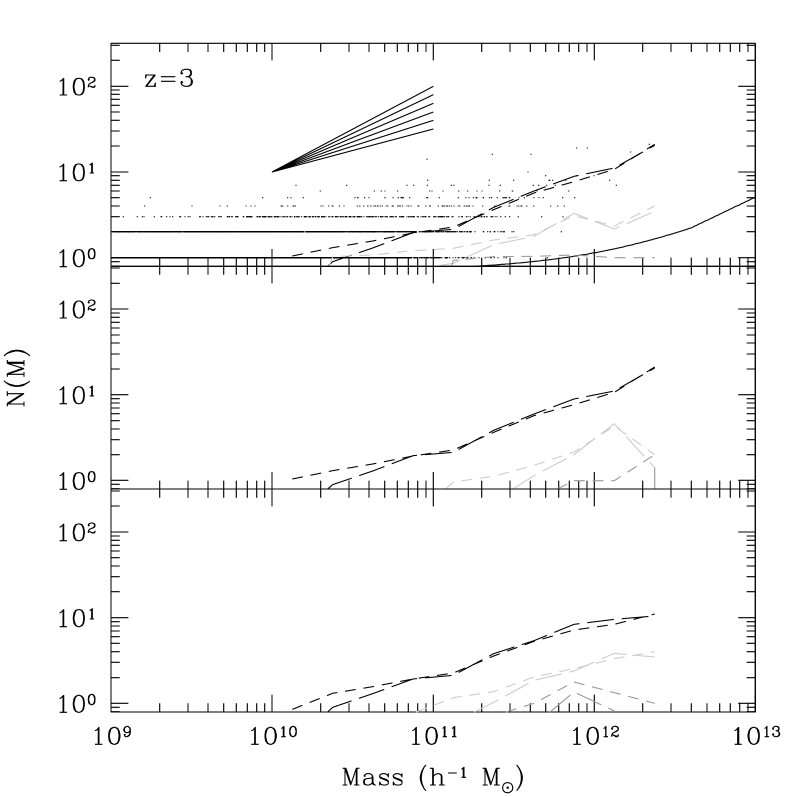
Note that for parent halos of a fixed mass there is a distribution of sub-halo occupation numbers. Statistically the distribution seems to be quite close to Poisson for but has less scatter than the Poisson prediction for , as is also seen in semi-analytic models. By definition all bound halos host at least one sub-halo. For all panels in Fig. 1 the distribution is close to a power-law, with a slope of , i.e. the number of sub-halos increases more slowly than the mass. At we again find that is well fit by a power-law, with a slightly shallower slope than at , being closer to , again increasing more slowly than the mass.
One could imagine that the decrease in may arise because the larger halos have longer gas cooling times, because mergers are more efficient or because a larger fraction of the total mass lies “outside” of the sub-halos. In our simulation we find that the both the mean sub-halo mass (as a fraction of the parent halo mass) and the fraction of the halo mass in sub-halos decline with increasing parent halo mass. At the low mass end the mean sub-halo mass and the fraction of the mass in sub-halos, using , are near 30%. For the higher mass halos this declines to and respectively. This suggests that all three effects are operating to some degree.
The predictions of the semi-analytic models of Kauffmann et al. (KCDW (1999)), as fit by Sheth & Diaferio (SheDia (2000)), are reproduced in Figs. 1, 2 as the lower solid line extending off the right of the figure. We can see in Fig. 1 that the semi-analytic models curve roughly agrees with our numerical results for sub-halos more massive than , but has fewer “galaxies” than we have sub-halos if we include less massive objects. This could partly be due to limited mass resolution in the simulations onto which are grafted the semi-analytic recipes, but is also because the semi-analytic formalism has explicitly inefficient star-formation in low mass halos.
4. Sub-halo spatial distribution
Another ingredient in the halo model is that all parent halos have NFW (Navarro, Frenk & White NFW (1996)) profiles111Or revised profiles which rise more steeply than as ., and that the satellite galaxy distribution follows the dark matter distribution. This obviously implies that different galaxy types trace each other within a given halo, which has not been shown. It remains unclear whether any type of galaxy follows the mass distribution.
To investigate this question we have calculated the mean number of sub-halos in radial bins, scaled to of the parent halo. Fig. 3 shows that there is an enhanced probability for sub-halos to reside at the center of the parent halo (i.e. one galaxy always resides at the center of the dark matter halo) and then the probability is rather flat with radial distance from the center. Because FOF with a linking length of 0.15 can occasionally link neighboring structures, a few sub-halos are found beyond the virial radius.

For comparison we show the cumulative mass within for two NFW profiles, one with and one with . The total mass is (arbitrarily) normalized to unity at . Apart from the central enhancement the sub-halos do approximately seem to follow the NFW profile, although they seem to be slightly more centrally concentrated than NFW would predict.
Very few of our halos have enough sub-halos for a robust determination of the velocity distribution of the sub-halos. However since the dark matter and the sub-halos live in the same potential and have similar spatial distributions, we expect that any degree of “velocity bias” would be small.
5. Conclusions
Many of the features of the power spectrum of density fluctuations in the universe can be simply understood in a model based on virialized halos. Important ingredients in the model are that the halos be biased tracers of the linear power spectrum and have a uniform profile with a correlation between the internal structure and the mass which should span a wide range sampling a Press-Schechter (PreSch (1974)) like mass function.
In order to understand the clustering of galaxies within such a model it is important to have a prediction for the occupation number distribution of galaxies in a halo of a certain mass and their spatial distribution within the halo. This quantity can be predicted by semi-analytic models of galaxy formation or estimated from observations. Here we have presented an estimate of this function spanning a wide range in halo masses from hydrodynamical simulations including cooling, star formation and feedback. (Previous efforts to study galaxy clustering directly from hydrodynamical simulations [e.g. Katz et al. KHW92 (1992, 1999); Gardner et al. GKHW97 (1997, 1999); Davé et al. DHKW (1999); Pearce et al. Pearce99 (1999)] typically had insufficient dynamic range to estimate the galaxy occupation number over such a wide range in halo mass.)
We find that the number of galaxies per halo is very close to a Poisson distribution, with a mean which grows more slowly than the mass of the parent halo. This holds true regardless of whether we select sub-halos based on total mass, stellar mass or star formation rate. The spatial distribution of sub-halos within their parent halos appears to follow the distribution of the total mass relatively well, with the number of sub-halos per spherical shell being approximately constant at large radius. Closer to the center of the halo there are more sub-halos than a halos-follow-mass model would predict.
Acknowledgments
We thank C.-P. Ma, J. Peacock and U. Seljak for helpful conversations about the halo model and the distribution. This work was supported in part by the Alfred P. Sloan Foundation and the National Science Foundation, through grants PHY-0096151, ACI96-19019 and AST-9803137.
References
- (1) Atrio-Barandela F., Mucket J.P., 1999, ApJ, 515, 465
- (2) Benson A.J., et al., 2000, MNRAS, 311, 793
- (3) Cooray A.R., Hu W., Miralda-Escude J., 2000, ApJ, 535, L9 [astro-ph/0003205]
- (4) Davé, R., Hernquist, L., Katz, N., Weinberg, D.H., 1999, ApJ, 511, 521
- (5) Gardner, J.P., Katz, N., Hernquist, L., Weinberg, D.H., 1997, ApJ, 484, 31
- (6) Gardner, J.P., Katz, N., Hernquist, L., Weinberg, D.H., 1999, preprint [astro-ph/9911343]
- (7) Guzik J., Seljak U., 2000, preprint [astro-ph/0007067]
- (8) Haardt F., Madau P., 1996, ApJ, 461, 20
- (9) Hultman J., Pharasyn A., 1999, A&A, 347, 769
- (10) Katz N., Hernquist L., Weinberg D.H., 1992, ApJ, 399, L109
- (11) Katz N., Hernquist L., Weinberg D.H., 1999, ApJ, 523, 463
- (12) Katz N., Weinberg D.H., Hernquist L., 1996, ApJS, 105, 19
- (13) Kauffmann G., Colberg J.M., Diaferio A., White S.D.M., 1999, MNRAS, 303, 188
- (14) Ma C.-P., Fry J.N., 2000a, ApJ, 531, 87
- (15) Ma C.-P., Fry J.N., 2000b, ApJ, 543, 503
- (16) Navarro J., Frenk C.S., White S.D.M., 1996, ApJ, 462, 563
- (17) Neyman J., Scott E.L., Shane C.D., 1953, ApJ, 117, 92
- (18) Ostriker J., Steinhardt P.J., 1995, Nature, 377, 600
- (19) Peacock J.A., 2000, preprint [astro-ph/0002013]
- (20) Peacock J.A., Smith R.E., 2000, MNRAS, 318, 1144
- (21) Pearce, F.R. et al., 1999, ApJ, 521, 99
- (22) Peebles P.J.E., 1974, A & A, 32, 197
- (23) Press W., Schechter P., 1974, ApJ, 187, 425
- (24) Scoccimarro R., Sheth R., Hui L., Jain B., 2001, ApJ, 546, 20
- (25) Seljak U., 2000a, MNRAS, 318, 203
- (26) Seljak U., 2000b, preprint [astro-ph/0009016]
- (27) Seljak U., Burwell J., Pen U.-L., 2000, preprint [astro-ph/0001120]
- (28) Sheth R., Diaferio A., Hui L., Scoccimarro R., 2000, preprint [astro-ph/0010137]
- (29) Sheth R., Diaferio A., 2000, preprint
- (30) Somerville R., Primack J., 1999, MNRAS, 310, 1087
- (31) Springel V., White S.D.M., Tormen G., Kauffman G., 2000, preprint [astro-ph/0012055]
- (32) Springel V., Yoshida N., White S.D.M., 2000, preprint [astro-ph/0003162]
- (33) Wechsler R., et al., 2000, preprint [astro-ph/0011261]
- (34) White M., 2001, MNRAS, 321, 1
- (35) Yepes G., Kates R., Khokhlov A., Klypin A., 1997, MNRAS, 284, 235