THE EMISSION REGIONS IN X-RAY BINARIES: DIPPING AS A DIAGNOSTIC
Abstract
X-ray dipping in the black hole binary Cygnus X-1, the Galactic jet source GRO J1655-40 and in low mass X-ray binaries is discussed. It is shown that spectral analysis strongly constrains emission models. Measurement of dip ingress/egress times allows the sizes of extended emission regions to be determined, notably for the Accretion Disk Corona which is responsible for Comptonization in X-ray binaries. In LMXB, the radius of the ADC is shown to be between and cm, an appreciable fraction of the accretion disk radius. This is inconsistent with Comptonization models requiring a localized Comptonizing region, for example, in the immediate neighbourhood of the neutron star. Results from a survey of LMXB using ASCA and BeppoSAX reveal an approximate equality between the height of the blackbody emission region on the neutron star and the height of the inner radiatively-supported disk, suggesting either that there is a direct causal link, such as a radial accretion flow between the inner disk edge and the star, or an indirect link, as in the case of accretion flow creep on the surface of the neutron star as suggested by Inogamov & Sunyaev. Finally, the survey shows that the blackbody cannot originate on the accretion disk as the required inner radii in many sources are substantially less than the neutron star radius.
X-RAY DIPPING
X-ray dipping consists of reductions in intensity that are generally at the orbital period due to absorbing material in a bulge in the outer accretion disk or in blobbiness in a stellar wind. Dipping allows emission processes to be determined unambiguously since the requirement to fit non-dip plus several dip spectra, especially using high quality instruments on ASCA, RXTE, BeppoSAX, XMM and Chandra, strongly contrains emission models. Dipping provides information in 2 ways: via spectra and via ingress/egress times which can give the size of emission regions, and of particular interest is the size of Accretion Disk Coronae (ADC) where Comptonization takes place. Dipping is relatively common, and in the following, dipping is discussed in the Black Hole Binary Cyg X-1, in the Galactic Jet Source GRO J1655-40 and in LMXB where 10% of sources are dippers.
DIPPING IN CYGNUS X-1


Dipping in the Low State of Cyg X-1, studied by Kitamoto et al. (1984), Ebisawa et al. (1996) and Bałucińska-Church et al. (1997, 2000a), is usually of short duration, lasting a few minutes, and results in an increase in hardness ratio as shown in the ASCA data of Fig. 1 (left). The spectrum of this state is dominated by a hard component plus a weak blackbody identified with the disk, plus a reflection component. During dipping, spectral evolution can be described below 10 keV (where reflection contributes little) by an absorber which progressively covers the extended ADC emission region with spectral model: ag*pcf*cpl where ag represents Galactic absorption, pcf is the covering fraction and cpl is a cut-off power law to represent the Comptonized emission.
Distribution of Dipping with Orbital Phase
An investigation of the variation of dipping with orbital phase by Bałucińska-Church et al. (2000a), revealed that there is a smooth variation peaking at phase zero (superior conjunction of the black hole) as shown in Fig. 1 (right), plus a second peak at phase 0.6 which is evidence for a stream from the Companion. The smooth variation with phase was shown to follow the variation of column density in the stellar wind of HDE 226868 with phase, although this is difficult to calculate accurately because of several factors including the variation of ionization state in three-dimensional space as a function of distance from the black hole, and the suppression of wind acceleration by X-ray illumination (Blondin 1994). The agreement indicates that dipping is due to blobs in the stellar wind.
Dip duration times can be used to determine blob sizes, giving cm (Kitamoto 1984) and from Rosat (see below) cm, which combined with column densities in dipping gives blob densities cm-3, times more dense than in the wind, from which it follows that there is a low ionization state in the blobs and suggesting that recombination into the blobs in the X-ray shadow will cause blob growth.
Size of the Accretion Disk Corona
Dipping allows the size of the Comptonizing region to be measured under conditions when the angular size of the absorber is greater than the angular size of the largest emission region. In Rosat PSPC observations (Bałucińska-Church & Church 1999), dipping was close to 100% deep indicating that this condition was met. Then the dip ingress time , typically 5–10 s, depends on the diameter of the major source region, i.e. the ADC. The velocity of absorbing blobs has a Keplerian component of 400 km at the radius of the Companion, plus additional wind velocity 2100 km s-1 (Herrero et al. 1995). Thus the ADC radius for an order of magnitude velocity of 2000 km s-1 is given by , so that is – cm.
In recent years, values of the Comptonization break energy in Cyg X-1 have become available, allowing constraints to be put on the electron temperature in the Comptonizing region. From Fig. 1 of Dove et al. (1997) a value of of 230 keV can be derived. The cut-off energy must be between and 3 for plasmas that are optically thin or optically thick to electron scattering respectively. Particular Comptonization models provide specific values of : e.g. = 150 keV, 0.3 (Haardt et al. 1993); 90 keV, 1.5 (Dove et al. 1997). We will assume that is between 77 and 230 keV and use these values to calculate the maximum radius of an ADC in hydrostatic equilibrium having , (where is the proton mass), i.e.
where is the ADC electron temperature in K. From this it follows that the maximum hydrostatic ADC radius is between 0.6–1.8 cm for the range of above. Thus the measured radius of the ADC is much smaller than the hydrostatic value in contrast with ADCs in LMXB discussed later. This implies strong differences between black hole and neutron star systems, presumably due to the effects of the neutron star in forming the ADC.
DIPPING IN THE GALACTIC JET SOURCE GRO J1655-40

Figure 2 shows part of the RXTE observation of 1997 Sept 27 – Oct 1 in which very strong dipping can be seen. The non-dip emission in this source is dominated by a disk blackbody comprising 90% of the 2–25 keV flux, with 10% Comptonized emission (Zhang et al. 1997) plus an iron line with highly red and blue shifted wings at 5.9 and 7.3 keV (Bałucińska-Church & Church 2000) which was the first detection of a disk line displaying a strong gravitational redshift in a Galactic source. Similar lines have been detected in 4U 1630-47 (Cui et al. 2000) and in XTE J1748-288 (Miller et al. 2000). Dipping has been investigated by Kuulkers et al. (1998, 2000) and by Bałucińska-Church (these Proceedings) who includes the disk line.
Dip spectra are well-described by a model: pcf* ( dbb + gau ) + ab*pl, where dbb is a disk blackbody term. The requirement that the Comptonized emission (pl) is modelled by a simple absorber indicates that the emission is less extended than the disk blackbody. The disk line intensity decreases (with very high significance), and can be modelled adequately by including it within the progressive covering term which is strong evidence that the line is real, and indicates that the line emission region is similar in size to that of the disk blackbody. Dip ingress/egress times show that the diameter of the disk blackbody emitter is Schwarzschild radii, i.e. 3.4–7.4 cm.
DIPPING IN LOW MASS X-RAY BINARIES


Firstly, examples will be shown of two dipping sources: XB 1916-053 and XB 1323-619. XB 1916-953 is of particular interest as the shortest period dipping LMXB with Porb = 50 min, implying the degenerate nature of the Companion and because of the 1% discrepancy between the X-ray and optical periods (Grindlay et al. 1988; Chou et al. (2000). Figures 3 and 4 show light curves and folded light curves in two energy bands from the 1997 observation with BeppoSAX (Church et al. 1998a). It can be seen that dipping is close to 100% deep at all energies below 10 keV showing that the absorber has larger angular extent than all source regions.


Figure 4 (left) shows the non-dip broadband spectrum of the source in BeppoSAX showing dramatically that the spectrum extends to above 200 keV with a Comptonization break energy of keV (Church et al. 1998a; see also Bloser et al. 2000). Determination of the properties of the Comptonizing region, i.e. the ADC, depends on obtaining which requires an energy response to at least 100 keV. The high value of implies a high value of . This contrasts with earlier work on LMXB in the limited band of 1–10 keV where values of 3 keV were often (erroneously) obtained due to other sources of curvature in the spectrum, which would give incorrect values for Comptonization parameters. Figure 4 (right) shows the corresponding dip spectra in the LECS and MECS instruments revealing the apparently complex evolution in dipping, one part of the spectrum above 4 keV heavily absorbed while the part below 4 keV is unabsorbed. Conventionally, such spectra were modelled by assuming two components, one absorbed but the other not, the unabsorbed component having a strongly decreasing normalization in dipping (e.g. Parmar et al. 1986). However, this decrease was difficult to explain physically. These non-dip and dip spectra were well-fitted by a two component model consisting of point-like blackbody emission identified with the neutron star plus

extended Comptonized emission from an ADC (Church et al. 1997), expressed as: I =
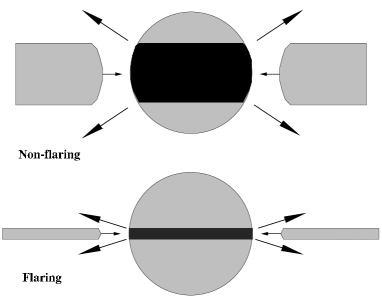
where and are the extra column densities of the blackbody and cut-off power law in dipping, and is the constant interstellar column density. This gave a simple explanation of spectral evolution during dipping. It is envisaged that a dense absorber of large angular extent moves across the source regions such that the extended ADC emission is progressively covered by increasing amounts, the covering fraction
rising smoothly from zero to 100% (Fig. 5). The point-like blackbody is at some stage almost instantly covered and so rapidly removed. In this approach the unabsorbed part of the spectrum is naturally explained as the uncovered ADC emission. All dipping sources with an unabsorbed part of the spectrum have now been explained in this way (Church et al. 1997, 1998b; Bałucinska-Church et al. 2000b; Smale et al. 2000).

XB 1323-619 exhibits both dipping and quasi-periodic bursting. The burst period has decreased from 5.30–5.43 hr during the Exosat observation (Parmar et al. 1989) to a value during the BeppoSAX observation of hr, compared with an orbital (dip) period of hr (Bałucińska-Church et al. 1999). Thus bursts frequently occur during X-ray dips providing a unique diagnostic of the dramatic effects of a burst on the accretion disk. The light curve shown in Fig. 6 contains several bursts in dips indicated with an asterix. None of these shows the marked decrease in intensity expected for the measured increase in obtained during dipping. Figure 7 compares spectral fitting of a normal burst with a burst in a dip (peak spectra). Attempts to fit the burst in a dip with neutral absorber totally fail (left-hand panel), whereas use of an ionized absorber model provides a reasonable fit, thus supporting the idea, previously suggested by Smale (1992) and Yoshida (1993) in the case of bursts in dips in XB 1916-053 that the outer disk, and thus all of the disk, becomes highly ionized during a burst.

Emission Models for Dipping LMXB
Many different types of model have been used for LMXB including one-component models with bremmstrahlung, blackbody, or Comptonized emission, and also two-component models based on these. In the dipping sources, fitting is much more constrained by the requirement to fit non-dip and several dip spectra, and it has been shown that a blackbody plus Comptonization model is able to fit all of the sources (Church & Bałucińska-Church 1993, 1995; Church et al. 1997, 1998a, Smale et al. 2000). More recently the same model was shown to fit a range of Atoll and Z-track sources (Church & Bałucińska-Church 2000). These authors were able to show that the
blackbody is point-like emission identified with the neutron star and that the Comptonized emission is extended as it is removed gradually in dipping and is identified with ADC emission. The size of this region may be measured using dip ingress times in the dipping sources (below).
Although individual sources may be more complicated with line emission also detected, and the ADC emission can vary in radius, and optical depth to electron scattering, there is now strong evidence that these two basic components are present in all LMXB (Church & Bałucińska-Church 2000), the fraction of blackbody however varying between a very small fraction to 50% of the total flux. The question of whether the blackbody is from the neutron star or disk which has been controversial is discussed later.
Deductions about Emission Regions: size of ADC
Firstly, we summarise recent work in which dip ingress/egress times are used to derive the size of emission regions. For dipping which is 100% deep (at any energy) the absorber must be of larger angular extent that the emission regions, and so the ingress time t gives the diameter of the largest source region, i.e. the ADC. The diameter via:
where is the accretion disk radius calculated using standard theory, and P is the orbital period. Table 1 shows for several dipping LMXB obtained from recent work. In the case of XB 1916-053, the extreme mass ratio between the neutron star and the low mass Companion makes the disk radius calculation uncertain, and the circularization radius is used as a lower limit. The fraction of the disk covered by the ADC is also shown, 15% for several sources but is as low as 2.5% in the faint source XBT 0748-676 and as high as 52% in the bright source X 1624-490.
| (s) | (cm) | P (hr) | (cm) | ref. | ||
|---|---|---|---|---|---|---|
| XB 1916-053 | 13020 | 0.83 | 11% | Church et al. (1997) | ||
| XB 1323-619 | 250-600 | 2.93 | 2.2-5.4 | 7.5-18% | Bałucińska-Church et al. (1999) | |
| X 1624-490 | 12,5002,500 | 20.87 | 52% | Bałucińska-Church et al. (2000b) | ||
| XBT 0748-676 | 11030 | 3.82 | 2.5% | Church et al. (1998b) | ||
| X 1755-338 | 800200 | 4.46 | 16% | Church & Bałucińska-Church (1993) |
Next, spectral fitting results are used in Table 2 to constrain the electron temperature of the ADC, assumed constant. In the first three cases, BeppoSAX data allowed the break energy to be derived with confidence.
| (keV) | (keV) | (cm) | (cm) | |
|---|---|---|---|---|
| XB 1916-053 | 80 | 24-80 | 2.4-7.9 | |
| XB 1323-619 | 44 | 13-44 | 4.3-15 | 2.2-4.5 |
| X 1624-490 | 12 | 4-12 | 16-53 |
is given as a range allowing for the extreme possibilities that the ADC is optically thin to electron scattering and = or is optically thick with 3 = (Haardt et al. 1993). The maximum radius of an ADC in hydrostatic equilibrium is given by Eqn 1. Thus the values is Table 2 correspond to the high limit on the left for each source. Measured values of are included in the Table.
Comparison of and shows that for the first two relatively faint sources XB 1916-053 and XB 1323-619, there is agreement between the measured and the high- hydrostatic radius. For the bright source X 1624-490, there is also agreement, but with the low- value suggesting that the ADC has higher optical depth . In this case, a value of 5.7 was derived using the power law index of the spectrum, consistent with the above. Thus, dipping ingress measurements show that the ADC covers a substantial fraction of the accretion disk, and in this limited sample, the ADC radius agrees with the maximum hydrostatic radius beyond which kT exceeds the gravitational force on an element of the medium and the ADC will be dissipated as a wind.
THE BLACKBODY SOURCE IN LMXB


In a survey of LMXB based on ASCA and BeppoSAX data, the two-component model previously applied to dipping sources was shown to give good descriptions of all of the LMXB sources tested (Church & Bałucińska-Church 2000), and so is a good model for LMXB in general. In Fig. 8 (left), the blackbody luminosity is plotted against the total luminosity (1–30 keV) and compared with the Newtonian value of 50% of the accretion luminosity (dotted line). It appears that in fainter sources there is a tendency for to be a smaller fraction of the total. These data were replotted in terms of the emitting area on the neutron star assumed to be an equatorial strip of half-height h. Then the emitting area of the star (a sphere intersected by two parallel planes) is = , where the blackbody radius is obtained from the measured flux. It is assumed that the inner part of the accretion disk is radiatively supported, for erg , with half-height H increasing as a steep function of radius to a value as given in standard theory by:
In Fig. 8 (right), h is plotted against calculated by obtaining from . It can be seen that there is reasonable agreement between these quantities except for lower luminosity sources. However, in these cases, the radiative disk is unable to reach its full equilibrium height. Figure 9 shows the radiative inner disk for three luminosities demonstrating that only for erg does the disk reach a stable value, i.e. .
Because of this, the half-height of the disk was recalculated at the position where the radiation pressure is 10 times the gas pressure , as a good approximation to the radiative disk height (Czerny & Elvis 1987). The data were replotted in Fig. 10 (left), which showed good agreement between h and over a wide range of source luminosity (Church & Bałucińska-Church (2000), as indicated schematically in Fig. 10 (right). Two possible explanations exist: i) the disk height directly determines h, ii) H is a measure of and some other physical process determines h. Preliminary results indicate encouraging agreement between these results and the height of the emitting region on the neutron star predicted by the theory of Inogamov & Sunyaev (1999) on the basis of accretion flow creep over the surface of the neutron star. However, direct flow across the gap between the steep inner disk edge and the star cannot be ruled out.


Application to Flaring in X 1624-490

If the agreement h = H is regarded as a model governing the level of blackbody emission (although the mechanism is not established), there is already one situation in which the model can explain the observed behaviour of a source, i.e. flare evolution in X 1624-490. This flaring lasts for several thousand seconds, and in the 4-day observation using RXTE in 1999, September, flaring was particularly strong (Fig. 11, Smale et al. 2000; Bałucińska-Church et al. 2000c). Spectral analysis shows that during this flaring, increases as previously found (White et al. 1985), but the blackbody radius decreases substantially. In Fig. 12 (left), h is plotted against , and shown by the solid curve.

If we assume that h = H also holds during flaring, then the radiative disk height will be reduced in flaring (Fig. 12, right). A possible explanation of this the high radiative flux of the blackbody during flaring, with increased luminosity and reduced area, removes the upper and lower parts of the inner accretion disk (Bałucińska-Church et al. 2000c). This reduces so terminating the flare. This process constitutes a previously unknown Eddington limit.
Neutron Star Blackbody or Disk Blackbody ?
The results of the ASCA and BeppoSAX survey of LMXB strongly indicates that the blackbody originates on the neutron star since there would be no reason to expect a relation h = H if the emission was from the disk. However, the sources included in the survey were also analysed using a multi-colour disk (MCD) blackbody (Mitsuda et al. 1984) plus Comptonization model with the results for inner radius shown in Table 3. The ranges of inner radius values include uncertainty in inclination angle and 90% confidence fitting uncertainties.
| source | ri (km) | source | ri (km) | ||
|---|---|---|---|---|---|
| Ser X-1 | 2.7–4.7 | GX 9+9 | 10–17 | ||
| X 2127+119 | 0.79–1.1 | GX 13+1 | 11–19 | ||
| Aql X-1 | 2.8–4.8 | 4U 1636-536 | 14–24 | ||
| XB 1746-371 | 1.0–1.4 | GX 5-1 | 15–26 | ||
| XB 1254-690 | 2.0–2.92.1 | Cyg X-2 | 8.6–9.8 | ||
| XB 1916-063 | 0.48–0.670.13 | ||||
| XB 1323-619 | 0.48–0.670.01 | ||||
| X 1624-490 | 0.39–0.41 |
In 8 cases, the inner disk radius of the disk blackbody is than the neutron star radius; in other cases the power law flux increases with energy which is also unphysical. It is known that the MCD model can underestimate the inner radius, however, the maximum correction factors that have been proposed are 2–4 (Merloni et al. 2000; Kubota et al. 2000), so that allowing for this, the very small values of in Table 3 make it unlikely that the emission is from the disk, supporting the idea that disk photons are essentially completely reprocessed by Comptonization in the ADC.
CONCLUSIONS
X-ray dipping can be regarded as a powerful diagnostic of the X-ray emission regions as analysis of spectral evolution during dipping strongly constrains emission models. Moreover, measurement of dip ingress and egress times allows emission regions sized to be determined, and in particular has revealed the very extended nature of the ADC in LMXB with radii of – cm, suggesting the strong effect of the central object in both the formation and heating of the ADC. These measurements exclude the possibility that the Comptonizing region can be a localised region such as in the vicinity of the neutron star. The recent survey of LMXB based on ASCA and BeppoSAX data has demonstrated that the height of the blackbody emitting region on the neutron star is equal to the height of the radiatively supported inner disk. This result will allow comparison with theory of flow between inner disk and star and of the state and geometry of the inner disk. Finally, this survey has shown that the blackbody component cannot originate in the accretion disk.
References
- [1]
- [2] Bałucińska-Church M., and M. J. Church, The cessation of flickering in Cygnus X-1 during dips from Rosat and ASCA data, MmSAI 70, 1145-1150, 1999.
- [3]
- [4] Bałucińska-Church M., and M. J. Church, Discovery of a red- and blue-shifted iron disc line in the Galactic jet source GRO J1655-40, MNRAS 312, L55-L59, 2000.
- [5]
- [6] Bałucińska-Church M., T. Takahashi, Y. Ueda, M. J. Church, T. Dotani, et al., The cessation of flickering during dips in Cygnus X-1, ApJ 480, L115-L119, 1997.
- [7]
- [8] Bałucińska-Church M., M. J. Church, T. Oosterbroek, A. Segreto, R. Morley R., et al., An X-ray study of the dipping low mass X-ray binary XB 1323-619, A&A 349, 495-504, 1999.
- [9]
- [10] Bałucińska-Church M., M. J. Church, P. A. Charles, F. Nagase, J. La Sala, et al., The distribution of X-ray dips with orbital phase in Cygnus X-1, MNRAS 311, 861-868, 2000a.
- [11]
- [12] Bałucińska-Church M., P. J. Humphrey, M. J. Church, and A. N. Parmar, A study of the dipping low mass X-ray binary X 1624-490 from the broadband BeppoSAX observation, A&A 360, 583-591, 2000b.
- [13]
- [14] Bałucińska-Church M., R. Barnard, M. J. Church, and A. P. Smale, Spectral evolution during flaring in X 1624-490, A&A in preparation, 2000c.
- [15]
- [16] Blondin J. M., The shadow wind in high-mass X-ray binaries, ApJ 435, 756-766, 1994.
- [17]
- [18] Bloser P. F., J. E. Grindlay, D. Barret, and L. Boirin, RXTE studies of X-Ray spectral variations with accretion rate in 4U 1915-05, ApJ 542, 989-999, 2000.
- [19]
- [20] Chou Y., J. E. Grindlay, and P. F. Bloser, Timing analysis of the light curve of the dipping-bursting X-ray binary X1916-053, ApJ in press, 2000
- [21]
- [22] Church M. J., and M. Bałucińska-Church, Cosmic-abundance dips in X 1755-33, MNRAS 260, 59-66, 1993.
- [23]
- [24] Church M. J., and M. Bałucińska-Church, A complex continuum model for the low-mass X-ray binary dipping sources: application to X 1624-49, A&A 300, 441-445, 1995.
- [25]
- [26] Church M. J., and M. Bałucińska-Church, Results of a LMXB survey: variation in the height of the neutron star blackbody emission region, A&A submitted, 2000.
- [27]
- [28] Church M. J., K. Mitsuda, T. Dotani, M. Bałucińska-Church, K. Mitsuda, et al., Simple photoelectric absorption during dipping in the ASCA observation of XB 1916-053, ApJ 491, 388-394, 1997.
- [29]
- [30] Church M. J., A. N. Parmar, M. Bałucińska-Church, T. Oosterbroek, D. Dal Fiume, et al., Progressive covering in dipping and Comptonization in the spectrum of XB 1916-053 from the BeppoSAX observation, A&A, 338, 556-562, 1998a.
- [31]
- [32] Church M. J., M. Bałucińska-Church, T. Dotani, and K. Asai, Progressive covering of the accretion disk corona during dipping in the low mass X-ray binary XBT 0748-676, ApJ 504, 516-521, 1998b.
- [33]
- [34] Cui W., W. Chen, and S. N. Zhang, Evidence for Doppler-shifted iron emission lines in black hole candidate 4U 1630-47, ApJ 529, 952-960, 2000.
- [35]
- [36] Czerny B., and M. Elvis, Constraints on quasar accretion disks from the optical/ultraviolet/soft X-ray big bump, ApJ 321, 305-320, 1987.
- [37]
- [38] Dove J. B., J. Wilms, M. Maisack, and M. C. Begelman, Self-consistent thermal accretion disk corona models for compact objects, ApJ 487, 759-768, 1997.
- [39]
- [40] Ebisawa K., Y. Ueda, H. Inoue, Y. Tanaka, and N. E. White, ASCA observations of the iron line structure in Cygnus X-1, ApJ 467, 419-434, 1996.
- [41]
- [42] Grindlay J. E., C. D. Bailyn, H. Cohn, P. M. Lugger, J. R. Thorstensen, et al., Discovery of a possible X-ray triple - 4U 1915-05, ApJ 334, L25-L29, 1988.
- [43]
- [44] Haardt F., C. Done, G. Matt, and A. C.Fabian, The high-energy spectrum of Cygnus X-1 revisited, ApJ 411, L95-L98, 1993.
- [45]
- [46] Herrero A., R. P. Kudritzki, R. Gabler, J. M. Vilchez, and A. Gabler, Fundamental parameters of galactic luminous OB stars. II. A spectroscopic analysis of HDE 226868 and the mass of Cygnus X-1, A&A 297, 556-566, 1995.
- [47]
- [48] Inogamov N. A., and R. A. Sunyaev, Spread of matter over a neutron-star surface during disk accretion, Astron Lett 25, 269-293, 1999.
- [49]
- [50] Kitamoto S., S. Miyamoto, Y. Tanaka, T. Ohashi, Y. Kondo, et al., Transient dips of Cygnus X-1 observed from TENMA, PASJ 36, 731-740, 1984.
- [51]
- [52] Kubota A., Y. Tanaka, K. Makishima, Y. Ueda, T. Dotani, et al., Evidence for a black hole in the X-ray transient GRS 1009-45, PASJ 50, 667-673, 2000.
- [53]
- [54] Kuulkers E., R. Wijnands, T. Belloni, M. Méndez, M. van der Klis, et al., Absorption dips in the light curves of GRO J1655-40 and 4U 1630-47 during outburst, ApJ 494, 753-758, 1998.
- [55]
- [56] Kuulkers E., J. J. M. in’t Zand, R. Cornelisse, J. Heise, A. K. H. Kong, et al., Turmoil on the accretion disk of GRO J1655-40, A&A 358, 993-1000, 2000.
- [57]
- [58] Merloni A., A. C. Fabian, and R. R. Ross, On the interpretation of the multicolour disc model for black hole candidates, MNRAS 313, 193-197, 2000.
- [59]
- [60] Miller J. M., D. W. Fox, T. DiMatteo, R. Wijnands, T. Belloni, et al., Relativistic iron emission and disk reflection in galactic microquasar XTE J1748-288, ApJ in press, 2000.
- [61]
- [62] Mitsuda K., H. Inoue, K. Koyama, K. Makishima, M. Matsuoka, et al., PASJ 36, 741, 1984.
- [63]
- [64] Parmar A. N., N. E. White, P. Giommi, and M. Gottwald, The discovery of 3.8 hour periodic intensity dips and eclipses from the transient low-mass X-ray binary EXO 0748-676, ApJ 308, 199-212, 1986.
- [65]
- [66] Parmar A. N., M. Gottwald, M. van der Klis, and J. van Paradijs, The discovery of 2.93 hour periodic intensity dips from X 1323-619, ApJ 338, 1024-1032, 1989.
- [67]
- [68] Smale A. P., The infrared counterpart of X1323-619, AJ 110, 1292-1294, 1995.
- [69]
- [70] Smale A. P., M. J. Church, and M. Bałucińska-Church, The ephemeris and dipping spectral behavior of X 1624-490, ApJ in press, 2000.
- [71]
- [72] White N. E., A. Peacock, and B. G. Taylor, EXOSAT observations of broad iron K line emission from Scorpius X-1, ApJ 296, 475-480, 1985.
- [73]
- [74] Yoshida K., Thesis, Tokyo University, 1993.
- [75]
- [76] Zhang S. N., K. Ebisawa, R. A. Sunyaev, Y. Ueda, B. A. Harmon, et al., Broadband high-energy observations of the superluminal jet source GRO J1655-40 during an outburst, ApJ 479, 381-387, 1997.
- [77]