Young star clusters in the Large Magellanic Cloud: NGC 1805 and NGC 1818
Abstract
We present colour-magnitude diagrams for two rich (104M☉) Large Magellanic Cloud star clusters with ages 107 years, constructed from optical and near-infrared data obtained with the Hubble Space Telescope111”Based on observations with the NASA/ESA Hubble Space Telescope, obtained at the Space Telescope Science Institute, which is operated by the Association of Universities for Research in Astronomy, Inc. under NASA contract No. NAS5-26555.”. These data are part of an HST project to study LMC clusters with a range of ages. In this paper we investigate the massive star content of the young clusters, and determine the cluster ages and metallicities, paying particular attention to Be star and blue straggler populations and evidence of age spreads. We compare our data to detailed stellar population simulations to investigate the turn-off structure of 25 Myr stellar systems, highlighting the complexity of the blue straggler phenomenon.
keywords:
globular clusters: individual: NGC 1805, globular clusters: individual: NGC 1818, globular clusters: general, galaxies: individual: Large Magellanic Cloud, blue stragglers, stars: emission-line, Be1 Introduction
Unlike the Milky Way, the Magellanic Clouds contain a population of young (106-107 yr) rich star clusters, sometimes called populous clusters. These clusters have been popular targets for studies of stellar evolution and cluster formation. With HST, deep colour-magnitude diagrams can be produced, even of the dense central regions of the clusters.
Of particular interest is whether these clusters show an age spread amongst the massive stars, providing evidence for the currently unknown duration of cluster formation. An age spread amongst the turn-off stars would appear as a spread in colour larger than the measured errors. The age spread in some clusters, e.g. Trapezium [Prosser et al. 1994], NGC6531 [Forbes 1996], is small, only a few dynamical times. It has been argued [Elmegreen 2000] that the star formation timescale is of this order on all spatial scales. On the other hand some clusters show evidence for larger age spreads, e.g. NGC1805 [Caloi & Cassatella 1998], and longer star formation timescales are required in some models of the initial mass function based on clump or protostar interactions. The timescale for cluster formation has implications for the efficiency of star formation. If the star formation timescale is short ( the dynamical time) then, for the cluster to remain bound, the efficiency must be high. If the star formation timescale is longer then the efficiency can be lower, as gas can be removed without disrupting the cluster [Elson et al. 1987, Geyer & Burkert 2000].
The search for age spreads is complicated by the presence in the clusters of Be stars and blue stragglers. The Be and blue straggler populations are also interesting to study in their own right, especially because the factors affecting the numbers of blue stragglers and Be stars are not well understood. The unique young, metal-poor and rich environment of the young Magellanic clusters therefore provides a useful addition to the parameter space studied.
Blue stragglers are stars that are bluer and brighter than the main sequence turn-off. They are thought to be produced by the merger of two normal cluster stars, either in a primordial binary system, or through direct stellar collisions, or both. All Galactic globular clusters that have been surveyed contain some blue stragglers, though the fraction of blue stragglers varies greatly, even between similar clusters. Some Galactic open clusters also contain blue stragglers. Blue stragglers are found in open clusters of all ages [Ahumada & Lapasset 1995]. In the Magellanic Clouds, blue straggler stars have been found in old (NGC121 [Shara et al. 1998], NGC1466 & NGC2257 [Johnson et al. 1999]) and young (NGC330 [Keller et al. 2000]) clusters.
Be stars are non-supergiant (luminosity class V to III) B type stars that show or once have shown Balmer emission [Jaschek et al. 1981]. It is widely accepted that the Be phenomenon is associated with rapid rotation of the stellar photosphere, and the presence of a circumstellar disk that gives rise to the line emission. It has also been observed that Be stars are redder in V-I than normal B stars [Grebel 1997, Keller et al. 1999], and that those with the strongest H emission are also the reddest e.g. [Dachs et al. 1988]. 1988). The reason for this reddening is not entirely clear, but it seems likely that continuum emission from the disk plays a large part. There is also possibly some effect from a change in spectral energy distribution due to rotational distortion of the stellar atmosphere. Keller et al. [Keller et al. 2000] find that the Be star fraction peaks at the main sequence turn-off, which suggests that the Be star phenomenon occurs at a specific evolutionary stage. There are however differences in Be star fraction amongst clusters of the same age, and some evidence that metallicity also affects the Be star fraction [Maeder et al. 1999].
The two young clusters discussed in this paper are the LMC clusters, NGC 1805 and NGC 1818. Both clusters are located in the north west part of the LMC, kpc from the centre, in fairly low density regions. Previous measurements of the cluster parameters are summarized in Table 1.
| NGC1818 | |||
| Position (J2000) | 5:04:14, 66:26:05 | ||
| MV | -8.8 | 1 | |
| Mass (M☉) | 2 | ||
| Metallicity [Fe/H] | -0.4∗ | spectroscopy | 3,4,5 |
| Age (Myr) | 20-40 | ground-based images | 6 |
| 20 | HST images | 2 | |
| Reddening E(B-V) | 0.1 | spectroscopy | 4 |
| 0.07 | IUE spectroscopy | 7 | |
| 0.05 | integrated IUE colours | 8 | |
| 0.07 | ground based images | 6 | |
| 0.05 | HST images | 2 | |
| log(Dyn. time) (Myr) | 6.2-7 | 9 | |
| NGC1805 | |||
| Position (J2000) | 5:02:21, 66:06:44 | ||
| MV | -7.9 | 1 | |
| Mass () | |||
1 van den Bergh [van den Bergh 1981] * see text
2 Hunter et al. [Hunter et al. 1997]
3 Jüttner [Jüttner 1993]
4 Jüttner et al. [Jüttner et al. 1993]
5 Korn et al. [Korn et al. 2000]
6 Will et al. [Will et al. 1995]
7 Cassatella et al. [Cassatella et al. 1987]
8 Meurer et al. [Meurer et al. 1990]
9 Elson et al. [Elson et al. 1987]
Prior to this work, no colour-magnitude diagram (CMD), ground based or other, existed for NGC 1805. NGC 1818 has been relatively well studied. There have been several attempts to measure the abundances of stars in NGC1818. High resolution spectroscopy of LMC cluster and field stars [Korn et al. 2000, Jüttner 1993, Jüttner et al. 1993] has found similar abundances for the clusters and the field. It is likely therefore that NGC1818 and NGC1805 have metallicities of [Fe/H]-0.4 (the canonical value for the LMC). However, we note that no abundance measurements exist for NGC1805, and that there are only two stars with reliably measured abundances in NGC1818 (stars D1 and D12 in Korn et al. 2000 and D12 in Jüttner et al. 1993). Previous HST observations of NGC1818 have been used to derive a mass function [Hunter et al. 1997] investigate the binary fraction and mass segregation [Elson et al. 1998], and search for Be stars and blue stragglers [Keller et al. 2000].
The new observations in this paper are part of the large HST project GO7307, details of which can be found in Beaulieu et al. [Beaulieu et al. 2000].
2 Observations and Data Reduction
For both clusters we obtained HST WFPC2 F555W (V) and F814W (I) and NICMOS Camera 2 F160W (H) observations. Our original intention was to use the larger field of view NICMOS Camera 3, but unfortunately this was out of focus during NICMOS’ lifetime. The images discussed here were centred on the clusters, and the PC and NIC2 contain most of the cluster cores (diameters arcsec). We obtained both short exposures to avoid saturating the brightest stars, and long exposures to provide good signal-to-noise well below the main-sequence turnoffs. Full details of the image set are given in Table 2.
| WFPC2 | |||
| filter | dataset | time (s) | |
| NGC1818 | NGC1805 | ||
| F555W | u4ax3001r | u4ax0201r | 5 |
| u4ax3002r | u4ax0202r | 5 | |
| u4ax3003r | u4ax0203r | 5 | |
| u4ax3004r | u4ax0204r | 140 | |
| u4ax3005r | u4ax0205r | 140 | |
| u4ax3006r | u4ax0206r | 140 | |
| F814W | u4ax3007r | u4ax0207r | 20 |
| u4ax3008r | u4ax0208r | 20 | |
| u4ax3009r | u4ax0209r | 20 | |
| u4ax300ar | u4ax020am | 300 | |
| u4ax300bm | u4ax020br | 300 | |
| u4ax300cr | u4ax020cr | 300 | |
| NICMOS2 | |||
| filter | dataset | time (s) | |
| NGC1818 | NGC1805 | ||
| F160W | n4ax29oaq | n4ax01ahq | 160 |
| n4ax29okq | n4ax01arq | 160 | |
| n4ax29omq | n4ax01atq | 514 | |
| n4ax29ooq | n4ax01avq | 514 | |
| n4ax29orq | n4ax01ayq | 514 | |
| n4ax29otq | n4ax01b0q | 514 | |
| n4ax29owq | n4ax01b3q | 514 | |
top) Available as Figure1top.jpg
bottom) Available as Figure1bot.jpg
top) Available as Figure2top.jpg
bottom) Available as Figure2bot.jpg
2.1 WFPC2 reductions
The individual exposures were combined using the IRAF task crrej, which sums the images and rejects cosmicrays. After combining we checked the magnitudes of bright stars in the combined and original images and adjusted the scalenoise parameter if necessary. Warm pixels were flagged using the warm pixel lists produced by STScI.
The NGC1805 long data contains earth light which has been reflected off the Optical Telescope Assembly baffles and secondary support and into the WFPC2. This reflected light raises the overall background of the field and often also produces cross shaped or diagonal stripes in the level of the background where the WFPC2 camera mirror supports vignette the scattered light. The vignetting is most prominent on the F814W images, with the worst affected observation being u4ax020am where the background is reduced by 30% in the stripe.
The striping in the F555W and F814W long images was removed from each individual image before combining by producing an image which just contained the stripe pattern and subtracting this ‘pattern image’ from the original image. The background sky level varied from image to image and so this was subtracted off each image before combining. The sum of the backgrounds was added back to the combined image.
Stars were detected on the F814W image using daofind, and their magnitudes were measured in the F555W and F814W images using both aperture (of 2 pixel radius) and point spread function (psf) fitting photometry, using the IRAF tasks phot and allstar respectively. TinyTim psfs [Krist & Hook 1997] were used for the psf fitting. The chi and sharpness values produced from the psf fitting, which measure the goodness of fit of the psf and the difference between the square of the width of the object and the square of the width of the psf, were used to eliminate extended objects and spurious detections such as residual cosmic rays and warm pixels. The magnitudes used in the final colour magnitude diagrams are aperture magnitudes, as it was found that these produced main sequences that were at least as narrow as those using the psf fitted magnitudes.
Spurious detections are found around bright stars and also along their diffraction spikes. We therefore removed all detections within 20-30 pixels of the centres of the bright stars and along the diffraction spikes. This masking was carried out on the F814W image where the stars are brightest and affect the largest surrounding area.
We have corrected the data for geometric distortion effects [Holtzman et al. 1995a] and charge transfer efficiency (CTE) effects [Whitmore et al. 1999]. For the short exposure (and hence low background) images used here the CTE correction can be quite large, especially for faint stars at high row numbers (eg 0.08 mags for a star with V16 at 400,700 in the F555W PC short image).
After correcting for CTE effects the magnitudes of stars on the short and long exposures were compared. It was found that the brightest stars common to both images (V17.5) were brighter in the short image than in the long image. Since CTE and other related effects are known to be more of a problem in low background exposures, it was decided to correct the short data to the long data. The short data are only used to get the magnitudes of the brightest stars and so a shift has been added to the short exposure magnitudes so that the long and short magnitudes of the bright stars are equal. Note that this discrepancy between long and short exposures is in the opposite sense to that found by Casertano [Casertano & Muchtler 1998]. Table 3 gives the shifts that were added to the short data.
| NGC1818 | NGC1805 | |||
|---|---|---|---|---|
| F555W | F814W | F555W | F814W | |
| PC | 0.06 | 0.05 | 0.05 | 0.03 |
| WF2 | 0.03 | 0.01 | 0.02 | 0 |
| WF3 | 0.04 | 0.02 | 0.01 | 0.01 |
| WF4 | 0.05 | 0.03 | 0.03 | 0.01 |
To calibrate our magnitudes in the HST instrumental system we calculated an aperture correction to 0.5 arcsec, varying with radial distance from the centre of each chip, from bright stars in the image and used the zeropoints in Baggett [Baggett et al. 1997]. We have also transformed the data to the Johnson-Cousins system using the transformation equations in Holtzman et al. [Holtzman et al. 1995b]. The data are de-reddened before transforming. The error in the transformations is 2% for stars with V-I0. For blue stars with V-I0 the scatter in the F814W to I transformation increases to 4%. This means that for V-I0 the systematic error in the colour due to the transformations could be as much as 0.04 mags.
The final sample for each chip was formed by using the magnitude from the long exposure image for all unsaturated stars and from the short image for those stars that are saturated on the long image. The change from long to short data is at V17.5.
In NGC1805 we find that there is a colour shift between the chips of 0.04 mag. Similar shifts have been found by other groups in cluster colour magnitude diagrams [Johnson et al. 1999] and attributed to errors in CTE and aperture corrections and in zeropoints. Similar errors are likely causing the colour shift seen in our data.
2.2 NICMOS2 reductions
The NICMOS data were combined using the IRAF task mscombine, which sums the data and performs cosmic ray rejection. Stars were detected in the NICMOS image and aperture photometry was performed.
Detections near to bright stars and along diffraction spikes were masked, as in the optical data.
There are several difficulties with NICMOS data, fortunately none of these had a big effect on this project. The pedestal, a constant which remains after running the calibration pipeline and causes an inverse flatfield pattern to be imprinted on the image, is not a big problem for these data as we take a local background for each star. Ghosts, which appear at congruent positions in the other quadrants when a bright star is present in one quadrant, do appear in our images, but it is possible to look carefully at the positions where ghosts are expected to occur and eliminate false detections.
An aperture correction to 0.5 arcsec was calculated from bright stars in the image. The data were calibrated to magnitudes in an approximate Vega system using
where PHOTFNU and FνVega are calculated by STScI at the time of writing to be 2.337E-6 Jys/DN and 1039.3 Jy respectively (NICMOS Data Handbook, v4, Table 5.1), and we assume =0 (as in the CIT infrared photometry scale).
The final detected star lists in NICMOS F160W and WFPC2 F555W were matched using the positional information in the image headers. It was found that there can be as much as 2′′ offset between the RAs and Decs calculated for a star from the NICMOS image and those calculated for the same star from the WFPC2 image. According to STScI this is due to the combined uncertainty of the guide star positions, the location of the fine guidance sensors relative to the telescope axis and the measured locations of the instrument apertures.
3 Results
3.1 Colour magnitude diagrams
Figure 3 shows the de-reddened V vs V-I (Johnson-Cousins magnitudes) colour-magnitude diagrams (CMDs) for all four chips of NGC1818 (top) and NGC1805 (bottom). The different chips have different symbols. Stars marked with bold squares are Be stars (see subsection 3.2).
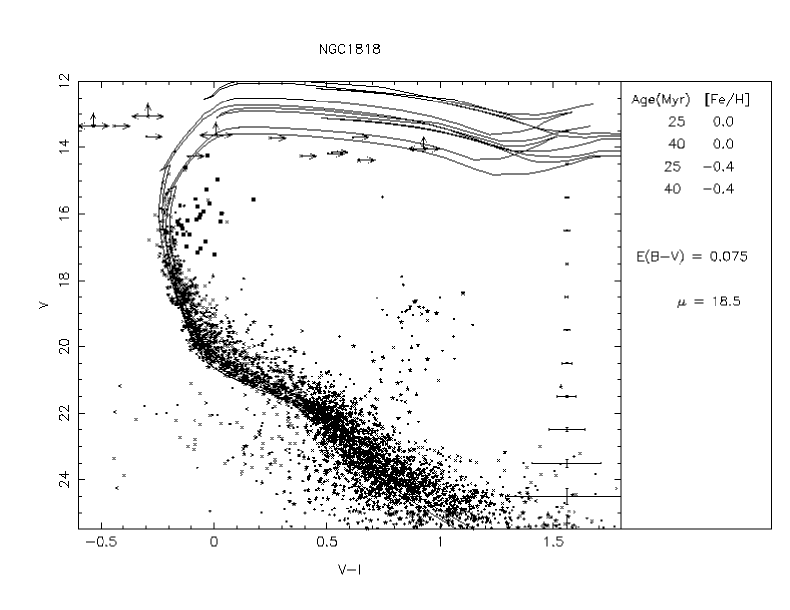
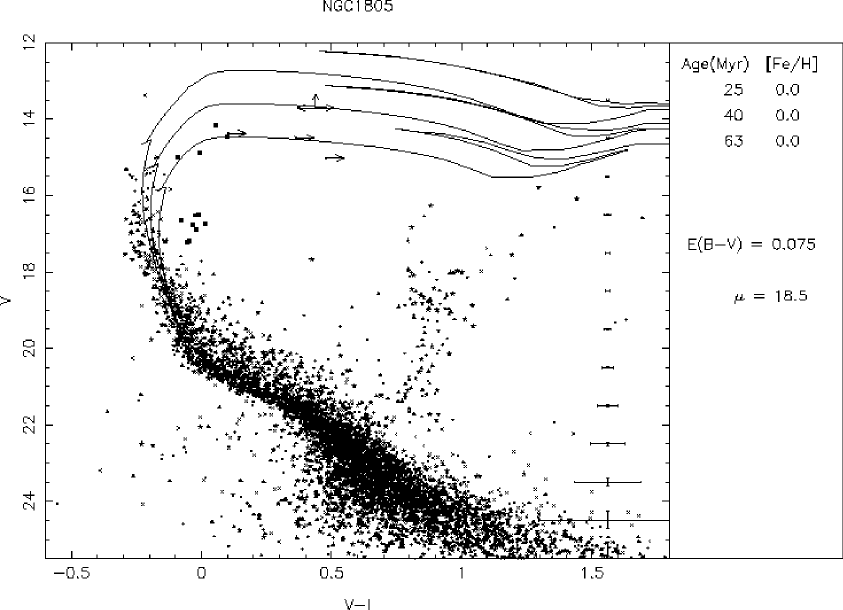
The data have been de-reddened assuming E(B-V)=0.075. Tables 4 and 5 tabulate these data for NGC1818 and NGC1805 respectively (full versions of these tables are available on the MNRAS web site).
| Chip | x | y | RA (J2000) Dec | V | V | I | I | Flag | |
|---|---|---|---|---|---|---|---|---|---|
| 1 | 74.31 | 112.20 | 5:04:17.406 | -66:26:04.38 | 23.416 | 0.118 | 22.748 | 0.088 | |
| 1 | 110.96 | 118.00 | 5:04:17.183 | -66:26:05.37 | 24.410 | 0.223 | 23.648 | 0.176 | |
| 1 | 134.37 | 121.83 | 5:04:17.039 | -66:26:06.00 | 23.321 | 0.096 | 22.797 | 0.116 | |
| 1 | 87.85 | 123.43 | 5:04:17.276 | -66:26:04.46 | 20.992 | 0.016 | 20.840 | 0.018 | |
| 1 | 98.06 | 124.98 | 5:04:17.214 | -66:26:04.74 | 21.209 | 0.018 | 20.944 | 0.019 | |
| 1 | 157.44 | 129.87 | 5:04:16.874 | -66:26:06.49 | 23.172 | 0.102 | 22.429 | 0.098 | |
| 1 | 139.30 | 132.88 | 5:04:16.954 | -66:26:05.81 | 21.564 | 0.025 | 21.237 | 0.032 | |
| 1 | 185.89 | 133.40 | 5:04:16.705 | -66:26:07.29 | 23.700 | 0.18 | 22.833 | 0.152 | |
| Chip | x | y | RA (J2000) Dec | V | V | I | I | Flag | |
|---|---|---|---|---|---|---|---|---|---|
| 1 | 499.83 | 64.34 | 5:02:24.153 | -66:06:47.66 | 20.048 | 0.009 | 20.156 | 0.011 | |
| 1 | 462.12 | 66.77 | 5:02:24.136 | -66:06:45.95 | 23.742 | 0.114 | 22.717 | 0.064 | |
| 1 | 69.32 | 67.12 | 5:02:24.129 | -66:06:28.19 | 24.354 | 0.197 | 23.408 | 0.119 | |
| 1 | 625.93 | 67.98 | 5:02:24.121 | -66:06:53.36 | 23.734 | 0.104 | 22.867 | 0.068 | |
| 1 | 481.95 | 68.05 | 5:02:24.126 | -66:06:46.85 | 26.170 | 0.933 | 24.238 | 0.229 | |
| 1 | 123.21 | 69.78 | 5:02:24.112 | -66:06:30.61 | 19.646 | 0.061 | 19.683 | 0.046 | |
| 1 | 602.06 | 70.09 | 5:02:24.107 | -66:06:52.28 | 21.049 | 0.016 | 20.913 | 0.017 | |
| 1 | 538.54 | 70.64 | 5:02:24.105 | -66:06:49.41 | 19.814 | 0.008 | 19.914 | 0.01 | |
Isochrones from Bertelli et al. [Bertelli et al. 1994], with a range of age and metallicity values encompassing those found in the literature for these clusters, are plotted on the CMDs. To illustrate the effects of age and metallicity the top plot in Figure 3 shows 25 & 40 Myr isochrones for two metallicities, [Fe/H], of -0.4 and 0 and the bottom plot shows solar metallicity isochrones for ages of 25, 40 and 63 Myr.
The two clusters have very similar CMDs, which are traced well by the 25Myr solar metallicity isochrone. The ages and metallicities of these clusters are investigated further by comparison with simulations in section 4. Note that, even with the very short exposure times used here, the brightest stars are still saturated in the F814W images.
The red giant branch of the field population of the LMC is apparent in the CMDs at V-I1, V18.5. We have not subtracted these background stars from our data as we are predominantly interested in the brighter stars (V19) where the contribution from the field is negligible (see e. g. Hunter et al. 1997 Figure4).
Figure 4 show the V vs V-H diagrams for both clusters. The isochrones [Bertelli et al. 1994] are for 25 and 40 Myr and for solar metallicity.


Tables 6 and 7 tabulate these data for NGC1818 and NGC1805 respectively (full versions of these tables are available on the MNRAS web site).
| x | y | RA (J2000) Dec | V | V | H | H | Flag | |
|---|---|---|---|---|---|---|---|---|
| 340.98 | 228.75 | 5:04:15.370 | -66:26:09.23 | 21.555 | 0.036 | 20.230 | 0.21 | |
| 426.83 | 229.79 | 5:04:14.905 | -66:26:11.97 | 18.832 | 0.005 | 18.830 | 0.051 | |
| 562.99 | 232.56 | 5:04:14.162 | -66:26:16.26 | 20.450 | 0.013 | 20.500 | 0.072 | |
| 484.83 | 234.05 | 5:04:14.572 | -66:26:13.70 | 999.000 | 0.045 | 21.950 | 0.219 | |
| 580.68 | 235.37 | 5:04:14.052 | -66:26:16.74 | 22.105 | 0.042 | 20.800 | 0.119 | |
| 313.66 | 236.84 | 5:04:15.473 | -66:26:08.10 | 22.506 | 0.097 | 21.080 | 0.605 | |
| 312.23 | 239.80 | 5:04:15.465 | -66:26:07.95 | 23.414 | 0.234 | 21.080 | 0.605 | |
| 511.93 | 241.08 | 5:04:14.389 | -66:26:14.35 | 20.240 | 0.011 | 20.340 | 0.06 | |
| x | y | RA (J2000) Dec | V | V | H | H | Flag | |
|---|---|---|---|---|---|---|---|---|
| 418.22 | 213.60 | 5:02:23.046 | -66:06:43.95 | 21.550 | 0.027 | 21.434 | 0.092 | |
| 426.93 | 214.81 | 5:02:23.036 | -66:06:44.35 | 23.134 | 0.098 | 23.044 | 0.582 | |
| 404.11 | 221.83 | 5:02:22.984 | -66:06:43.31 | 17.886 | 0.003 | 18.414 | 0.009 | |
| 369.79 | 241.77 | 5:02:22.836 | -66:06:41.75 | 24.675 | 0.39 | 24.088 | 1.713 | |
| 378.92 | 242.71 | 5:02:22.829 | -66:06:42.16 | 23.486 | 0.136 | 24.543 | 2.869 | |
| 384.43 | 252.34 | 5:02:22.757 | -66:06:42.41 | 21.349 | 0.025 | 21.781 | 0.282 | |
| 368.23 | 255.18 | 5:02:22.736 | -66:06:41.68 | 21.453 | 0.025 | 20.351 | 0.091 | |
| 355.04 | 256.25 | 5:02:22.728 | -66:06:41.08 | 20.395 | 0.012 | 20.438 | 0.114 | |
NGC1818 and NGC1805 have five and three red supergiants respectively. Although our having to use NIC2 reduced the number of stars in the NICMOS data, these colour-magnitude diagrams are still of some use as they show us that the red supergiants lie towards the red end of the isochrones. Although the poisson errors on the magnitudes of the bright stars are small, there could well be systematic errors of a few tenths of a magnitude due to uncertainty in the H calibration and the isochrones. In NGC1818 two of the red supergiants are located on the 25 Myr isochrone, and the other three are consistent with either the 25 or 40 Myr isochrone. In NGC1805 two of the red supergiants are located on the 40 Myr isochrone, and one which has lower limits in V is consistent with either isochrone.
3.2 Be stars
In Figure 3 there are many stars in both clusters with 15V17 that are significantly redder than the isochrones. It was suspected that these are Be stars.
An effective way to identify Be stars in clusters is to use the fact that these stars show Balmer emission and hence will separate from non-Be stars in V-Ha ‘colour’. An image of the cluster in H can be used to find those stars which are H bright e.g. [Grebel et al. 1992]. An archive H image exists for NGC1818 [Keller et al. 2000] and this has been used to identify the Be stars. The H image is not registered with the V image and so not all the stars have H data. The single pointing H image contains many cosmic rays so it is not possible to detect stars independently on this image. The coordinate transform between our data and the H image was found and the star coordinates were transformed to the H image and aperture magnitudes obtained. Each star position on the H image was checked to see if the H magnitude was contaminated by a cosmic ray. Cosmic rays were identified by their brightness and morphology. For a few stars the H image did contain a cosmic ray at the star position and it was not possible to obtain an H magnitude.
Figure 5 shows an example of the plots used to identify the Be stars.

Any star with V555-H greater than that of the bulk of the stars, that does not lie in the red supergiant region of the colour-magnitude diagram, is identified as a Be star. Red supergiant stars are excluded as they can also show H emission. We have looked at stars with 13V19 and a star is identified as a Be star if V555-H0.35. The red supergiant region of the CMD is defined to be V555-I0.3 for V16 and V555-I0.6 for 16V19.
Unfortunately, no archive H image exists for NGC1805 and so we cannot identify the Be stars in this cluster using the method above. However, almost all the stars in NGC1818 with V17.5 and 0V555-I0.5 are Be stars. Since the colour-magnitude diagrams for the two clusters appear very similar we have assumed that the same is true in NGC1805. NGC1818 does contain Be stars that are outside the above limits in V and V-I that are intermingled with non-Be stars. It is likely therefore that our colour-magnitude diagrams of NGC1805 contain some unidentified Be stars.
Table 8 shows the number of Be stars and all stars found in 0.5 magnitude bins for each cluster. The first two columns give the numbers found using the methods discussed above (H image for NGC1818 and region in the CMD for NGC1805). The final column gives the number of Be stars in NGC1818 using the same Be star criteria as in NGC1805.
| V | NGC1818 H | NGC1805 | NGC1818 | |||
| N(Be) | N(all) | N(Be) | N(all) | N(Be) | N(all) | |
| 14.25 | 1 | 2 | 2 | 2 | 1 | 2 |
| 14.75 | 2 | 4 | 2 | 3 | 1 | 5 |
| 15.25 | 1 | 8 | 0 | 9 | 1 | 11 |
| 15.75 | 7 | 21 | 0 | 8 | 7 | 29 |
| 16.25 | 9 | 29 | 1 | 14 | 5 | 36 |
| 16.75 | 7 | 40 | 5 | 31 | 4 | 61 |
| 17.25 | 4 | 34 | 2 | 36 | 5 | 60 |
| 17.75 | 4 | 54 | - | - | - | - |
| 18.25 | 8 | 81 | - | - | - | - |
| 18.75 | 2 | 107 | - | - | - | - |
Figure 6 compares the number of Be stars to the total number of main sequence stars (including the Be stars) for the centre of NGC1818 on the PC chip. In this and following figures the V magnitudes are de-reddened Johnson-Cousins magnitudes.

As also found in Keller et al. [Keller et al. 2000], the Be star fraction peaks at the brightest magnitudes around the turn-off and then falls off.
Figure 7 show the Be star fraction for the centre of NGC1805 on the PC chip.

Because the Be stars in NGC1805 were identified using the criteria V17.5 and V555-I0 the numbers of Be stars and Be star fractions shown in Figure 7 are lower limits. Again there is a peak in the Be star fraction around the turn-off. The most significant difference in the Be star fractions of NGC1818 and NGC1805 is the lack of Be stars in the range 15V16 in the latter. To see whether this is just due to the different selection criteria used for identifying Be stars inNGC1805 we have used the same criteria to select Be stars in NGC1818. The results are shown in Figure 8.

The fraction of Be stars with 15V16 in NGC1818 using these selection criteria is 0.2. This fraction of Be stars in NGC1805 would give 3 Be stars in NGC1805, whereas we observe none. There is therefore tentative evidence for a difference in Be star fraction between NGC1818 and NGC1805, but this needs to be investigated further by obtaining an H HST image for NGC1805 to allow proper Be star identification.
Figure 9 shows the change in Be star fraction with radius in NGC1818. This is for stars on the PC with 14V19.

It can be seen that the Be star fraction decreases with distance from the cluster centre. This is consistent with the mass segregation of the bright stars (V18) in NGC1818 found by Elson et al. [Elson et al. 1998].
4 Simulations
There are several populations contributing to the appearance of the bright end of the colour magnitude diagram in these young clusters - main sequence stars, Be stars, binaries, evolved supergiant stars and blue stragglers. These various contributors complicate finding the age, metallicity and reddening for the clusters. For instance blue stragglers can make a cluster appear younger than it really is e.g. [Grebel et al. 1996] and binaries produce a spread at the top of the main sequence that looks similar to an age spread. In order to take these various affects into account we have compared the observations with simulations of clusters of various ages and metallicities. In this section we first discuss the simulations and then compare them with the observations to investigate the cluster parameters.
Synthetic colour-magnitude diagrams are generated using the rapid evolution code developed by Hurley, Pols & Tout [Hurley et al. 2000a] which covers all aspects of the evolution from the main-sequence up to, and including, the remnant stages. Binary evolution is accounted for by incorporating the algorithm described by Hurley [Hurley 2000]. This model, which supercedes the work of Tout et al. [Tout et al. 1997], includes tidal circularization and synchronization, angular momentum loss mechanisms, mass transfer, common-envelope evolution, collisions and supernova kicks. These evolution algorithms allow realistic CMDs to be developed accurately and efficiently, for any age and for all metallicities in the range to 0.03. At present these simulations do not allow for stellar rotation, which is known to move massive stars redward in the colour magnitude diagram [Meynet & Maeder 2000]. The synthetic CMDs are particularly useful for comparison with observed clusters whose stellar populations have not been significantly altered by dynamical interactions, such as the young clusters described here. In the case of dense, or dynamically old, clusters the interaction between cluster environment and the evolution of the constituent stars must be consistently taken into account when simulating CMDs. For this reason the stellar and binary evolution algorithms have been incorporated into a state-of-the-art -body code [Aarseth 1999, Hurley et al. 2000b] but this is not used in this work.
To compare with the data we have run simulations with ages of 10, 25 and 40 Myr and metallicities Z = 0.01 and 0.02. These ages and metallicities encompass the literature values and are also implied by the isochrones shown in Figure 3. There are approximately 850000 stars per simulation with masses down to 0.1 M⊙. The initial mass function for single stars is taken from Kroupa, Tout & Gilmore [Kroupa et al. 1993]. The simulated binary fraction is 35%, with binary masses taken from the initial mass function of Kroupa, Tout & Gilmore [Kroupa et al. 1991] as this has not been corrected for the effects of binaries, and a uniform distribution of mass-ratios.
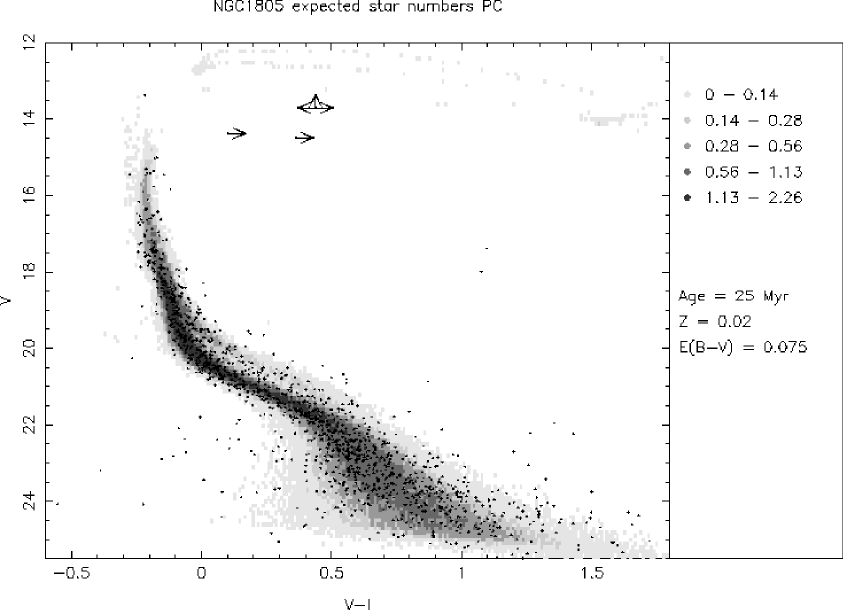
Figure 10 plots the simulated CMD for an age of 25Myr metallicity Z=0.02. Here we just show half (425000) the total number of simulated stars.
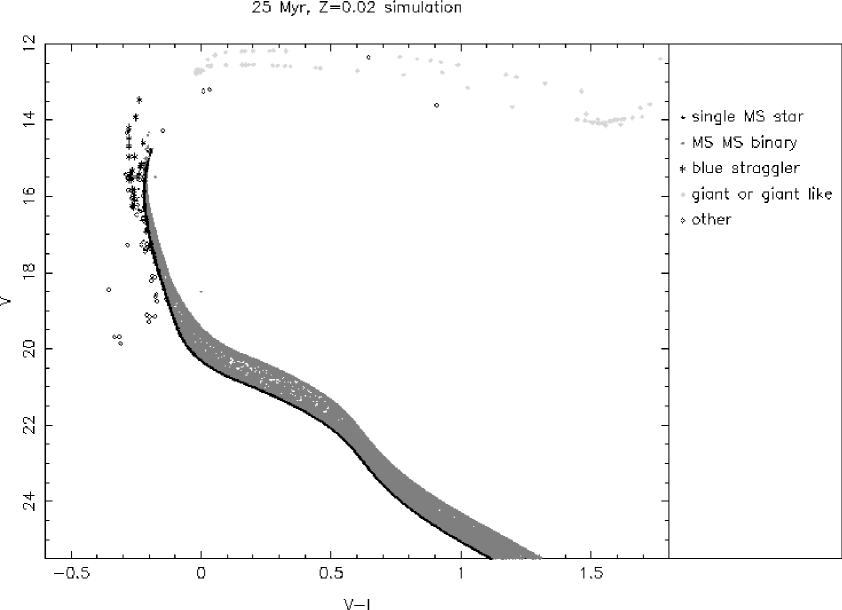
The blue stragglers are plotted with asterisks. They are defined in the simulation as main-sequence stars with a mass turn-off mass. This definition does not identify blue stragglers in binaries. Figure 10 shows that, as well as sitting above the turn-off in the region where blue stragglers have been found observationally, there are also simulated blue stragglers below and blueward of the turn-off. These less luminous blue stragglers are the result of binary interactions of stars below the turn-off. If present in sufficient numbers in a cluster they could cause a widening of the main sequence around the turn-off in the colour-magnitude diagrams. This would then complicate the search for age spreads amongst the massive stars as these also produce a spread in colour at a given magnitude.
The absolute numbers of blue stragglers in the simulations are somewhat arbitrary, as the blue straggler numbers are most likely affected by the cluster structure and dynamical evolution in ways that are currently not well understood. We therefore use the simulations to find the position of blue stragglers in the colour-magnitude diagrams and hence locate possible blue stragglers in the real clusters.
To add the observed errors to the simulations we have modelled the observed error distribution, and found the model that makes the colour spread in the observed and simulated CMDs the same for 18V20.
From each simulation we find the expected number of stars in each cluster. The simulation is normalised to the data using the number of observed and simulated stars with 17V19. This magnitude range avoids background contamination and also the bright star region where the blue straggler fraction is somewhat uncertain.
First we find the metallicity that best describes the cluster CMDs. As can be seen from the isochrones in Figure 3, for V19 the isochrone shape depends only on metallicity and not on age. Also, the reddening vector is virtually parallel to the main sequence in this region and so reddening also does not significantly affect the fit. We have checked whether the background LMC field population could be influencing our metallicity determination using the colour-magnitude diagram in Figures 3 & 8 of Hunter et al. [Hunter et al. 1997]. These show that there is very little difference between the pre and post background subtraction colour-magnitude diagrams at all magnitudes, and for stars brighter than V21 there is no difference. Figure 11 shows the observed and simulated CMDs of NGC1818 and NGC1805. In NGC1805 there is a small colour shift between the chips (see Section 2), and so we just compare the simulations to the colour-magnitude diagram from the PC chip, which contains most of the bright cluster stars. The points are the observed data and the grey scale is the simulation. The grey scale gives the expected number of stars in a box of width (V-I) 0.01 mags and height (V) 0.1 mags. The simulation has age 25 Myr, metallicity Z=0.02 and the data have been de-reddened assuming E(B-V)=0.075. For ease of comparison the Be stars have been removed from the real data in Figure 11.Both of the clusters are described well by the simulation for V19.
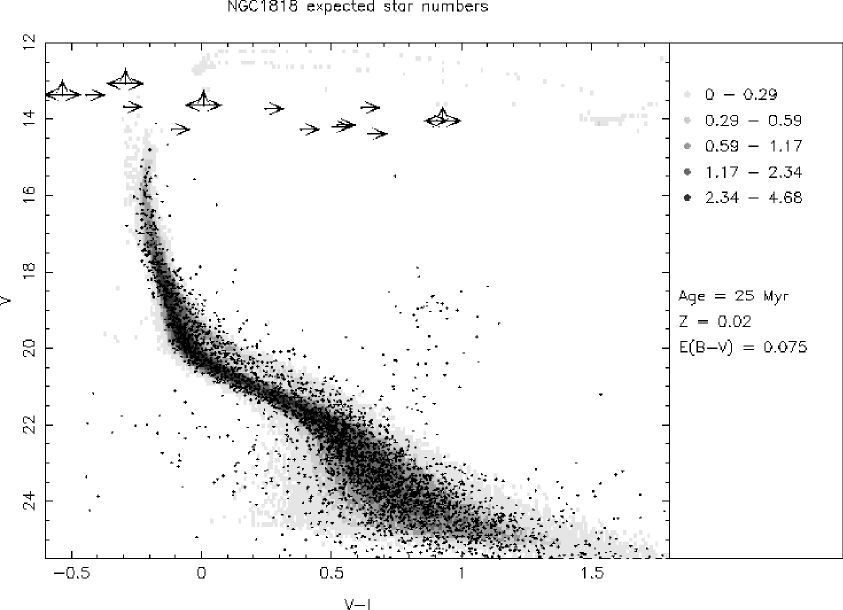
The solar metallicity that we find here is higher than the [Fe/H]-0.4 that is expected for the LMC clusters (see discussion in section 1). It could be the case that these clusters are more metal-rich than the surrounding population as there are no metallicity measurements for stars in NGC1805 and only a couple of stars measured with high resolution in NGC1818. Some of the difference could however be due to a systematic error in the calibration of HST magnitudes to Johnson-Cousins which, as noted in subsection 2.1 could be as high as 0.04 in V-I.
Next we fix the simulation metallicity at Z=0.02 and consider the age of each cluster. The age affects the appearance of the CMD at bright mags (V18). We have compared each cluster to 10, 25 and 40 Myr old simulations, and also to combined simulations of two ages, 10&25 Myr and 25&40 Myr. The latter are used to provide constraints on any age spread in the clusters.
The isochrones in Figure 3 illustrate that the red supergiant positions in the CMD are mostly affected by age. The observed red supergiant numbers and magnitudes rule out the 10 Myr old simulation. Unfortunately, as can also be seen from Figure 3, the exposure time for the F814W observations was long enough to saturate these stars and so the red supergiant positions do not allow us to distinguish between the 25 and 40 Myr old simulations. Most of the red supergiants are not saturated in the V vs V-H colour-magnitude diagrams in Figure 4. In these CMDs the red supergiant positions are consistent with ages of 25 Myr or 25&40 Myr for NGC1818 and 40 Myr or 25&40 Myr for NGC1805.
To compare the observations and the different age simulations we first look at the shape of the observed and expected CMDs. The reddening also affects the position of the CMD at bright magnitudes, and so we have compared simulations and observations for 25, 40, 10&25 and 25&40 Myr and E(B-V) between 0 and 1. We find that only the 25 Myr and 25&40 Myr simulations with E(B-V)=0.075, describe well the observed shape. To distinguish between these two simulations we look at the observed and expected numbers of bright stars in 0.5 mag bins down the main sequence.
Table 9 gives the observed and expected numbers of the brightest stars for the 25 and 25&40 Myr simulations for 12V17. Recall that the simulations and observations were forced to have the same number of stars in the range 17V19 used for normalisation. The observed numbers here include the Be stars. The simulations do not contain Be stars, but the Be phenomenon just moves stars redwards in the colour-magnitude diagram, and so the numbers per magnitude bin remain the same.
| Mag bin | Obs. No. | Sim predicted no. | No. possible BS | ||
|---|---|---|---|---|---|
| 25 | 25&40 | 25 | 25&40 | ||
| NGC1818 | |||||
| 12.25 | 0 | 0.89 | 0.50 | 0 | 0 |
| 12.75 | 0 | 2.44 | 1.24 | 0 | 0 |
| 13.25 | 3 (2) | 0.28 | 2.24 | 0 | 0 |
| 13.75 | 4 (1) | 0.87 | 0.76 | 1 | 1 |
| 14.25 | 9 (1) | 1.73 | 1.50 | 0 | 0 |
| 14.75 | 4 | 2.47 | 3.07 | 0 | 0 |
| 15.25 | 8 | 7.25 | 5.38 | 2 | 3 |
| 15.75 | 21 | 13.28 | 11.71 | 1 | 8 |
| 16.25 | 29 | 18.37 | 18.22 | 3 | 12 |
| 16.75 | 40 | 27.66 | 27.25 | 0 | 2 |
| NGC1805 | |||||
| 12.25 | 0 | 0.43 | 0.24 | 0 | 0 |
| 12.75 | 0 | 1.18 | 0.60 | 0 | 0 |
| 13.25 | 1 | 0.13 | 1.08 | 1 | 0 |
| 13.75 | 1 (1) | 0.42 | 0.36 | 0 | 0 |
| 14.25 | 4 | 0.83 | 0.72 | 0 | 0 |
| 14.75 | 3 | 1.19 | 1.48 | 0 | 0 |
| 15.25 | 8 | 3.50 | 2.59 | 1 | 4 |
| 15.75 | 3 | 6.40 | 5.65 | 1 | 1 |
| 16.25 | 8 | 8.86 | 8.78 | 1 | 6 |
| 16.75 | 18 | 13.34 | 13.14 | 0 | 2 |
The comparison of the observed and simulated numbers is complicated by the fact that the number of blue stragglers in the simulations is somewhat arbitrary. From the simulations we expect 1 blue straggler per cluster, but there could be more than this. The simulations provide the location of blue stragglers in the CMDs. For each magnitude bin we have noted how many observed stars fall in the simulation region that contains blue stragglers i.e. the maximum number of observed stars that could be blue stragglers in that magnitude bin. Columns 5 and 6 in Table 9 give this number.
The fit of the simulation to the observation is deemed to be acceptable if the simulated number is within 1 of the observed number (where is the poisson error on the observed number, which is much bigger than the poisson error on the simulated number). The simulated numbers in the grey boxes are those that do not fit to the observed number. The simulated numbers in the clear boxes only fit if some of the observed stars are blue stragglers, and are therefore not included in the simulated number.
Mass segregation is also seen in NGC1818 [Elson et al. 1998] but this will not have a significant effect on the observed number of stars, as the colour-magnitude diagram is made from all the chips and so includes the inner and outer region of the cluster. In NGC1805, where we are just comparing the PC with the simulations we do not see any evidence for mass segregation.
From Table 9 we find that in both clusters the 25&40 Myr simulation is a better fit to the observed numbers than the 25 Myr simulation. In both clusters some of the observed stars must be blue stragglers in order for the 25&40 Myr simulation to fit. Also in both clusters there are a couple of magnitude bins where the simulation does not fit even if the maximum possible number of blue stragglers are present in the observations.
In section 4 we noted that the objects defined as blue stragglers in our simulations are a superset of those that are observationally called blue stragglers. Observational blue straggers are those that are brighter and bluer than the main sequence turn-off. Neither NGC1818 nor NGC1805 contains such an observational blue straggler sequence. The simulations also contained less luminous blue stragglers that lie just below and blueward of the turn-off. It is these less luminous blue stragglers that allow us to obtain a better fit if they are present in the cluster.
The grey-scale CMD simulations in Figure 11 show the well-known blue Hertzsprung gap. This gap at 13V14 and V-I-0.3 is due to a very fast evolutionary stage. Stars pass through this region of the colour-magnitude diagram comparatively quickly and hence very few are expected to be observed there. However, Keller et al. [Keller et al. 2000] find stars located in this region in the LMC clusters they study (NGC330, NGC1818, NGC2004 and NGC2100). We find three possible blue Hertzsprung gap stars (all with I lower limits) in NGC1818 (consistent with Keller et al. who find two) and one star in this region in NGC1805. Keller et al. have effective temperatures for their blue Hertzsprung gap stars and therefore they rule out the possibility that the stars are blue stragglers, and suggest instead that they may be due to internal mixing in main-sequence stars in excess of that predicted by standard overshoot models.
5 Discussion and Conclusions
We have analysed HST V,I (WFPC2) and H (NICMOS2) observations of two young LMC clusters NGC1818 and NGC1805. The colour-magnitude diagrams of both clusters appear very similar.
We identify Be stars in NGC1818 using an archive H image and find that the fraction of Be stars decreases with radius from the cluster centre. This is consistent with the mass segregation known to exist in this cluster. There is some evidence that the fraction of Be stars in NGC1805 may differ from that in NGC1818, but this requires further investigation.
NGC1818 and NGC1805 do not contain large blue straggler populations. NGC1818 contains three stars that are located in the blue Hertzsprung gap (two of these are just consistent with the location of blue stragglers) and NGC1805 contains one star in this region. The star in NGC1805 also lies on the edge of the blue straggler region. However these blue Hertzsprung gap stars are most likely not blue stragglers [Keller et al. 2000]. Further observations of blue stragglers in clusters of all ages, in parallel with N-body simulations, are required to understand the parameters which influence the blue straggler fraction.
To obtain the cluster parameters (age and metallicity) we have compared the cluster colour-magnitude diagrams to sophisticated stellar population simulations. Comparing with simulations of a single age we find that both clusters are best fit with solar metallicity and an age of 25 Myr. The fit is improved if the simulations contain equal masses of stars of 25 & 40 Myr. This possible age spread is a few dynamical times in these clusters. Such a timescale does not allow us to constrain the efficiency of the star formation process as both high and low efficiency will leave a bound cluster (assuming that the LMC clusters are young analogs to the Galactic globulars). High efficiency is suggested by the similarity of observed density profiles in LMC clusters [Elson et al. 1987].
Our simulations show that, as well as lying above and bluewards of the turnoff, blue stragglers also appear just below and blueward of the turn-off, where they do not stand out observationally, but do increase the width and number density of stars in those regions of the colour-magnitude diagram. The exact numbers of blue stragglers in the simulations is somewhat arbitrary and we find that the best fit is obtained between the simulations and observations if there are significant numbers of these fainter blue stragglers in both clusters.
acknowledgements
We would like to thank Stefan Keller for telling us about the archival H images.
References
- [Aarseth 1999] Aarseth S.J., 1999, PASP 111, 1333
- [Ahumada & Lapasset 1995] Ahumada, J. & Lapasset, E., 1995, A&AS, 109, 375
- [Baggett et al. 1997] Baggett, S., Casertano, S., Gonzaga, S., Ritchie, C., 1997, WFPC2 Instrument Science Report 97-10
- [Beaulieu et al. 2000] Beaulieu, S. F., Gilmore, G., Elson, R. A. W., Johnson, R. A., Santiago, B., Sigurdsson, S., Tanvir, N., 2000, AJ, submitted
- [Bertelli et al. 1994] Bertelli, G., Bressan, A., Chiosi, C., Fagotto, F., Nasi, E., 1994, A&AS, 106, 275
- [Caloi & Cassatella 1998] Calio, V. & Cassatella, A., 1998, A&A, 330, 492
- [Casertano & Muchtler 1998] Casertano, S. & Muchtler, M., 1998, WFPC2 Instrument Science Report 98-02
- [Cassatella et al. 1987] Cassatella, A., Barbero, J., Geyer, E.H., 1987, ApJS, 64, 83
- [Dachs et al. 1988] Dachs, J., Engels, D., Kiehling, R., 1988, A&A, 194, 167
- [Elson et al. 1987] Elson, R., Fall, S. M. & Freeman, K., 1987, ApJ, 323, 54
- [Elson et al. 1998] Elson, R., Sigurdsson, S., Davies, M., Hurley, J., & Gilmore, G., 1998, MNRAS, 300, 857
- [Elmegreen 2000] Elmegreen, B. G., 2000, ApJ, 530, 277
- [Forbes 1996] Forbes, D., 1996, AJ, 112, 1073
- [Geyer & Burkert 2000] Geyer, M.P. & Burkert, A., 2000, MNRAS submitted, astro-ph/0007413
- [Grebel et al. 1992] Grebel, E., Richtler, T., de Boer, K.S., 1992, A&A, 254, L5
- [Grebel et al. 1996] Grebel, E., Roberts, W.J., Brandner, W., 1996, A&A, 311, 470
- [Grebel 1997] Grebel, E., 1997, A&A, 317, 448
- [Holtzman et al. 1995a] Holtzman, J. A, Hester J.J., Casertano, S., Trauger, J.T., Ballester, G.E., Burrows, C.J., Clarke, J.T., Crisp, D., Gallagher, J.S., Griffiths, R.E., Hoessel, J.G., Mould, J.R., Scowen, P.A., Stapelfeldt, K.R., Watson, A.M., Westphal, J.A., 1995a, PASP, 107, 156, 1995
- [Holtzman et al. 1995b] Holtzman, J. A, Burrows, C. J., Casertano, S., Hester, J. J., Trauger, J. T., Watson, A. M., Worthey, G., 1995b, PASP, 107, 1065
- [Hunter et al. 1997] Hunter, D., Light, R., Holtzman, J., Lynds, R., O’Neil, E. & Grillmair, C., 1997, ApJ, 478, 124
- [Hurley 2000] Hurley, J.R., 2000, PhD Thesis, University of Cambridge
- [Hurley et al. 2000a] Hurley J.R., Pols O.R., Tout C.A., 2000a, MNRAS, accepted
-
[Hurley et al. 2000b]
Hurley, J.R., Aarseth S.J., Tout C.A., Gilmore G., Pols O.R., 2000b, in Proceedings of Star2000, Dynamics of star clusters and the Milky Way, Heidelberg, ASP Conference Series, in press
- [Jaschek et al. 1981] Jaschek, M., Slettebak, A., Jaschek, C., 1981, Be star newsletter, 4, 9
- [Johnson et al. 1999] Johnson, J.A., Bolte, M., Stetson, P.B., Hesser, J.E., Somerville, R.S., 1999, ApJ, 527, 199
- [Jüttner 1993] Jüttner, A., 1993, in Baschek, B., Klare, G., Lequeux, J., eds., New Aspects of Magellanic Cloud Research, Springer, Heidelberg, 301
- [Jüttner et al. 1993] Jüttner, A., Stahl, O., Wolf, B., Baschek, B., 1993, in Baschek, B., Klare, G., Lequeux, J., eds, New Aspects of Magellanic Cloud Research, Springer, Heidelberg, 337
- [Keller et al. 1999] Keller, S. C., Wood, P. R. & Bessell, M. S., 1999, A&AS, 134, 489
- [Keller et al. 2000] Keller, S. C., Bessell, M. S., Da Costa, G. S., 2000, AJ, 119, 1748
- [Korn et al. 2000] Korn, A.J., Becker, S.R., Gummersbach, C.A., Wolf, B., 2000, A&A, 353, 655
- [Krist & Hook 1997] Krist, J. & Hook, R., www.stsci.edu/software/tinytim
- [Kroupa et al. 1991] Kroupa P., Tout C. A., Gilmore G., 1991, MNRAS, 251, 293
- [Kroupa et al. 1993] Kroupa P., Tout C. A., Gilmore G., 1993, MNRAS, 262, 545
- [Maeder et al. 1999] Maeder, A., Grebel, E. K., Mermilliod, J-C., 1999, A&A, 346, 459
- [Meurer et al. 1990] Meurer, G. R., Cacciari, C., Freeman, K.C., 1990, AJ, 99, 1124
- [Meynet & Maeder 2000] Meynet, G. & Maeder, A., 2000, A&A accepted, astro-ph/0006404
- [Prosser et al. 1994] Prosser, C. F., Stauffer, J. R., Hartmann, L., Soderblom, D. R., Jones, B. F., Werner, M. W., McCaughrean, M. J., 1994, ApJ, 421, 517
- [Shara et al. 1998] Shara, M. M., Fall, S. M., Rich, R. M., Zurek, D., 1998, ApJ, 508, 570
- [Tout et al. 1997] Tout, C. A., Aarseth, S. J., Pols, O. R., 1997, MNRAS, 291, 732
- [van den Bergh 1981] van den Bergh, S., 1981, A&AS, 46, 79
- [Whitmore et al. 1999] Whitmore, B., Heyer, I., Casertano, S., 1999, PASP, 111, 1559
- [Will et al. 1995] Will, J.-M., Bomans, D.J., de Boer, K.S., 1995, A&A, 295, 54