The consequences of ram pressure stripping on the Virgo cluster spiral galaxy NGC 4522
Abstract
New H Fabry-Perot interferometer observations of the Virgo cluster spiral galaxy NGC 4522 are presented. A velocity field up to a radius of 60′′ was obtained. The observed rotation curve is symmetric. It is not perturbed in the inner disk. For radii it shows a solid body rotation. We compare these data with a numerical model which includes the effects of ram pressure stripping. The model can reproduce the main characteristics of the H emission distribution and velocity field. We therefore conclude that the stripping event which caused the Hi deficiency and the distorted H distribution and velocity field has been due to ram pressure. The closest passage of the galaxy to the cluster center is estimated to be 6.5 108 yr ago. The observed recent star formation is due to the re-accretion of gas clouds which were accelerated to velocities below the escape velocity during the stripping event. Furthermore, the gas which is located at radii is part of an asymmetric expanding ring of gas clouds. A substantial part of these clouds is located above the disk plane. We predict the Hi gas distribution and velocity field as it would be observed by deep 21 cm observations.
Key Words.:
Galaxies: individual: NGC 4522 – Galaxies: interactions – Galaxies: ISM – Galaxies: kinematics and dynamics1 Introduction
It is a well established fact that spiral galaxies in clusters have less atomic gas than isolated spirals of the same morphological type and same optical diameter, i.e. they are Hi deficient (Chamaraux et al. 1980, Bothun et al. 1982, Giovanelli & Haynes 1985, Gavazzi 1987, 1989). There are mainly two kinds of mechanisms which are able to cause the removal of the atomic gas: (i) tidal interactions or (ii) the interaction of the interstellar medium (ISM) with the hot intracluster medium (ICM). The mapping of the gas content of spiral galaxies in the Virgo (Cayatte et al. 1990, 1994) and Coma cluster (Bravo-Alfaro et al. 2000) showed that the Hi disk sizes of cluster spirals are considerably reduced. In addition, galaxies with a symmetric optical disk that have an asymmetric Hi gas distribution are quite frequent in the cluster core. These observational results indicate that the gas removal due to the rapid motion of the galaxy within the ICM (ram pressure stripping; Gunn & Gott 1972) is responsible for the Hi deficiency and the distorted gas disks of the cluster spirals. Nevertheless, it has not yet been unambiguously shown that ram pressure stripping is responsible for the Hi distribution and kinematics of one given spiral galaxy. The possibility of a tidal interaction producing the distortion has never been completely ruled out.
Very few simulations have been done to quantify ram pressure stripping (Gaetz et al. 1987, Balsara et al. 1994, Tosa 1994, Abadi et al. 1999). All of them have considered that the Interstellar medium (ISM) is continuous. In order to take into account the clumpiness of the ISM, we use a sticky particle model in which each particle represents a cloud complex with an assigned mass dependent radius. The viscosity of the clumpy ISM is due to inelastic collisions between the particles. The effect of ram pressure is modeled as an additional acceleration applied on the particles located at the front side of the galaxy motion. The gas distribution and the velocity field of a given simulation snapshot can be directly compared with observations.
In the Virgo cluster only few spiral galaxies with peculiar gas distributions were studied in detail:
-
•
NGC 4419: Kenney et al. (1990) observed an asymmetric CO distribution in this cluster spiral. They suggest that its ISM is undergoing a strong interaction with the ICM.
-
•
NGC 4254: Phookun & Mundy (1993) observed a counter-rotating, very low surface density Hi plume.
-
•
NGC 4654: Phookun & Mundy (1995) found a very asymmetric Hi distribution, with a compressed edge on one side and a long tenuous tail on the other. They conclude that this is a result of the combination of rotation and ram pressure.
-
•
NGC 4388: Veilleux et al. (1999) made H and [Oiii] 5007 observations with the Hawaii Imaging Fabry-Perot Interferometer (HIFI). They found a large complex of highly ionized gas that extends well above the disk. A ram pressure model with a Mach cone of opening angle 80o is proposed to explain the observed distribution and kinematics of the ionized gas.
The Hi deficient spiral galaxy NGC 4522 was observed in the optical and H with the WIYN telescope. Kenney & Koopmann (1999) showed that its old stellar disk is relatively undisturbed. However, the H distribution is very peculiar. Filaments emerge from the outer edge of the disk which is abruptly truncated beyond 0.35. They suggest that this features are due to a bow shock caused by ram pressure which is still acting on the galaxy. Nevertheless, they made their conclusion only on morphological grounds.
With the imaging of the gas content of galaxies only two (, ) out of six components (, , , , , ) of phase space are accessible. The knowledge of the velocity field represents a considerable increase of information. But still, the derived three-dimensional distribution and velocity field depends strongly on the applied model. The number of possible model solutions decreases strongly with the number of observed quantities. Thus, the knowledge of both the gas distribution and velocity field gives very strong constraints on dynamical models.
We therefore observed NGC 4522 with the Fabry-Perot Interferometer at the Observatoire de Haute Provence (OHP). We were able to recover its velocity field up to a radius of 60′′. We first present the observations (Section 2) and the numerical model (Section 3). The observational results are compared to the model in Section 4. We discuss the outcomes of the comparison and draw our conclusions in Section 5.
We adopt a distance of 17 Mpc for the Virgo cluster.
2 Observations and data reductions
2.1 The GHASP Survey
The Gassendi HAlpha survey of SPiral galaxies 111http://www-obs.cnrs-mrs.fr/interferometrie/ghasp.html consists of mapping the H distribution and kinematics of a sample of about 200 nearby spirals using a scanning Fabry Perot interferometer (FP). The aim of the survey begun in October 1998 is to obtain the kinematics with both high spatial and spectral resolutions in the optical disk for a homogeneous sample of galaxies. This should allow us to tune the parameters of the mass distribution accurately and to study the internal dynamics of disks. This project is complementary to the Westerbork Survey of Hi in Spiral Galaxies222http://thales.astro.rug.nl/ whisp/.
The FP is placed in a focal reducer bringing the original f/15 focal ratio of the Cassegrain focus to f/3.8. The focal reducer is attached at the Cassegrain focus of the 1.93 m OHP telescope (Observatoire de Haute Provence, France). Narrow band and high transmission interference filters are used to isolate the studied emission line. The detector used is an image photon counting system (IPCS). The IPCS, with a time sampling of 1/50 s and zero readout noise makes it possible to scan the interferometer rapidly (typically 10 s per channel) avoiding sky transparency, airmass and seeing variation problems during the exposures. The field of view is 4.1 arcmin x 4.1 arcmin and the pixel size 0.96 arcsec. A full description of the GHASP survey and equipment will be given in a forthcoming paper but the basic principles of a similar instrument can be found in Amram et al. (1991).
2.2 Observations
The observation of NGC 4522 have been made with the GHASP equipment in April 1999. Using a scanning FP of interference order 796 at H the free spectral range of 378 km s-1 was scanned through 24 channels (the finesse of the interferometer being 12) providing a spectral sampling of 17 km s-1. The journal of the observations is given in Table 1.
-
a
RC3
-
b
Binggeli et al. (1985)
-
c
Rubin et al. (1998)
-
d
Helou et al. (1984)
-
e
Kenney & Koopmann (1999)
-
f
this paper
-
g
inside D25 assuming a flat rotation curve of =100 km s-1
-
h
Giovanelli & Haynes (1985)
2.3 Reductions
The data were reduced using the ADHOCw software package 333ftp availaible http://www-obs.cnrs-mrs.fr/adhoc/adhoc.html, Boulesteix et al. (1999). The data reduction procedure has been extensively described in Amram et al. (1996) and references therein.
Wavelength calibrations were obtained by scanning the narrow Ne 6599 Å line under the same conditions as the observations. The relative velocities with respect to the systemic velocity are very accurate, with an error of a fraction of a channel width (3 km s-1) over the whole field.
The signal measured along the scanning sequence was separated into two parts: (1) an almost constant level produced by the continuum light in a 10 Å passband around H (continuum map), and (2) a varying part produced by the H line (monochromatic map). The continuum level was taken to be the mean of the three faintest channels, to avoid channel noise effects. The monochromatic map was obtained by integrating the monochromatic profile in each pixel. The velocity sampling was 16 km s-1. The monochromatic maps had one-pixel resolution in the center of the galaxy. Spectral profiles were binned in the outer parts (to 5 5 pixels) in order to increase the signal-to-noise ratio. When multiple components were visually present, the lines were decomposed into multiple Gaussian components. OH night sky lines passing through the filters were subtracted by determining the shapes and intensities of the lines away from the galaxies (Laval et al. 1987).
3 The numerical model
We used the three-dimensional N-body code described in detail in Vollmer et al. (2000). The particles represent gas cloud complexes which are evolving in an analytically given gravitational potential of the galaxy. This potential consists of two spherical parts: the dark matter halo and the stellar bulge. The outcoming velocity field has a constant rotation curve of 130 km s-1 (Fig. 1).

10 000 particles of different masses are rotating within this gravitational potential. A radius, which depends on the mass, is attributed to each particle. During the disk evolution they can have inelastic collisions. The outcome of these collisions is simplified following Wiegel (1994):
-
•
for :
fragmentation -
•
for and :
mass exchange -
•
for and :
coalescence,
where is the impact parameter, and the cloud radii, the final velocity difference, and is the escape velocity. This results in an effective gas viscosity in the disk.
As the galaxy moves through the ICM its clouds are accelerated by ram pressure. Within the galaxy’s inertial system the clouds are exposed to a wind coming from the front side of its motion. The effect of ram pressure on the clouds is simulated by an additional force on the clouds in the wind direction. Only clouds which are not protected by other clouds against the wind are affected.
As the galaxy approaches the cluster center its velocity increases. At the same time the surrounding ICM density increases. This leads to an increase of the ram pressure on the ISM clouds , where is the ICM density and is the velocity of the galaxy. We take this evolution of into account in adopting the following profile , where cm-3 and =1000 km s-1. This corresponds to a galaxy’s closest approach of pc to the cluster center.
The choice of the maximal ram pressure and the inclination angle between the disk and the orbital plane depends on the resulting Hi deficiency and the fraction of re-accreted gas (see Section 4). Furthermore, the observed gas distribution gives an indication for the right range of the inclination angle . The chosen parameters =20o and lead to a model Hi deficiency of =0.4 compared to the observed deficiency of =0.5. The correspondence is good enough in the way that the simulation shows all characteristics of the distribution and kinematics necessary to identify the stripping process unambiguously. We have let the galaxy evolve during 109 yr before beginning the ram pressure simulations.
4 Results
A sequence of the galaxy evolution is shown in Fig. 2.
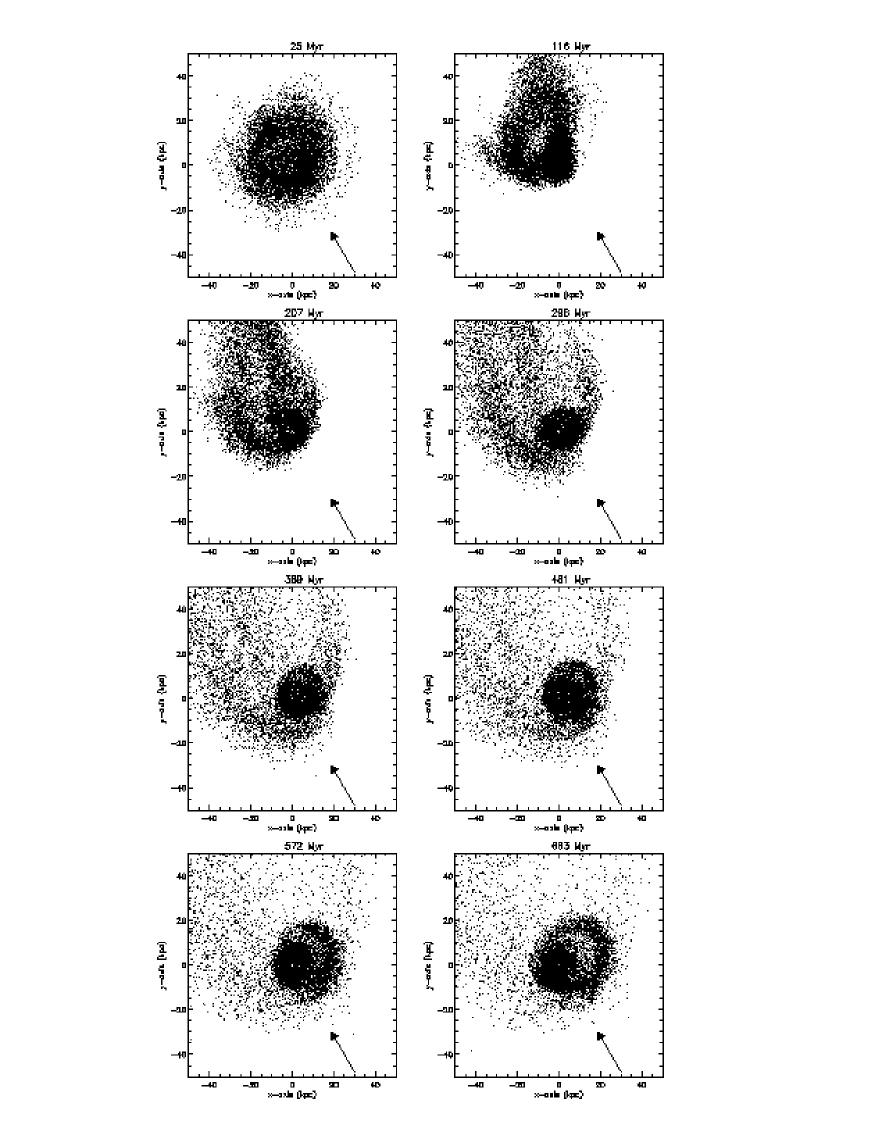
At yr ram pressure is at maximum. An overdensity builds up within the disk in the wind direction (south-west) together with an asymmetric ring structure. About 108 yr later, the material in the ring moves to the north-east leaving the disk. At this stage of the evolution ram pressure has already ceased and the subsequent evolution of the ISM is mainly governed by rotation and re-accretion. As for the case of edge-on stripping, there is an accelerated arm where the wind pushes the clouds in the sense of rotation and a decelerated arm where the clouds are decelerated by the wind (see Vollmer et al. 2000). The accelerated arm extends to the north, the decelerated arm is horizontal. After yr the clouds, which where not accelerated to the escape velocity, begin to fall back onto the galaxy. This happens within two distinct arms. A small, counter-rotating arm in the north-west and a more massive arm coming from the north-east where the clouds fall back to the galaxy in the sense of rotation. It hits the outer galactic disk in the south-west carrying a part of the disk gas clouds with it to larger galactic radii. This leads to the formation of an expanding asymmetric ring at yr. During the expansion the re-accreting gas clouds of the counter-rotating arm collide with the clouds located in the ring. We suggest that these collisions lead to star formation activity within the ring structure.
Vollmer et al. (2000) have shown that in general a substantial part of the stripped ICM re-accretes between 2 and 7 108 yr after the closest passage of the galaxy to the cluster center. Furthermore, the effects of ram pressure within a Virgo spiral galaxy can only be observed after its passage in the cluster core. This is also the case for the simulation shown in Fig. 2. The large projected distance of NGC 4522 with respect to the Virgo cluster center (M87) of 3.3o (1 Mpc) makes it thus very unlikely that the galaxy is just entering the cluster. The ICM density at this distance is only cm-3 (Schindler et al. 1999). Even if the galaxy has a velocity of 1800 km s-1 the resulting ram pressure does not exceed . For these low values the influence of ram pressure on the neutral component of the ISM is not observable.
We therefore come to the conclusion that NGC 4522 has already passed the cluster center. Since the galaxy is leaving the cluster now, we see the consequences of a past strong stripping event. Assuming a mean galaxy velocity of =1500 km s-1 we can calculate the time elapsed since its closest passage to the cluster center: 6.5 108 yr. We therefore compare a snapshot of our simulation at this timestep with our observations. In this stage most of the re-accretion has already taken place. Since our model does not explicitly include star formation we can only speculate that this re-accretion has lead to an increase of the star formation rate making the galaxy bluer. At the present day, accretion is still happening and the collisions between the infalling clouds and the ISM probably still induces star formation. For direct comparison we use the position angle, inclination and systemic velocity of NGC 4522 (Table 2).
First, we show in Fig. 3 the three-dimensional particles distribution and velocity field of the snapshot of our simulation that we want to compare with the observations. It shows the gas cloud distribution of the galaxy in a face-on and edge-on view. It corresponds to the last snapshot of Fig. 2.
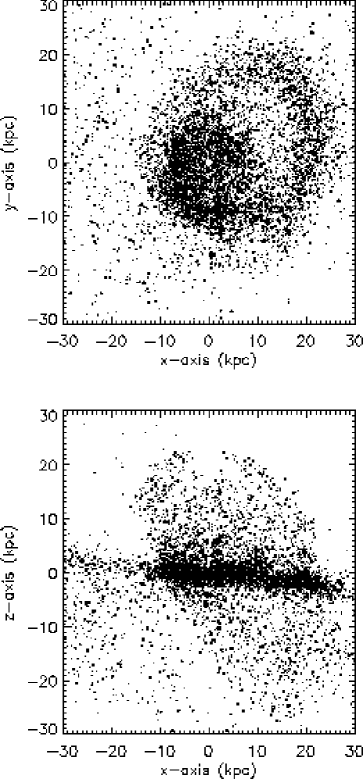
The Hi disk has a diameter of 14 kpc. The asymmetric ring extends up to radii of 20 kpc. A part of the ring is located beyond the disk plane (Fig. 3 lower panel). At this stage of evolution, a tenuous gas component forms complex three-dimensional structure around the galaxy disk.
The three-dimensional velocity field can be seen in Fig. 4.
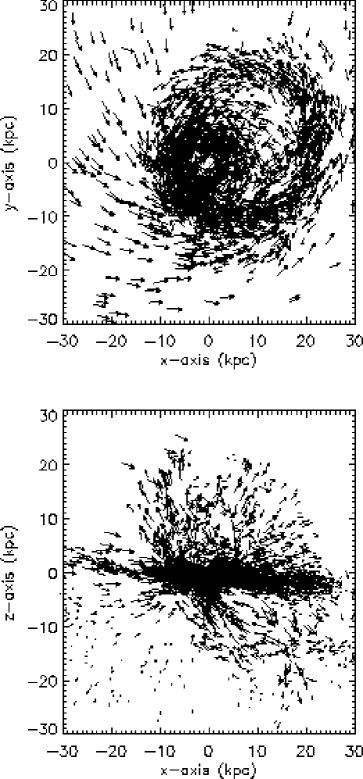
The galaxy rotates counter-clockwise. The gas which is located in the north is accreting back to the galaxy. We observe a lot of counter-rotating clouds in the expanding ring. In particular, there is a streamer which runs almost perpendicular to the disk (Fig. 4 lower panel). It comes from below and crosses the disk at its eastern edge. We want to stress here again that there are a lot of clouds whose trajectories will lead to collisions.
Since we have used a galaxy with an optical diameter of =30 kpc in our simulations (see Vollmer et al. 2000) whereas NGC 4522 has an optical diameter of =18 kpc, we adapted the length scale of our simulations to that of NGC 4522 (roughly a factor 2). This three-dimensional cloud distribution and velocity field can now be projected using the observed position angle and inclination. We will directly compare the outcomes of this projection with the observational results. The model images have almost the resolution of the observations.
4.1 The distribution of the ionized gas
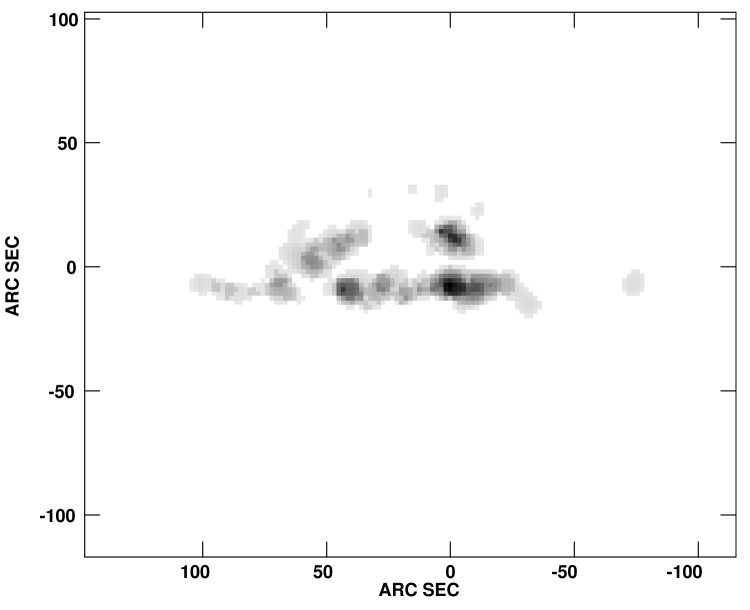
In order to model the H distribution, we assume that star formation is induced by the compression of the clouds during cloud–cloud collisions. Consequently, we have to search for clouds with crossing trajectories in order to detect gas streams which lead to frequent inelastic collisions. We thus project the velocity vectors (, ) of each pair of clouds on their relative distance vector : We apply a weighting factor to each cloud which is equal to the number of possible collisions fulfilling the criterion: kpc, has the opposite sign of , and kpc, where is the distance of the cloud to the galaxy center. At distances kpc, i.e. within the disk, the mean free path of a cloud is smaller than outside the disk. The criterion kpc might thus not be valid at small distances. Moreover, in the inner disk star formation is more likely due to density waves within the stellar and gaseous disk. Since this aspect is not included in the model we prefer to give the clouds at kpc a uniform weight. The model emission inside the galaxy disk is thus density weighted, the emission outside the disk is collision weighted. This treatment ensures in our view the simplest approach in order to model the observed H emission. Fig. 5 shows the observed together with the model of the H emission distribution.
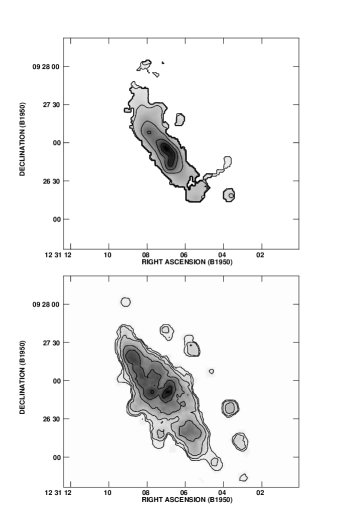
The observed H emission distribution is already discussed in detail in Kenney & Koopmann (1999). We therefore just summarize the main features.
-
•
The H disk is strongly truncated.
-
•
10 % of the total H emission arises from a one-sided, extra planar distribution.
-
•
The extra planar ionized gas is organized into filaments.
-
•
The extra planar H emission has also a diffuse component.
-
•
The region of highest H emission in the core of the disk is more extended to the south-west.
-
•
The region of intermediate H emission in the galaxy disk is more extended to the north-east.
Almost all characteristics of the observed H emission distribution can also be found in the model distribution (Fig. 5 lower panel):
-
•
The disk is strongly truncated. This is due to the truncation of the Hi gas disk at a radius kpc.
-
•
A fraction of several percent of the total emission can be found in the north-west, far away from the disk. This emission is due to colliding clouds which form stars ionizing their environment. This happens predominantly in the expanding ring.
-
•
Our model image does not have enough resolution to show filaments. A careful inspection of the observed H image of Kenney & Koopmann (1999) shows that the filaments are mainly located near the north-eastern and south-western end of the galaxy’s disk. These are the places where the expanding ring joins the disk. Moreover, the filamentary structure can be due to magneto–hydrodynamic phenomena which are not included in our code.
-
•
We have not yet included the mechanism of star formation in the model. We therefore can not make the difference between clumped and diffuse emission directly. Nevertheless, since the expanding ring has a considerable extension in the disk plane with a relatively low cloud density, we expect that there is a part of UV emission which escapes out of the cloud complex, where the stars were built. This environment can be other clouds in the expanding ring or the tenuous material which is distributed around the galaxy disk (see Fig. 3). The diffuse component of the observed H emission might therefore be the trace of this tenuous gas component.
-
•
The maximum emission of the disk shows the same asymmetry as the observed H emission distribution.
4.2 The velocity field of the ionized gas
We will first discuss the overall behavior of the observed H rotation curve averaged for both sides. For the comparison with our model, the approaching and receding sides are separated. The H rotation curve can be seen in Fig. 6.

It is made with a constant position angle and a constant inclination angle. The error bars correspond to the difference between the approaching and the receding side. The rotation curve rises rapidly up to a distance of 20′′ and more slowly for distances between 20′′ and 50′′. Between 50′′ and 60′′ the velocities of the approaching and receding side differ considerably (50%). A drop of the rotation velocity from 90 km s-1 to 70 km s-1 can be observed at 65′′. The rotation curve rises then linearly up to a distance of 90′′. This rise is due to the H blobs located in the north west direction above the disk’s major axis. The difference between both sides is quite small (20 km s-1) for this outer part of the rotation curve.
The mass distribution has been analyzed using a mass model and a code written by Carignan (1985). The solid line in Fig. 6 corresponding to this model rotation curve is based on the R luminosity profile (Koopmann & Kenney 2000), an intrinsic ratio Qo=0.15, a constant M/L=5, and a maximum disk assumption. The mass surface density of the disk is derived from the surface brightness profile at each radius. This explains the dip in the model rotation curve at 15′′ caused by a dip in the R luminosity profile, which is due to the galaxy’s internal structure, i.e. the bar. The model curve reproduces accurately the H rotation curve up to 60′′. Outside, it was impossible to reproduce the rising solid body rotation curve using a maximum disk mass model or a best fit model with any known shape of dark halo. We therefore conclude here that the H emission blobs which are located in the north west must be located beyond the disk plane and/or must be accelerated.
In the following paragraph the observed and the model rotation curves will be directly compared. Fig. 7 shows the velocity field of the H observations together with that of the model for the approaching and receding side separately.
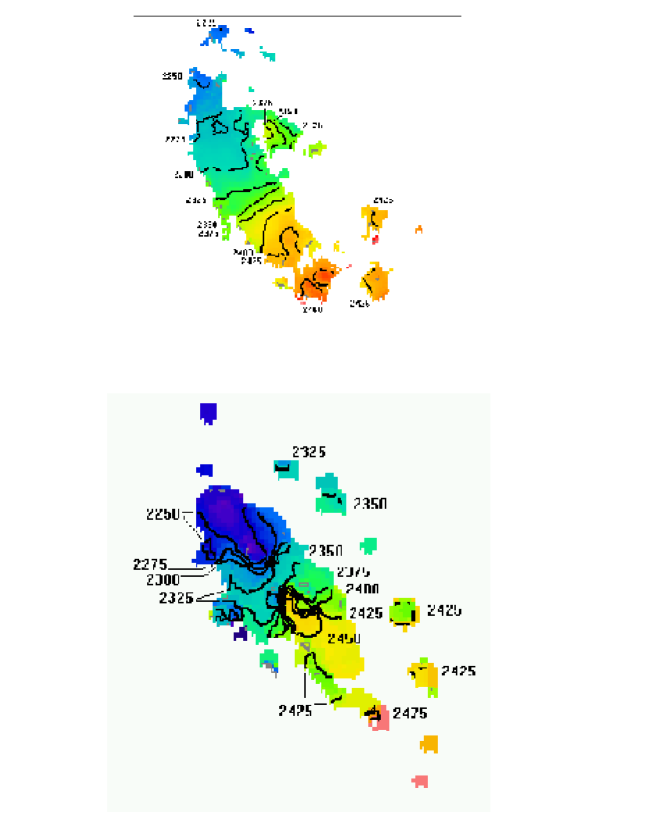
The overall structure of both velocity fields is in good agreement. The difference in the inner disk is due to the initial model rotation curve, which rises more rapidly than the observed one.
The derived rotation curves within a sector of 5o around the major axis is plotted in Fig. 8.

Our observations confirm the non-perturbed rising rotation curve measured by Rubin et al. (1999).
The observed rotation curve continues to rise at both sides up to a distance of . The receding side shows a little bump at . The model rotation curve does not differ from the initial model rotation curve for radii , i.e. it stays constant. The outer end at positive distances begins to rise, whereas the outer end at the opposite side shows the inverse trend.
As mentioned in the previous section, the initial model rotation curve is not rising but flat. This changes obviously the velocity field of the inner disk but not that for larger distances to the galaxy center. The main result of the simulation at this point is that the rotation curve of the inner disk is not altered by the ram pressure stripping event, i.e. it stays flat.
The most important test for the model velocity field is the velocity structure of the emission at the north-eastern side of the galaxy disk. These regions are included in the rotation curve derived within a sector of 40o around the major axis (Fig. 9).

The observed rotation curve is symmetric. It rises steeply up to a distance of from the galaxy center. Then, the velocity increases more slowly up to a distance of . After a sudden drop it rises linearly (solid body rotation) and reaches km s-1 at a distance of .
The model rotation curve shows the same overall behavior. It rises linearly at both sides and covers the same velocity range than the observed rotation curve. The main difference between the model and the observed rotation curve is the asymmetry of the model rotation curve. While the receding side has a very similar behavior as the observed rotation curve, the linear rise of the rotation curve at the approaching side begins at a smaller distance (). For the rotation curve drops abruptly. The observed rotation curve shows also a decrease but at larger radius ().
4.3 Off-plane material and predicted Hi gas distribution and velocity field
We can investigate if the material in the expanding ring is located beyond the galaxy’s disk plane as suggested by Kenney & Koopmann (1999). In order to study the emission distribution in the direction we removed the disk particles from the model and plotted the emission distribution for the galaxy plane seen edge-on (Fig. 10).
A substantial part of the gas clouds in the expanding ring located at radii kpc is thus well situated up to 2 kpc above the disk plane.
With the help of the three-dimensional model cloud distribution and velocity field we can attempt to predict the overall gas distribution and velocity field as it would be detected by very deep Hi 21 cm observations (Fig. 11).
In doing so, we have to be very cautious. The major caveat for this prediction is the unknown mass loss rate of the neutral gas clouds which are located in the hot ICM due to evaporation. Since the stripping event has already happened a long time ago, it is possible that a significant fraction of the extra planar neutral gas clouds has already evaporated and is no longer observable in Hi. Very deep Hi observations (VLA D array) will therefore not only be a test for the chosen model but they will also give some clues on the evaporation timescale of the stripped neutral gas clouds.
5 Discussion and conclusions
We have shown new H Fabry-Perot interferometer observations of the Virgo cluster spiral galaxy NGC 4522. The velocity field can be traced up to radius of . We compare the results of these observations with a numerical model which includes the effects of ram pressure acting on the galaxy’s gas content.
We derived rotation curves within a sector of 5o and 40o around the major axis. Thus, we have been able to compare the emission distribution, the velocity field, and the rotation curves of the observations with those of the model.
For the inner disk of the galaxy, the main result is that the ram pressure stripping event which happened 6.5 108 yr ago did not alter the initial rotation curve of the galaxy. For the outer disk, the stripped material which has not been accelerated above the escape velocity is re-accreting on the galaxy. The majority of this material forms an expanding, asymmetric ring structure. A small fraction of the stripped gas is falling back onto the galaxy within a counter-rotating arm. Inelastic collisions between the gas clouds located in the ring on the one hand and between clouds of the counter-rotating arm and clouds located in the ring on the other hand happen frequently. This leads to an enhanced star formation activity within the ring structure. Since we have traced the total number of collisions during the simulation, we can estimate the star formation rate due to cloud–cloud collisions: during the last 5 107 yr the number of collisions is =31. With a cloud mean mass =8 105 M⊙ and assuming that 10 % of the gas is turned into stars this gives
| (1) |
This is in excellent agreement with the measured star formation rate of (Kenney & Koopmann 1999). The newly formed massive and hot stars ionize their surroundings giving rise to the H emission. These detached emission blobs lead generally to a rise of the rotation curve, and sometimes to a decreasing rotation curve. This corresponds to the behavior of the observed velocity field.
It is important to mention that the numerical simulation does not pretend to reproduce the H distribution and velocity field in each detail. The aim of the comparison is to find the same general characteristics which allow us to discriminate whether the model describes the observations well. In our case, the comparison shows the following similarities:
-
•
The H disk is strongly truncated.
-
•
A considerable amount of the total H emission arises from a one-sided, extra planar distribution.
-
•
The region of highest H emission in the core of the disk is more extended to the south-west.
-
•
The region of intermediate H emission in the galaxy disk is more extended to the north-east.
-
•
The rotation curves of the inner disk are those of an undisturbed galaxy.
-
•
The rotation curves of the outer disk shows a linear rise (solid body rotation).
-
•
The detached emission blobs lead generally to a rise of the rotation curve, and sometimes to a decreasing rotation curve.
The dissimilar aspects are by far less numerous:
-
•
The observed H emission off-plane comes mainly from three distinct regions, whereas the model emission off-plane covers 180o.
-
•
The model rotation curve is not symmetric.
-
•
The model emission distribution does not show a filamentary structure.
-
•
The model emission distribution does not show a diffuse component.
The last two points are due to numerics (discrete model, missing resolution, no magnetic fields, no star formation mechanism). The asymmetry of the model rotation curve is most likely due to the initial conditions of the simulation. We have run several simulations with different initial conditions, but since the parameter space for these initial conditions is very large, we were not able to find a model snapshot which fits our observations more tidily.
We therefore conclude that the model describes very well the overall aspects of the H observations.
This leads to the final conclusion that the galaxy’s closest passage to the cluster center is 6.5 108 yr ago and the galaxy is coming out of the cluster core. Its positive radial velocity with respect to the cluster mean velocity places it behind the cluster center (M87).
Acknowledgements.
The authors wish to thank Jacques Boulesteix for his help on the data acquisition system and data reduction software for GHASP. BV is supported by a TMR Programme of the European Community (Marie Curie Research Training Grant).References
- (1) Abadi, M.G., Moore, B., Bower, R.G., 1999, MNRAS, 308, 947
- (2) Amram, P., Boulesteix, J., Georgelin, Y.M., et al., 1991, The Messanger, 64, 44
- (3) Amram, P., Balkowski, C., Boulesteix, J., Cayatte, V., Marcelin, M., Sullivan, W.T.III, 1996, A&A, 310, 737
- (4) Balsara, D., Livio, M., O’Dea, C.P., 1994, ApJ, 437, 83
- (5) Binggeli, B., Sandage, A., Tammann, G.A., 1985, AJ, 90, 1681
- (6) Bothun, G., Schommer, R.A., Sullivan, W.T.III, 1982, AJ, 87, 731
- (7) Boulesteix, J. 1999, ADHOCw Users Manual (Pub. Obs. Marseille)
- (8) Bravo-Alfaro, H., Cayatte, V., van Gorkom, J.H., Balkowski, C., 2000, AJ, 119, 580
- (9) Carignan, C., 1985, ApJ, 299, 59
- (10) Cayatte, V., van Gorkom, J.H., Balkowski, C., Kotanyi, C., 1990, AJ, 100, 604
- (11) Cayatte, V., Kotanyi, C., Balkowski, C., van Gorkom, J.H., 1994, AJ, 107, 1003
- (12) Chamaraux, P., Balkowski, C., Gérard, E., 1980, A&A, 83, 38
- (13) de Vaucouleurs, G., de Vaucouleurs, A., Corwin, H.G., Buta, R.J., Paturel, G., Fouqué, P., 1991, Third Reference Catalogue of Bright Galaxies,(New York:Springer)(RC3)
- (14) Gaetz, T.J., Salpeter, E.E., Shaviv, G., 1987, ApJ, 316, 530
- (15) Gavazzi, G., 1987, ApJ, 320, 96
- (16) Gavazzi, G., 1989, ApJ, 346, 59
- (17) Giovanelli, R., Haynes, M.P., 1985, ApJ, 292, 404
- (18) Gunn, J.E., Gott, J.R., 1972, ApJ, 176, 1
- (19) Helou, G., Hoffman, G.L., Salpeter, E.E., 1984, ApJS, 55, 433
- (20) Kenney, J.P.D., Young, J.S., Hasegawa, T., Nakai, N., 1990, ApJ, 353, 460
- (21) Kenney, J.P.D., Koopmann, R.A., 1999, AJ, 117, 181
- (22) Koopmann, R.A., Kenney, J.P.D., 2000, AJ, submitted
- (23) Laval, A., Boulesteix, J., Georgelin, Y.P., Georgelin, Y.M., Marcelin, M., 1987, A&A, 175, 199
- (24) Phookun, B., Mundy, L.G., 1993, ApJ, 418, 113
- (25) Phookun, B., Mundy, L.G., 1995, ApJ, 453, 154
- (26) Rubin, V., Waterman, A.H., Kenney, J.P.D., 1999, AJ, 118, 236
- (27) Schindler, S., Binggeli, B., Böhringer, H., 1999, A&A, 343, 420
- (28) Tosa, M., 1994, ApJ, 426, L81
- (29) Veilleux, S., Bland-Hawthorn, J., Cecil, G., Tully, R.B., Miller, S.T., 1999, ApJ, 520, 111
- (30) Vollmer, B., Cayatte, V., Balkowski, C., Duschl, W.J., 2000, ApJ, submitted
- (31) Wiegel, W., 1994, Diploma thesis, University of Heidelberg