BeppoSAX study of the broad-band properties of luminous globular cluster X–ray sources
Abstract
We have performed a detailed study of the broadband spectra of the luminous ( erg s-1) globular cluster X–ray sources using BeppoSAX. With the exception of X 2127+119, located in NGC 7078, all the other spectra are well represented by a two component model consisting of a disk-blackbody and Comptonized emission. The measured low-energy absorptions are in good agreement with those predicted from optical measurements of the host globular clusters. This implies that there is little intrinsic X–ray absorption within the binaries themselves, and that the above spectral model provides a good representation of the low-energy continua. The sources can be divided into two groups. In the first group, composed of 3 ultra-compact (orbital period 1 hr) sources, the disk-blackbody temperatures and inner-radii appear physically realistic and the Comptonization seed photons temperatures and radii of the emission areas are consistent with the disk temperatures and inner radii. For all the other sources, the disk-blackbody parameters appear not to be physically realistic and the Comptonization parameters are unrelated to those of the disk-blackbody emission. If this is a spectral signature of ultra-compact binaries, this implies that no other ultra-compact binaries are present among those studied here. It is unclear why this difference between the two types of binaries should exist. One possibility may be related to the mass ratio, which is similar in the ultracompact systems and binaries containing black holes. In the latter systems the soft components are also well-fit with disk-blackbody models, which appear to have physically realistic parameters.
Key Words.:
Accretion, accretion disks – Stars: neutron – Globular clusters – X–rays: general1 Introduction
The nature of the X–ray sources in globular clusters has provoked great observational and theoretical interest. Surveys of the dozen brightest erg s-1) globular cluster X–ray sources have shown that they share many similarities with the low-mass X–ray binaries (LMXBs) found in the rest of the Galaxy - for example the presence of X–ray bursts and a lack of coherent pulsations in their persistent emission (Hertz & Wood h:85 (1985); Parmar et al. p:89 (1989); Verbunt et al. v:95 (1995)). The presence of Type I bursts indicates that the luminous systems contain accreting neutron stars rather than black holes, and they are generally considered to be similar systems to the galactic X–ray burst sources. Their formation is, however, about a factor 200 more efficient inside globular clusters than in the galaxy itself.
LMXB X–ray spectra are generally modeled by combining one or more spectral components. At luminosities erg s-1 these often consist of a modified blackbody and some form of power-law like component thought to result from the Comptonization of cooler photons. At lower luminosities, the spectra appear to simplify and are often fit with a power-law with an exponential cut-off at high energies (White et al. w:88 (1988)).
In this paper we present the results of a systematic survey of the luminous globular cluster X–ray sources undertaken as part of the BeppoSAX Core Program. We pay particular attention to the spectral properties of the persistent emission. A long-term goal of such studies is to understand how the spectral shape may be used to derive information on physically interesting parameters such as the mass accretion rate, the neutron star mass, radius and spin-rate, the system inclination and the viscosity of the material in the accretion disk. For surveys of LMXBs, the study of those located in globular clusters provides a number of advantanges: (1) the distances to the many globular clusters have been independently determined through main-sequence modeling and other methods (see e.g., Carretta et al. c:00 (2000)). This allows more accurate estimates of luminosity than is typical for galactic LMXBs. (2) The mean cluster abundances have been determined, allowing any dependence of X–ray properties on abundance to be examined. (3) The cluster reddenings have been measured so providing an independent estimate of low-energy absorption. For a number of clusters the reddening is significantly less than typical for galactic LMXBs.
Results of the BeppoSAX observations of Terzan 1, Terzan 2, NGC 6441, and NGC 7078 are to be found in Guainazzi et al. (g:99 (1999), g:98 (1998)), Parmar et al. (p:99 (1999)) and Sidoli et al. (s:00 (2000)), respectively. In addition, NGC 6440, Terzan 6, and Liller 1 were observed by BeppoSAX in other programs. Results are reported in in’t Zand et al. (i:99 (1999), i:00 (2000)) and Masetti et al. (m:00 (2000)), respectively. For these sources data were extracted from the SSD BeppoSAX archive and reprocessed using the SAX Data Analysis System (SAXDAS).
2 Globular Cluster Properties
Table 1 includes informations on the globular clusters which are known to contain luminous X–ray sources and have been analysed here. Most of the cluster distances, metallicities and extinctions are taken from Djorgovski (d:93 (1993)). In the case of Terzan 1 more recent estimates of the distance and extinction obtained using HST are used (Ortolani et al. o:99 (1999)). For the highly absorbed globular cluster Terzan 6 the results of Barbuy et al. (ba:97 (1997)) are used, while the metallicity of Liller 1 is taken from the infrared measurements of Frogal et al. (f:95 (1995)).
The metallicities of the studied globular clusters range from strongly underabundant compared to solar (NGC 7078, [Fe/H] = ), to around solar (Liller 1, [Fe/H] = +0.25). Such a wide range of metallicity should allow any dependence of the X–ray properties on this parameter to be probed. However, we caution that the material being accreted does not necessarily have the same metallicity as the host globular cluster since the companion star may have undergone a non-standard evolution during which its envelope composition was altered.
The extinctions to the studied globular clusters range from low (, NGC 1851) to strongly absorbed (, Liller 1). The amount of extinction strongly affects the low-energy cut-off of the X–ray data and so the sensitivity to any low-energy spectral components. As an example, the X–ray source in NGC 1851 is visible using BeppoSAX down to 0.1 keV, while that in Liller 1 is only detected above 1 keV.
A summary of all previous observations of the Globular Clusters luminous X–ray sources can be found in Sidoli et al. (2000b ).
3 Observations
Results from the Low-Energy Concentrator Spectrometer (LECS; 0.1–10 keV; Parmar et al. p:97 (1997)), Medium-Energy Concentrator Spectrometer (MECS; 1.8–10 keV; Boella et al. b:97 (1997)), High Pressure Gas Scintillation Proportional Counter (HPGSPC; 5–120 keV; Manzo et al. m:97 (1997)) and Phoswich Detection System (PDS; 15–300 keV; Frontera et al. f:97 (1997)) on-board BeppoSAX are presented. All these instruments are coaligned and collectively referred to as the Narrow Field Instruments (NFI). The MECS and the LECS are grazing incidence telescopes with imaging gas scintillation proportional counters in their focal planes. The non-imaging HPGSPC consists of a single unit with a collimator that was alternatively rocked on- and 180′ off-source every 96 s during most of the observations. During the observations in the year 2000 the collimator remained on-source. The PDS consists of four independent non-imaging units arranged in pairs each having a separate collimator. Each collimator was alternatively rocked on- and 210′ off-source every 96 s during the observations.
| Globular | X–ray | BeppoSAX Observation | T | R | Inst. | d | Cluster | |||
|---|---|---|---|---|---|---|---|---|---|---|
| Cluster | Source | (hr) | Start | Stop | (ks) | (keV) | (kpc) | Fe/H | ||
| NGC 1851 | X 0512401 | 0.85 | 2000 Feb 23 12:44 | Feb 25 07:44 | 72.2 | 0.1–25 | LMP | 12.2 | 1.29 | 0.1 |
| Terzan 2 | X 1724304 | 1996 Aug 17 04:29 | Aug 18 05:05 | 37.1 | 0.3–100 | LMHP | 10.0 | 0.25 | 4.0 | |
| Liller 1 | X 1730335 | 1998 Feb 27 03:30 | Feb 27 19:22 | 16.2 | 1.0–10 | LM | 7.9 | +0.25 | 10 | |
| 1998 Mar 02 19:57 | Mar 03 12:35 | 29.8 | 1.0–10 | LM | ||||||
| Terzan 1 | X 1732304 | 1999 Apr 03 12:52 | Apr 04 15:29 | 47.1 | 2.0–10 | M | 5.2 | 0.71 | 6.8 | |
| NGC 6440 | X 1745203 | 1998 Aug 26 02:11 | Aug 26 14:36 | 21.6 | 0.4–100 | LMHP | 7.0 | 0.34 | 3.5 | |
| NGC 6441 | X 1746370 | 5.7 | 1999 Apr 04 18:07 | Apr 05 20:23 | 49.9 | 0.25–30 | LMHP | 10.7 | 0.53 | 1.3 |
| Terzan 6 | X 1747313 | 12.4 | 1998 Sep 06 06:16 | Sep 06 19:02 | 28.9 | 0.5–50 | LMHP | 7.0 | 0.61 | 7.4 |
| NGC 6624 | X 1820303 | 0.2 | 1997 Oct 02 06:45 | Oct 02 19:90 | 22.3 | 0.3–30 | LMHP | 8.1 | 0.37 | 0.9 |
| 1998 Apr 17 04:14 | Apr 18 03:12 | 37.5 | 0.3–30 | LMHP | ||||||
| 1998 Sep 23 12:44 | Sep 24 15:30 | 48.3 | 0.3–30 | LMHP | ||||||
| NGC 6712 | X 1850087 | 0.3 | 1997 Apr 24 11:47 | Apr 25 11:09 | 42.0 | 0.3–50 | LMHP | 6.8 | 1.01 | 1.4 |
| NGC 7078 | X 2127+119 | 17.1 | 1999 Nov 16 01:15 | Nov 17 00:50 | 35.5 | 0.1–100 | LMP | 10.5 | 2.17 | 0.2 |
Table 1 lists the BeppoSAX observations used in this survey together with some basic information about each globular cluster (see Sect. 2). The observations of Terzan 2 and NGC 6712 were made prior to the failure of one of the MECS units. Data from the entire observations were accumulated, except for the following sources: (1) X 1730335 (the Rapid Burster, hereafter RB). BeppoSAX carried out a total of 7 observations, partly analysed by Masetti et al. (m:00 (2000)), which were extracted from the archive and examined for the presence of bursts. Only two observations included sufficiently long quiescent intervals for this study (see Table 1). (2) For the 5.7 hour dip source X 1746371 the dipping and bursting intervals discussed in Parmar et al. (p:99 (1999)) were excluded. (3) The eclipse observed from the 12.4 hr eclipsing system X 1747313 (In ’t Zand et al. i:00 (2000)) was excluded. (4) The bursts seen from X 0512401, X 1724304, and X 1745203 were excluded. Table 1 also indicates the instruments that were used in the spectral analysis of each source. In the case of the faintest source studied (Terzan 1, 0.014 MECS counts s-1) only the MECS was used, while for the slightly brighter Liller 1 observations the LECS and MECS were used. If available, all the NFI were used for the brightest sources.
Since previous analyses used different software and calibration releases, all relevant data were re-extracted. As usual, good data were selected from intervals when the elevation angle above the Earth’s limb was for the LECS and for other instruments and when the instrument configurations were nominal. This was done by using the SAXDAS 2.0.0 data analysis package. LECS and MECS data were extracted centered on the source positions using radii of 8′ and 4′, respectively, corresponding to about 95% of the total source photons. In the case of the RB extraction radii of 4′ and 2′ were used in order to minimize the contribution from the 32′ distant bright X–ray source 4U 1728337. Similarly, data from the non-imaging instruments were not included in the RB fits. Background subtraction for the imaging instruments was performed using standard files; this is not a critical procedure for the bright sources studied here (with the exception of Terzan 1). Background subtraction for the non-imaging instruments was carried out using the offset pointing intervals. In the case of observations were the HPGSPC remained coaligned, background subtraction was performed using data obtained when the instrument was looking at the dark Earth.
The overall spectra extracted as described above were first investigated by simultaneously fitting data from as broad a band as possible. The LECS and MECS spectra were rebinned to oversample the full width half maximum of the energy resolution by a factor 3 and to have additionally a minimum of 20 counts per bin to allow use of statistics. The HPGSPC and PDS spectra were rebinned using the standard techniques in SAXDAS. Data were selected from within the energy ranges 0.1–8.0 keV (LECS), 1.8–10 keV (MECS), 8.0–20 keV (HPGSPC), and 15–100 keV (PDS) whenever a sufficient number of counts were obtained (see Table 1). The photo-electric absorption cross sections of Morrison & McCammon (m:83 (1983)) and the solar abundances of Anders & Grevesse (a:89 (1989)) are used throughout. Factors were included in the spectral fitting to allow for normalization uncertainties between the instruments. These factors were constrained to be within their usual ranges during the fitting (Fiore et al. f:99 (1999)). An additional uncertainty of 1% was added quadratically to the uncertainties to account for systematic uncertainties in instrumental responses.
Since we wish to investigate the spectral properties of the sources, we first attempted to find a general spectral model that could be successfully applied to all the sources. Many luminous LMXB are fit with a two component model consisting of a blackbody, or blackbody-like component which might represent emission from an optically thick accretion disk or from the neutron star surface, together with a Comptonized component which may be interpreted as emission from a hot inner disk region or a boundary layer between the disk and the neutron star. For the soft component we tried both a single blackbody model and a disk-blackbody component, in the formulation of Mitsuda et al. (m:84 (1984)) and Makishima et al. (m:86 (1986)). The disk-blackbody model assumes that the gravitational energy released by the accreting material is locally dissipated into blackbody radiation, that the accretion flow is continuous throughout the disk, and that the effects of electron scattering are negligible. There are only two parameters in this model, where is the innermost radius of the disk, i is the inclination angle of the disk and the blackbody effective temperature at . Some limitations of this model are discussed in Merloni et al. (mfr:99 (2000)).
For the Comptonized component the xspec model comptt (Titarchuk ti:94 (1994); Hua & Titarchuk h:95 (1995); Titarchuk & Lyubarskij tl:95 (1995)), which self-consistently calculates the spectrum produced by the Comptonization of soft photons in a hot plasma, was used. This model contains as free parameters the temperature of the Comptonizing electrons, kTe, the plasma optical depth with respect to electron scattering and the input temperature of the soft photon (Wien) distribution (kT0). A spherical geometry was assumed for the comptonizing region.
Fit result to the broad-band spectra with the single blackbody plus Comptonization and disk-blackbody plus Comptonization are reported in Tables 2 and 3 respectively. A single temperature blackbody plus a cut-off power-law model was also tried, but with unacceptable results in the majority of the sources. Since the disk-blackbody plus Comptonization emission (Table 3) always gives a better (or equally good) fit than single blackbody plus Comptonization emission (Table 2), we will refer to it as the “standard” model.
| Globular | L | k | kTe | fbb | /dof | ||||
|---|---|---|---|---|---|---|---|---|---|
| Cluster | (keV) | (keV) | (keV) | (km) | |||||
| NGC 1851 | 0.14 | 153.2/97 | |||||||
| Terzan 2 | 0.15 | 197.1/178 | |||||||
| Liller 1 | 4.2 | 1.5 | 4.0 | 0.14 | 100.7/90 | ||||
| … | … | … | 71.0/57 | ||||||
| Terzan 1 | 0.66 | 0.48 | 2.2 | 20 | … | … | … | 18.4/11 | |
| NGC 6440 | 0.05 | 101.5/107 | |||||||
| NGC 6441 | 0.04 | 117.6/106 | |||||||
| Terzan 6 | 0.29 | 144.5/119 | |||||||
| NGC 6624 | 0.05 | 268.2/120 | |||||||
| 0.05 | 232.5/117 | ||||||||
| 588.4/134 | |||||||||
| NGC 6712 | 0.34 | 181.1/154 | |||||||
| NGC 7078 | 0.24 | 375.5/124 |
| Globular | L | k | kTe | f | /dof | ||||
|---|---|---|---|---|---|---|---|---|---|
| Cluster | (keV) | (keV) | (keV) | (km) | |||||
| NGC 1851 | 0.14 | 126.1/97 | |||||||
| Terzan 2 | 0.12 | 191.5/178 | |||||||
| Liller 1 | 0.50 | 37,000 | 0.05 | 100.6/90 | |||||
| … | … | … | 71.0/57 | ||||||
| Terzan 1 | 0.66 | 0.48 | 2.2 | 20 | … | … | … | 18.4/11 | |
| NGC 6440 | 0.14 | 84.8/107 | |||||||
| NGC 6441 | 10 | 107.3/106 | |||||||
| Terzan 6 | 2.16 | 136.5/119 | |||||||
| NGC 6624 | 0.36 | 152.1/120 | |||||||
| 0.18 | 182.2/117 | ||||||||
| 627.7/134 | |||||||||
| NGC 6712 | 0.76 | 160.0/154 | |||||||
| NGC 7078 | 2.0 | 284.8/124 |


4 Spectral Fit Results: the Standard Model
The results of fitting the standard model to all of the extracted spectra are given in Table 3. All spectral uncertainties and upper-limits are given at 90% confidence. The fits to all the spectra are acceptable with the exception of NGC 7078 where the is 284.8 for 124 degrees of freedom (dof), and the second and third observation of the source in NGC 6624. Since a different model is a better representation of the NGC 7078 X–ray spectrum, probably due to the ADC nature of this source (see Sidoli et al. s:00 (2000)), we exclude it from the discussion, though the results of the fitting procedures have been included in Tables 2 and 3, for completeness. We note that an acceptable fit (a of 100.0 for 109 dof) can also be obtained without the disk-blackbody component for NGC 6440. In the case of Liller 1 and Terzan 1 the sources are too faint to derive accurate spectral parameters. Moreover Liller 1 was not sampled at energies greater than 10 keV due to the reasons explained in Sect. 3. We include results from these sources in Tables 2 and 3 for completeness, but do not consider them further. Fig. 1 shows the photon spectra of the remaining sources derived using the standard model. This figure clearly illustrates the importance of the broad-band coverage afforded by BeppoSAX in clearly separating the two components. Bolometric luminosities have been calculated using the energy range 0.1–100 keV and assuming that the observed is interstellar. The results in Sect 4.1 indicate that for the majority of sources this assumption is valid.
4.1 Low-energy absorption
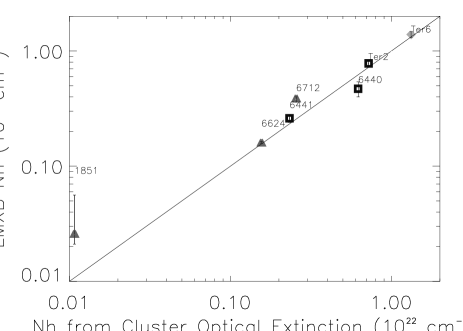
We first compared the fitted values of low-energy absorption, , with the values predicted using the relation between the optical extinction, , and absorption of derived by Predehl & Schmitt (ps:95 (1995)). If there is no additional absorption present in the X–ray binaries themselves, and their low-energy X–ray continua have been properly characterized, then a good agreement is expected between the values derived from the globular cluster measurements, and those from the LMXB X–ray spectra. Fig. 2 shows the measured values of taken from Table 3 plotted against the optically derived values of . The straight line shows the locus of points with equal optical and X–ray derived values.
In general, there is good agreement between the two absorption measurements. In the case of X 1745203, located in NGC 6440 the X–ray derived is 0.75 that expected (a difference of atom cm-2). This may suggest the presence of an additional soft X–ray component that, not being included in the spectral model, leads to an underestimate of the absorbing column. Alternatively, the overall X–ray continuum model might be incorrect. We note that also the blackbody plus comptt model does not provide a good estimate of the column density, being even much lower. In ’t Zand et al. (i:99 (1999)) find that the spectrum of X 1745203 may also be modeled using either a broken power-law and blackbody, or a high-energy cut-off power-law, or a bremsstrahlung and blackbody. In these 3 cases, the derived values of are in the range 6.7–9.0 atom cm-2, similar to that predicted from the measurement of atom cm-2. In the case of X 1850–087 located in NGC 6712 the X–ray derived , of atom cm-2, is significantly higher than that derived from the optical of atom cm-2. This may suggest the presence of extra absorbing material in this system. However, when fitting this spectrum with a single blackbody plus Comptonization, a much lower column density is found ( atom cm-2).
4.2 Disk-blackbody component
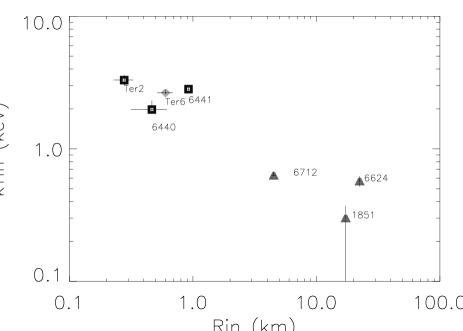
The soft emission from luminous globular cluster sources is succesfully fit with a multicolor disk-blackbody component. If we interprete this model “literally”, its normalization translates into a lower limit for the innermost radius rin of the accretion disk, Rin=. Except for NGC 1851 and NGC 6624 (where the inclination cannot be constrained), the values observed are generally low, thus requiring a quite high inclination angle of the binary systems, for rin to be larger than the last stable orbit for an accretion disk around a neutron star (6GM/c29 () km). We note that still higher inclinations would be derived if the Merloni et al. (mfr:99 (2000)) correction to the disk-blackbody model were taken into account. For several globular cluster sources, a confirmation of their high inclination angles comes from X–ray and optical observations. In particular, the presence of strong sinusoidal–like modulations in the X–ray flux (as in the case of the ADC source NGC 7078), partial X–ray eclipses of the central source by the companion star (Terzan 6), X–ray dips (NGC 6441) are all indicative of inclination angles 60–70∘ (Frank et al. f:87 (1987)).
The temperature kTin at the inner disk radius is 0.5–3.5 keV, with the three ultra-compact binaries (NGC 1851, NGC 6712, NGC 6624; P hr) displaying significantly lower temperatures (1 keV) compared to all other sources (1.5–3.5 keV). The variation of kTin and inner radius of the accretion disk is displayed in Fig. 3, while the variation with the disk luminosity, measured in the 0.1–100 keV energy range, is shown in Fig. 4 and Fig. 5.
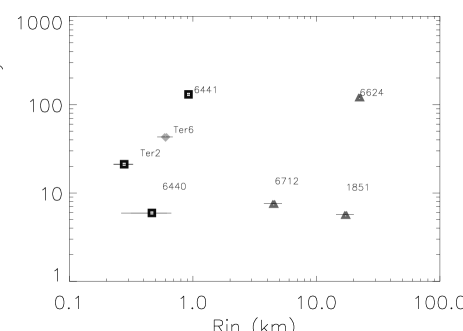
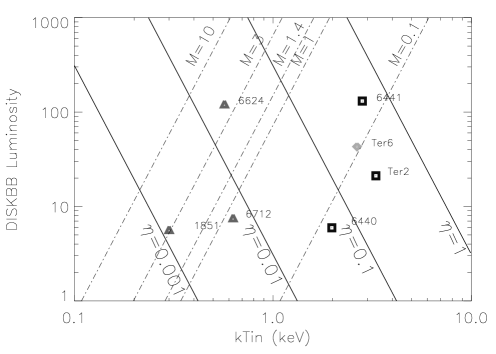
In the disk–blackbody model, the bolometric luminosity, Lbol, of the accretion disk can be related to the temperature kTin and the mass M of the compact object (see e.g., Eqs. 9 and 11 in Makishima et al. mkm:00 (2000)) as L. A summary of the parameters derived from the disk–blackbody component is shown in Fig. 5, where the globular cluster sources appear to be divided into two groups: the ultra-compact binaries, with kT1 keV, the inferred masses of which are compatible with that of a neutron star, and sources with kT1 keV, located on grids with much lower inferred masses for the compact object. Since all these X–ray binaries (except Terzan 6) are known to harbor a neutron star, due to their Type I X–ray bursting activity, either the multi–colour disk–blackbody is not an accurate model for the soft part of the spectrum, or their luminosity has been underestimated, possibly due to a very high inclination angle of the binary systems. Another explanation may be that the parameters derived in the framework of the disk-blackbody model cannot be related directly to physical quantities (see Merloni et al. mfr:99 (2000)).
4.3 Comptonization component
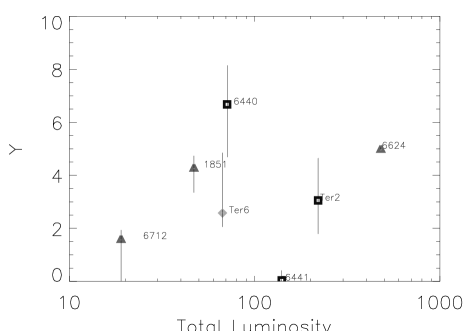
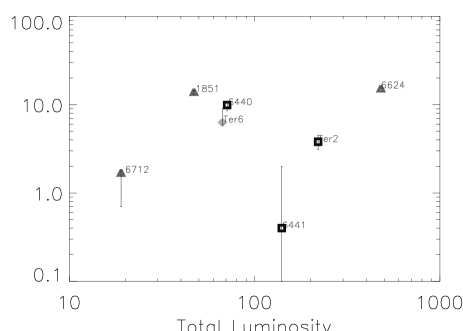
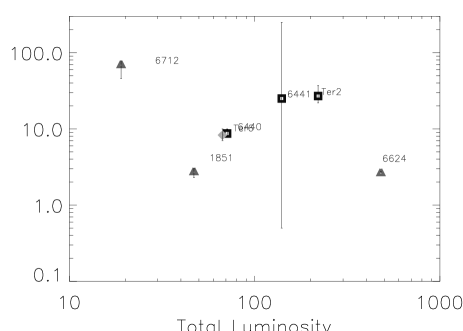
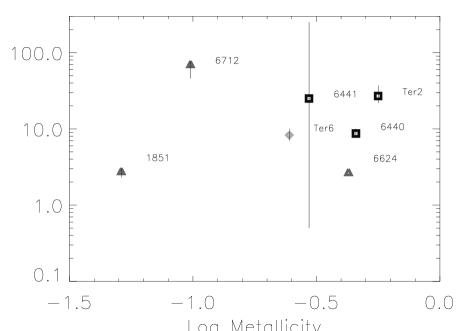
Thermal Comptonization (Titarchuk ti:94 (1994)) provides a good fit to the high energy region of the globular cluster sources spectra. The relations between the different parameters derived from the spectral analysis are shown in Figs. 6–11. The Comptonizing plasma has temperatures kTe ranging from few keV up to the extremely high value of 92 keV in the case of the ADC source in NGC 7078. The seed photons in all sources have temperatures kT01 keV while the Comptonization parameter , defined as =4kTmec2, is in the range 1–7, except for the very low value of 0.03 for the source in NGC 6441, that might be not in the right regime, since 1 and 1. The trend of y with the luminosity is shown in Fig. 6, suggesting that at least for some sources a correlation exists. The dependence of the plasma optical depths and of the electron temperatures kTe from the total luminosities are shown in Figs. 7 and 8.
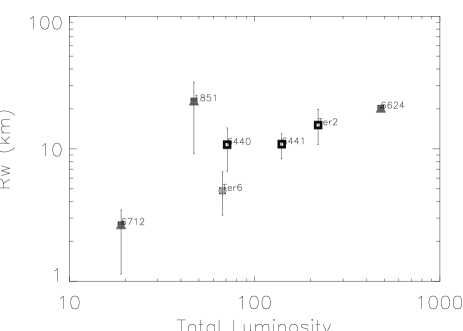
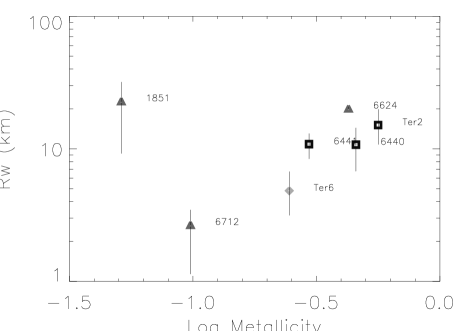
Following in’t Zand et al. (i:99 (1999)), an equivalent spherical radius RW of the emission area of the seed photons can be defined as R km, where d is the distance (in kpc), fcomptt is the comptonized flux (in erg cm-2 s-1, corrected for the interstellar absorption, 0.1–100 keV band) and kT0 is the seed temperature in keV. RW ranges from few km up to 1300 km (NGC 7078) and seems to correlate with the total luminosity (see Fig. 9), as RW L0.5 .
This might suggest that the seed photons originate from the boundary layer (the radial extent and height of which become larger with increasing accretion rates; e.g. Popham & Sunyaev ps:00 (2000)) rather than from the accretion disk. The comparison between RW and the lower limit Rin to the inner radius of the accretion disk is shown in Fig. 10.
In this respect, the comparison between the temperatures kT0 of the seed photons and the temperature kTin is interesting (see Fig. 11): among the globular cluster sources, only the ultra-compact binaries (located in NGC 1851, NGC 6624 and NGC 6712) display temperatures kT0 consistent with the temperature of the inner regions of the accretion disk.
4.4 Connection with the globular clusters metallicity
The galactic globular clusters hosting bright LMXBs are found to be both denser (except NGC 6712) and more metal-rich (except NGC 7078) (see Fig. 12), indicative of the fact that both the high density stellar environment and the metallicity could play a role in the formation mechanism of LMXBs, thought to be via tidal captures or “two plus one” stellar encounters (see Bellazzini et al. b:95 (1995)).

Besides the formation mechanism, it is interesting to investigate if the metallicity of the accreting matter (assumed to be the same of the hosting globular cluster) plays a role in the LMXBs spectral properties.
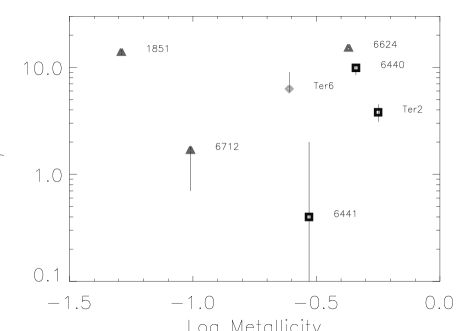
In Figs. 13–19 several parameters derived from the spectral analysis are plotted versus the metallicity ([Fe/H]) of the hosting globular cluster.
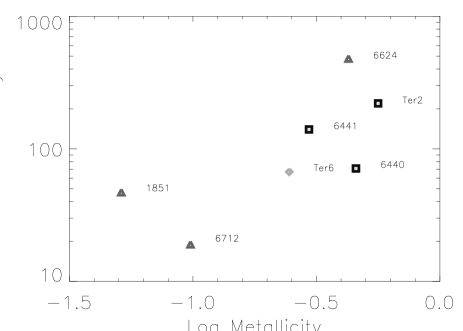
The positive correlation between disk temperature kTin and the metallicity displayed in Fig. 13 is opposite to the results of Irwin & Bregman (ib:99 (1999)), who studied in the ROSAT energy band the dependence of the X–ray properties of LMXBs on the metallicity of their environment, and found that the spectra of LMXBs become softer as the metallicity of their environment increases. However, we note that our correlation has a quite large probability of 11% to be obtained by chance; moreover, it might be spurious also for the reason that the three ultra-compact binaries, where the accreting matter should be essentially helium, are not expected to show a trend with the metallicity of the hosting globular cluster. Note that the same effect may be present when considering the apparent correlation between the total X–ray luminosity and the metallicity (see Fig. 15, probability of chance correlation of 20%). Moreover, no correlation is evident within the much more numerous X–ray sources residing in the M31 globular clusters (Verbunt et al. v:84 (1984)), in the same range of metallicity.
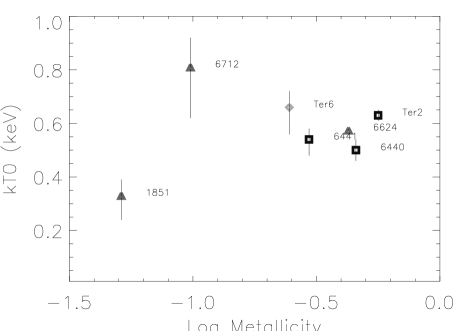
An apparent anticorrelation of the temperature of the seed photons kT0 with the metallicity is present, for sources in globular clusters more metallic than 0.1 solar (see Fig. 17). For the electron temperature kTe and the optical depth of the comptonizing plasma there are no obvious correlations with the metallicity of the accreting matter.
4.5 Iron line emission
All the sources analysed here do not display significant iron line emission, except for the source in NGC 6624, where a very weak narrow line is detected. The addition of a narrow Kα iron line to the standard model, resulted in the upper limits to the EW reported in Table 4.
| Cluster | EW (eV) |
|---|---|
| NGC 1851 | 11 |
| Terzan 2 | 25 |
| Liller 1 | 105 |
| Terzan 1 | 2200 |
| NGC 6440 | 45 |
| NGC 6441 | 15 |
| Terzan 6 | 25 |
| NGC 6624 | 13 |
| NGC 6712 | 13 |
| NGC 7078 | 33 |
5 Discussion
We have performed a systematic survey of the properties of the luminous X–ray sources located in globular clusters. A remarkable property of this sample of LMXBs containing neutron stars is their well known distance and interstellar absorption. This, together with the broad-band capabilities of the BeppoSAX Narrow Field Instruments, allowed us to properly model the 0.1–100 keV spectra, to accurately determine the X–ray luminosity for these sources and to study their general spectral properties in a range of luminosity spanning more than two order of magnitudes.
The spectral fitting gave satisfactory results with our spectral “standard” model, consisting of a disk-blackbody plus a Comptonized emission. Other two-component models, such as a cut-off power-law plus a single-blackbody or a single-blackbody plus Comptonization emission, almost always resulted in poorer quality fits.
However, although our standard model provides a good fit to the spectra of almost all the LMXBs studied, several problems arise with the physical interpretation of the resulting spectral parameters, especially when dealing with the disk-blackbody component.
Indeed, the resulting inner disk radii are too small, even for extreme inclination angles of the accretion disks, and, on the other hand, the inner disk temperature are high compared with other systems in the galactic plane, for which kTin1.5 is usually found (e.g. Tanaka & Lewin t:95 (1995)). For comparison, this same spectral model has been applied to the BeppoSAX data of two X–ray bursters, Ser X–1 and GX 3+1, finding a of 6.8 km and 2.8 km, respectively, and a disk temperature, kTin, of 1.46 and 1.95 keV (Oosterbroek et al. o:00 (2000)).
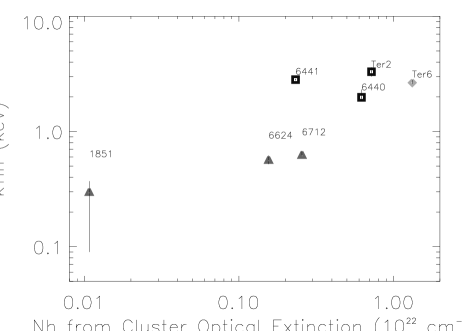
The only globular cluster sources for which the multicolor disk-blackbody model seems to reasonably represent the likely physical parameters of the disk are the ultra-compact binaries, located in NGC 1851, NGC 6712 and NGC 6624. In these three sources the disk-blackbody provides reasonable disk radii, and lower inner disk temperatures. Moreover, since in these three sources the temperature of the seed photons kT0 and the radius RW are in agreement with kTin and rin respectively, it is tempting to identify the inner disk as the region for the seed photons of the Comptonization emission. However, we note that the finding of a lower disk temperature kTin for the ultra-compact binaries could be partly due to the low interstellar absorption (as estimated from optical observations) towards these sources, with respect to other globular cluster sources (see Fig. 20).
For sources where temperatures kT0 were significantly different from kTin (NGC 6440, NGC 6441, Terzan 2 and Terzan 6), we tried also to fit their spectra with the “standard” model linking the temperatures kT0 and kTin together. The main result of this fit with respect to those reported in Table 3 is the values of the disk-blackbody parameters: the temperatures kT0=kTin were in the range 0.5–0.8 keV, the ratio f was less than 0.15 for all the three sources (remarkable, since previous analysis of the NGC 6441 spectrum resulted in a ratio f=10) and the disk-blackbody radii became 1–8.5 km. However, this alternative fit resulted in worse except for NGC 6440, for which an equally good was obtained.
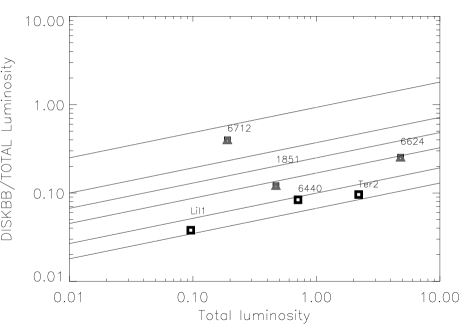
Another problem with the standard model arises from the relative contribution of the disk to the Comptonized component. Indeed, the ratio f of the disk-blackbody 0.1–100 keV luminosity to the Comptonized one, should be 1 (Sunyaev & Shakura ss:86 (1986)). But we find f1 for the sources NGC 7078 (the ADC source; f2), Terzan 6 (f2) up to the very high value of NGC 6441 (f=10). On the other hand, when a single-blackbody is used instead of the disk-blackbody, the ratio fbb is always less than 1 (see Table 2). NGC 6441 is an intriguing source: if a blackbody is used instead of the disk-blackbody, the Comptonization dominates the emission and the high energy region of the spectrum, whereas when a disk-blackbody model is used, the opposite is valid.
For the LMXBs where the interpretation of the soft component as contributed by the inner disk is reasonable, it is possible to estimate the strength of the neutron star magnetic field. The total luminosity Ltot of an accreting neutron star can be expressed as the sum of the luminosity liberated in the accretion disk Ldisk and the remaining luminosity dissipated at the neutron star radius Rns, where Ltot=GMns/Rns and Ldisk=GMns/2Rm (e.g., Priedhorsky p:86 (1986)). Rm is the magnetospheric radius R km, where B=B G is the magnetic field, Rns=R6 10 km, Mns=2 M2 is the neutron star mass, LL37 erg s-1 and the parameter accounts for the disk geometry of the accretion and is 0.5–1, (Ghosh & Lamb gl:79 (1979), gl:92 (1992)). Thus, the magnetic field strength of a neutron star can be estimated from the luminosity of the disk.
In Fig. 21 a grid with different neutron star magnetic fields, calculated assuming =1, =1 and =1, is superimposed on a plot of the ratio of disk to total luminosity, versus the total luminosity (0.1–100 keV). The ratio of Ldisk to Ltot is a measure of Rns/2Rm (Priedhorsky p:86 (1986)):
| (1) |
Assuming a 2 neutron star, this ratio depends only on the magnetic field strength and total luminosity. The ratio of Ldisk to Ltot reaches a maximum of 0.5 when Rm is equal to Rns; since the sources in NGC 6441, NGC 7078 and Terzan 6 have an unusually high disk-blackbody emission (as estimated from the disk-blackbody model used here), that led to ratios above the maximum allowed of 0.5, we will not consider them.
The magnetic field estimated in this way for the source X 1820–30 in NGC 6624 (2.1108 G) is in agreement with the value derived from the saturation of the kHz QPO frequencies (Campana ca:00 (2000)). In the case of the RB, we find a magnetic field (8 G) consistent, within a factor of 2, with that estimated by Masetti et al. (m:00 (2000)) using the propeller effect model.
6 Conclusions
We performed broad–band spectroscopy of the luminous X–ray sources located in a number of galactic globular clusters with BeppoSAX. The results can be summarized as follows:
-
•
All the spectra can be acceptably fit by the same two–component model, comprising high energy Comptonization emission together with a disk-blackbody accounting for the soft part of the spectrum, except for the source in NGC 6441, where the disk–blackbody dominates the high energy region.
-
•
In the framework of this “standard” model and as a result of the spectral fitting, the sources can be clearly divided into two groups, on the basis of their disk–blackbody parameters: (1) the sources located in NGC 1851, NGC 6712 and NGC 6624, and (2) all the other sources. Indeed, the disk–blackbody model, if literally interpreted, provides a physically reasonable interpretation for the first group of sources, while for the second group the disk–blackbody spectral parameters are not physically acceptable, displaying high inner disk temperatures and extremely low innermost radii of the accretion disks, too low even for edge-on binary systems. There is no obvious explanation for a factor of 3–10 lower disk temperatures in the ultra-compact binaries with respect to all the other systems; higher neutron star masses in ultra-compact binaries would contribute in reaching lower inner disk temperatures kTin, but cannot explain, alone, a factor of 3–10 lower disk temperatures with respect to other binary systems. Indeed, for systems with similar disk-blackbody luminosities, the ratio of the neutron star masses Mns1/Mns2, thus a factor of 3–10 in inner temperatures translates in a factor of 10–100 in neutron star masses.
-
•
For the first group of sources, the Comptonization emission has seed photons temperatures kT0 and radii RW consistent with their inner disk temperatures kTin and radii for the accretion disks , respectively. This could be interpreted with Comptonization sustained and fed by the inner regions of the accretion disks. Interestingly, this first group of sources is composed of the ultra-compact binary systems. If this result is indicative of a spectral signature of the ultra-compact binaries, we suggest that the ultra-compact binary located in NGC 6652 will display the same spectral behavior and that, among the sources here studied for which both the orbital period and the optical counterpart are unknown, no other ultra-compact binary systems are present.
-
•
In all other sources (group 2), the temperatures of the seed photons (kT0) are significantly lower than the temperatures kTin.
-
•
There is no strong evidence for a correlation of Comptonization spectral parameters with total luminosity L (0.1–100 keV), except for the radius RW of the emission area of the seed photons, for which RW L
The search for correlations of the spectral parameters with the metallicity of the hosting globular clusters led to the following results:
-
•
The temperature kTin of the inner radius increases as the metallicity of the hosting cluster increases, and the opposite is true for the inner disk radius, except for the source in NGC 6624. This trend could be spurious, since in the three ultra-compact binaries the accreting matter might be only helium. On the other hand, if this is real, it suggests that matter accreting in the ultra-compact binaries NGC 1851 and NGC 6712 is probably not pure helium.
-
•
The total luminosity L (0.1–100 keV) seems to increase with the metallicity, but again this trend could be spurious, since it is mainly based on the behavior of the ultra-compact binaries.
-
•
There is no clear evidence for a correlation of the Comptonization spectral parameters with metallicity.
-
•
We caution that an observational bias could be present due to the galactic absorption in the direction of the globular cluster sources: lower disk–temperatures kTin have been derived for sources with low interstellar absorption, and these happen to be the ultra-compact binaries.
In a literal interpretation of the disk-blackbody model, the luminosity of the accretion disk, for the sources with a ratio f1, is used to derive an estimate of the neutron star magnetic field. We note that, for the two sources for which an independent estimate of the magnetic field exists (the RB and X1820–303, located in NGC 6624), there is a good agreement with the values derived here.
On the other hand, problems exist with a physical interpretation of the spectral parameters of the disk-blackbody component, since we obtained resonable values for the radii of the inner disks only in the case of the ultra-compact binaries. From the similarities between radii and temperatures of the inner accretion disk and the parameters of the “seed” photons in the Comptonization emission, we propose that in the ultra-compact binaries in NGC 1851, NGC 6712 and NGC 6624 the Componization is fed by the inner regions of the accretion disk, while this is not the case for all other sources (in NGC 6440, NGC 6441, Terzan 2 and Terzan 6). It is unclear why the disk-blackbody model gives physically reasonable results only in the case of the ultra-compact binaries. A possibility may be related to the mass ratio, q, which is similar in the ultracompact binaries and binary systems containing black holes. Indeed, physically reasonable parameters are usually obtained from disk-blackbody fits to the soft emission from black hole X–ray binaries (see, e.g., Tanaka & Lewin t:95 (1995)).
Acknowledgements.
The BeppoSAX satellite is a joint Italian-Dutch programme. We thank the staffs of the BeppoSAX Science Data and Operations Control Centers for help with these observations. L. Sidoli acknowledges an ESA Fellowship.References
- (1) Anders E., Grevesse N., 1989, Geochimica et Cosmochimica Acta 53, 197
- (2) Barbuy B., Ortolani S., Bica E., 1997, A&AS 122, 483
- (3) Bellazzini M., Pasquali A., Federici L., et al., 1995, ApJ 439, 687
- (4) Boella G., Chiappetti L., Conti G., et al., 1997, A&AS 122, 327
- (5) Campana S., 2000, ApJ 534, L79
- (6) Carretta E., Gratton R.G., Clementini G., Fusi Pecci F., 2000, ApJ 533, 215
- (7) Djorgovski S., 1993, ASP Conf. Ser. 50, 373
- (8) Fiore F., Guainazzi M., Grandi P., 1999, Technical Report version 1.2 (BeppoSAX Scientific Data Center)
- (9) Frank J., King A.R., Lasota J.P., 1987, A&A 178, 137
- (10) Frogal J.A., Kuchinski L.E., Tiede G.P., 1995, AJ 109, 3, 1154
- (11) Frontera F., Costa E., Dal Fiume D., et al., 1997, A&AS 122, 371
- (12) Ghosh P., Lamb F.K., 1979, ApJ 234, 296
- (13) Ghosh P., Lamb F.K., 1992, in van den Heuvel E.P.J., Rappaport S.A. (eds.) “X–ray Binaries and Recycled Pulsars”, (Dordrecht: Kluwer), p. 487
- (14) Guainazzi M., Parmar A.N., Segreto A., et al., 1998, A&A 339, 802
- (15) Guainazzi M., Parmar A.N., Oosterbroek T., 1999, A&A 349, 819
- (16) Hertz P., Wood K.S., 1985, ApJ 290, 171
- (17) Hua X.-M., Titarchuk L., 1995, ApJ 449, 188
- (18) In ’t Zand J.J.M., Verbunt F., Strohmayer T.E., et al., 1999, A&A 345, 100
- (19) In ’t Zand J.J.M., Bazzano A., Cocchi M., et al., 2000, A&A 355, 145
- (20) Irwin J.A., Bregman J.N., 1999, ApJ 510, L24
- (21) Makishima K., Maejima Y., Mitsuda K., et al., 1986, ApJ 285, 712
- (22) Makishima K., Kubota A., Mizuno T., 2000, ApJ 535, 632
- (23) Manzo G., Guarrusso S., Santangelo A., et al., 1997, A&AS 122, 341
- (24) Masetti N., Frontera F., Stella L., et al., 2000, A&A in press
- (25) Merloni A., Fabian A.C., Ross R.R., 2000, MNRAS 313, 193
- (26) Mitsuda K., Inoue H., Koyama K., et al., 1984, PASJ 36, 741
- (27) Morrison D., McCammon D., 1983, ApJ 270, 119
- (28) Ortolani S., Bica E., Barbuy B., 1994, A&A 286, 444
- (29) Ortolani S., Barbuy B., Bica E., et al., 1999, A&A 350, 840
- (30) Oosterbroek T., Barret D., Guainazzi M., Ford E.C., 2000, preprint (astro-ph/0010609), A&A in press
- (31) Parmar A.N., Stella L., Giommi P., 1989, A&A 222, 96
- (32) Parmar A.N., Martin D.D.E., Bavdaz M., et al., 1997, A&AS 122, 309
- (33) Parmar A.N., Oosterbroek T., Guainazzi M., et al., 1999, A&A 351, 225
- (34) Popham R., Sunyaev R., 2000, preprint (astro-ph/0004017), ApJ submitted
- (35) Predehl P., Schmitt J.H.M.M., 1995, A&A 293, 889
- (36) Priedhorsky W., 1986, ApJ 306, L97
- (37) Sidoli L., Parmar A.N., Oosterbroek T., 2000, A&A 360, 520
- (38) Sidoli L., Parmar A.N., Oosterbroek T., et al., 2000b, in Giacconi R., Stella L., Serio S. (eds.), Proc. of “X–ray Astronomy 2000”, Palermo, Sept. 2000, ASP Conf. Ser. in press
- (39) Sunyaev R., Shakura N.I., 1986, Sov. Astron. Lett. 12, 117
- (40) Tanaka Y., Lewin W.H.G., 1995, in Lewin W.H.G., van Paradijs J., van den Heuvel E.P.J. (eds.) “X–ray Binaries”, Cambridge University Press, Cambridge, p. 126
- (41) Titarchuk L., 1994, ApJ 434 570
- (42) Titarchuk L., Lyubarskij Y., 1995, ApJ 450, 876
- (43) Verbunt F., van Paradijs J., Elson R., 1984, MNRAS 210, 899
- (44) Verbunt F., Bunk W., Hasinger G., Johnston H., 1995, A&A 300, 732
- (45) White N.E., Stella L., Parmar A.N., 1988, ApJ 324, 363