H i Emission and Absorption in the Southern Galactic Plane Survey111Given as an oral presentation at ASA2K, Hobart, Tasmania, July 2000
Abstract
We present preliminary results from the Southern Galactic Plane Survey (SGPS) Test Region and Parkes data. As part of the pilot project for the Southern Galactic Plane Survey, observations of a Test Region (; ) were completed in December 1998. Single dish observations of the full survey region (; ) with the Parkes Radio Telescope were completed in March 2000. We present a sample of SGPS H i data with particular attention to the smallest and largest scale structures seen in absorption and emission, respectively. On the large scale, we detect many prominent H i shells. On the small scale, we note extremely compact, cold clouds seen in H i self-absorption. We explore how these two classes of objects probe opposite ends of the H i spatial power spectrum.
1 Department of Astronomy, University of Minnesota, 116 Church
St. S.E., Minneapolis, MN 55455, USA
naomi@astro.umn.edu, john@astro.umn.edu
2 Center for Space Research, Massachusetts Institute of Technology,
70 Vassar St., Cambridge, MA 02139, USA
bmg@space.mit.edu
3 Astrophysics Department, School of Physics, Sydney University,
NSW 2006
agreen@physics.usyd.edu.au
4 Australia Telescope National Facility, CSIRO, P.O. Box 76,
Epping, NSW 2121
Raymond.Haynes@atnf.csiro.au, Mark.Wieringa@atnf.csiro.au
Keywords: Galaxy — ISM: bubbles, clouds, structure
1 Introduction
The Southern Galactic Plane Survey (SGPS) is an H i spectral line and 21-cm continuum survey of the fourth quadrant of the plane of the Milky Way (Dickey et al. 1999). The survey covers the region ; . The dataset, which is a combination of data from the Australia Telescope Compact Array (ATCA) and the Parkes Radiotelescope, is sensitive to angular scales larger than . The ATCA data is a mosaic of 2212 pointings. The Parkes data, which was obtained with the inner seven beams of the multibeam receiver, has extended coverage to . The final data product includes H i data cubes with a spectral resolution of km and continuum maps in all four Stokes parameters.
Observations for the SGPS are expected to be finished in late 2000 with a full data release in early 2001. Currently the Parkes observations are complete, as are observations of the SGPS Test Region (; ). This paper is based on a talk given at the ASA Annual Meeting in July 2000. Here we present a representative sample of the SGPS H i data, including low resolution data from Parkes and full resolution data for the Test Region. The continuum emission has been subtracted from these H i data. A full description of the observations and data analysis are discussed in detail elsewhere (McClure-Griffiths et al. 2000a, 2000b).
In this introduction to the data we explore how the SGPS can contribute to our understanding of the interstellar medium (ISM) over a large range of size scales. The SGPS data span several orders of magnitude in angular size, allowing us to probe opposite ends of the H i spatial power spectrum over a significant portion of the inner Galaxy. On the large scale we are studying H i emission structures, particularly shells and supershells to understand the effect of these shells on the structure and dynamics of the ISM. The SGPS data may help us to understand how these deterministic structures are “pumping” the spatial power spectrum. On the small scale, we are using H i self-absorption (HISA) to probe the coldest, smallest clouds in the ISM. We seek to understand the ISM on all scales in between, but the clues may be at the furthest extremes.
2 H i Shells
We here present a small gallery of H i shells detected in the Test Region and the Parkes data. These shells represent a selection of the broad range of structures displayed by shells. They range in diameter from about 30 pc to 600 pc. H i shells provide an interesting environment in which to study the ISM because they are among the largest structures visible in the Galaxy. In addition, they are among the few discrete objects which are apparently deterministic in nature. They result from relatively well understood phenomena such as a supernova explosion for the smallest shells, or the combined effects of stellar winds and many supernovae for the largest shells. As the fossils of extremely energetic events they allow us to study how energy is injected into the ISM, and subsequently how that energy affects the ISM as it undergoes the transition from deterministic to turbulent in nature.
2.1 Local Shell
One of the smallest shells visible in the Test Region is extremely local. Figure 1 shows a greyscale of a large angular diameter shell centered at about , , km . Because of its local velocity, distance estimates are extremely uncertain. However, we used a standard rotation curve for the Galaxy (Fich, Blitz & Stark 1989), to estimate the kinematic distance to this shell to be in the range 350 pc to 1 kpc. At these distances the diameter is between 15 and 50 pc. There is also tentative evidence for slow expansion on the order of 4 km , though no front or back caps are detected. It should be noted, though, that random H i cloud motions are on the order of 6 km , making it difficult to place much confidence in the expansion velocity estimate. The small size of this shell suggests that it may be an old supernova remnant (SNR) which no longer radiates in the continuum. It is interesting to note, however, that the shell is extremely circular, far more so than a typical SNR.
2.2 Terminal Velocity Shell
There is another small shell at the terminal velocity of km . This shell, as shown in Figure 2, is centered on , and is at a kinematic distance of kpc. This distance translates into a physical diameter of pc. The shell stands out as the only feature in the H i channel maps near the terminal velocity that persists over many velocity channels. It is detectable from beyond the terminal velocity at km , where there is very little gas, to km , where it appears as a void surrounded by a great deal of H i emission. The structure remains changes very little over the entire velocity range. There are no obvious front or back caps and there is no evidence of continued expansion. With no obvious expansion it is difficult to hypothesize about the origins of the shell. Its size indicates that it, too may be an old supernova remnant, but its curious position at the terminal velocity suggests that it could be gas displaced from circular rotation by any number of possible influences.
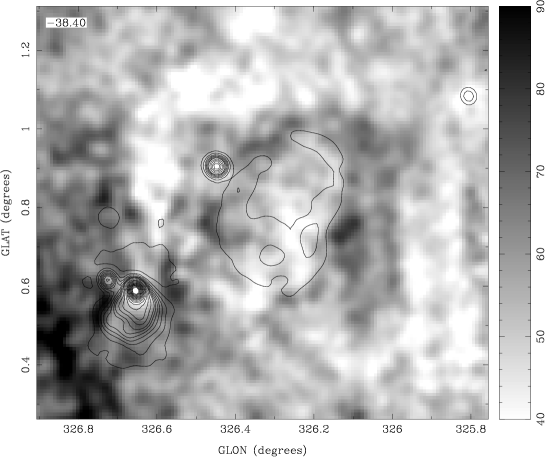
2.3 RCW 94 Shell
There is an H i shell surrounding the H ii region RCW 94 at , . The shell is itself surrounded by a ring of H i depletion. Figure 3 shows the H i channel map at km with continuum contours overlaid. The H i absorption distance for this H ii region is kpc, which agrees well with a distance of kpc determined by Caswell & Haynes (1987) using recombination line velocities. The distance implies a shell diameter of pc. There is evidence for a small expansion velocity of km . We speculate that this shell was formed in a molecular cloud, where the molecular hydrogen was dissociated by the H ii region, RCW 94. The depletion ring exterior to the shell is most likely an effect of the high molecular gas densities.
2.4 Supershells
Another class of H i shells are so-called “supershells”, with diameters on the order of hundreds of parsecs. Two large supershells have been discovered in the Parkes data (McClure-Griffiths et al. 2000b). These shells, GSH 277+0+36 and GSH 280+0+59, have diameters of 620 pc and 430 pc, respectively, in addition to showing evidence of break-outs above and below the Galactic plane (see Figures 4 and 5). These shells appear to lie on the far edge of the Carina arm in the interarm region. The energy required to form a shell of this size is extremely large, on the order of ergs. At that level of energy input, it is clear that supershells are one of the driving sources of energy in the ISM and have a significant impact on the structure of the Galaxy.
3 H i Self-Absorption (HISA)
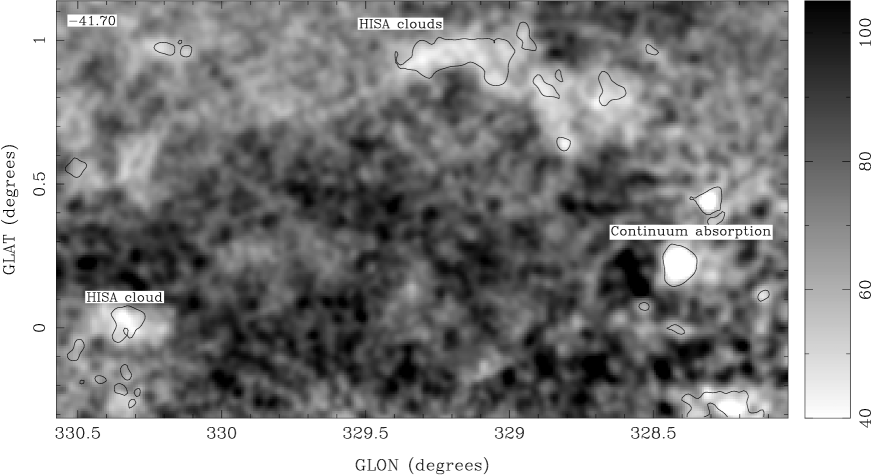
On the other end of the H i spatial power spectrum we are using H i self-absorption (HISA) to study the cold neutral medium (CNM). HISA occurs when cold foreground gas absorbs H i emission from warmer background gas at the same velocity. The correspondence of one velocity to two distances interior to the solar circle provides a prime opportunity for studies of HISA. HISA is characterized by extremely narrow velocity width ( km ) absorption features seen against the warmer background hydrogen emission. The small, cold clouds are also seen in the H i channel maps as in Figure 6. New high-resolution H i studies, such as the Canadian Galactic Plane Survey (Taylor et al. 1999), are revealing large numbers of cold clouds through HISA (Gibson et al. 2000). Because HISA does not require background continuum sources, it is an excellent way to study the cold neutral medium (CNM) throughout the Galaxy.
There are numerous HISA features in the SGPS Test Region. These cold clouds can be seen in the channel map shown in Figure 6. An absorption profile towards the cloud at , shows a characteristically narrow profile with a spin temperature of K (Figure 7). Most of these HISA features are in the velocity range km km which, at these longitudes, corresponds to the edge of the Scutum-Crux spiral arm. We suggest that these cold clouds may mark the compressed gas at the edge of the spiral shock, where molecular clouds are likely to form. While some HISA does clearly trace molecular emission, other HISA are isolated, suggesting cold gas that has not yet been compressed enough to form molecules (Gibson et al. 2000).
The smallest and most dramatic features tend to stand out in initial searches for HISA. In order to study the HISA in a statistically significant way, it will be necessary to develop non-subjective searching techniques. Such techniques have been developed for the CGPS data by Gibson et al. (2000). Similar techniques are being developed for the SGPS data. The many cold clouds detected in the CGPS and SGPS suggest excess emission fluctuations on the small side of the spatial power spectrum. It is possible that there are many warmer, less dense clouds that we are not detecting.
4 Questions and Future Work
There are several questions to be answered about the H i shells and H i self-absorption as we proceed with the SGPS. With the SGPS dataset we expect to catalogue many new shells. How are these shells distributed in the Galaxy? Do they lie along spiral arms like GSH 277+0+36 and GSH 280+0+59, or is their distribution seemingly random as in the Large and Small Magellanic Clouds (Kim et al. 1998; Staveley-Smith et al. 1997)? How large an impact do shells have on the global ISM? Will the Milky Way resemble the LMC and SMC which are dominated by shells?
With respect to the small scale structure, we ask: How are the HISA features distributed? Do they lie predominantly along spiral shocks or are they ubiquitous? How do they relate to the molecular clouds? What fraction of the ISM is in the CNM? Are there larger, warmer clouds that we are missing? How small are the numerous clouds that remain unresolved by the SGPS?
5 Conclusions
New large-scale, high-resolution H i surveys like the SGPS and CGPS finally make it possible to simultaneously study the small and large scale structure of the ISM. We hope that the SGPS dataset will allow us to understand how the large and small scale structures relate to each other throughout the inner Galaxy. The SGPS should be able to catalogue the majority of HI shells in the inner Galaxy and determine exactly how they shape the ISM. It is likely that we are currently seeing only the most dramatic cold clouds with HISA, however further studies may lead to a complete understanding the distribution of the CNM.
Acknowledgements
JMD and NMM-G acknowledge support of NSF grant AST-9732695 to the University of Minnesota. NMM-G is supported by NASA Graduate Student Researchers Program (GSRP) Fellowship NGT 5-50250. BMG acknowledges the support of NASA through Hubble fellowship grant HST-HF-01107.01-A awarded by STScI, which is operated by AURA Inc. for NASA under contract NAS 5-26555.
References
Caswell, J. L. & Haynes, R. F., 1987, A&A, 171, 261
Dickey, J. M., McClure-Griffiths, N., Gaensler, B., Green, A., Haynes, R., Wieringa, M., 1999, in New Perspectives on the Interstellar Medium, ASP Conf. Ser. 168, eds. A. R. Taylor, T. L. Landecker & G. Joncas, (San Francisco: ASP), 27
Fich, M., Blitz, L., & Stark, A. A., 1989, ApJ, 342, 272
Gibson, S. J., Taylor, A. R., Higgs, L. A., & Dewdney, P. E., 2000, ApJ, 540, 851
Kim, S., Dopita, M. A., Staveley-Smith, L., Bessell, M. S., 1998, AJ, 118, 2797
McClure-Griffiths, N. M., Green, A. J., Dickey, J. M., Gaensler, B. M., Haynes, R. F., Wieringa, M. H., 2000a, ApJ, submitted
McClure-Griffiths, N. M., Dickey, J. M., Gaensler, B. M., Green, A. J., Haynes, R. F., Wieringa, M. H., 2000b, AJ, 119, 2828
Staveley-Smith, L., Sault, R. J., Hatzidimitriou, D., Kesteven, M. J., McConnell, D., 1997, MNRAS, 289, 225
Taylor, A. R., 1999, in New Perspectives on the Interstellar Medium, ASP Conf. Ser. 168, eds. A. R. Taylor, T. L. Landecker & G. Joncas, (San Francisco: ASP), 3