s o \toctitleSpiral waves in accretion discs 11institutetext: Physics & Astronomy, Southampton University, Southampton SO17 1BJ, UK
Spiral waves in accretion discs - observations
Abstract
I review the observational evidence for spiral structure in the accretion discs of cataclysmic variablecataclysmic variables (CVs). Doppler tomographyDoppler tomography is ideally suited to resolve and map such co-rotating patterns and allows a straightforward comparison with theory. The dwarf nova IP Pegasi presents the best studied case, carrying two spiral armsspiral arms in a wide range of emission lines throughout its outburstoutbursts. Both arms appear at the locations where tidally driven spiral armsspiral waves are expected, with the arm closest to the gas stream weaker in the lines compared to the arm closest to the companion. Eclipse data indicates sub-Keplerian orbitKeplerian velocities in the outer disc. The dramatic disc structure changes in cataclysmic variable!dwarf novadwarf novae on timescales of days to weeks, provide unique opportunities for our understanding of angular momentumangular momentum transport and the role of density waves on the structure of accretion discs. I present an extension to the Doppler tomography technique that relaxes one of the basic assumptions of tomography, and is able to map modulated emission sources. This extension allows us to fit anisotropic radiationanisotropic emission from, for example, spiral armsspiral shocks, the irradiationirradiated companion star and disc-stream interaction sites.
1 Accretion discs and angular momentumangular momentum
The energetic phenomena associated with a wide range of accreting systems rely on the efficient conversion of potential energy into radiation and heat. In close binaries, the deep potential well of the compact object leads to mass transfer and accretion once the companion starsecondary star evolves and Roche equipotentialRoche lobe overflow commences. The efficiency of accretion is proportional to the compactness, , of the accreting compact star with mass and radius . As matter spills over near the first Lagrangian pointLagrangian point, it sets off on a ballistic trajectory towards the accretor. Its potential energy is converted into kinetic energy, but its net angular momentumangular momentum, due to orbital motion of the mass donorsecondary star, prevents a straightforward path to the accretor. The natural orbit for such matter is a circular Keplerian orbitKeplerian orbit corresponding to its specific angular momentumangular momentum. Instead of dumping material directly onto the compact star, the primary Roche equipotentialRoche lobe is slowly filled with a near Keplerian orbitKeplerian disc. Angular momentum needs to be dispersed within this accretion disc in order to allow gas to spiral inwards towards the compact star fkr .
It is the detailed process of angular momentumangular momentum transport that determines the structure of this accretion disc and therefore the rate at which gas, supplied from the mass donorsecondary star, is actually accreted by the compact object. Although so fundamental to the process of accretion through discs, our understanding of angular momentumangular momentum dispersal is very limited. We can roughly divide the possible physical mechanisms that may provide the required angular momentum transport into two classes. Those that work on a local scale and exchange angular momentumangular momentum among neighbouring parcels in the disc, and those that rely on global, large scale structures in the disc. The local processes are commonly referred to as ‘viscous processes’ even though it was clear that the molecular viscosityviscosity of the accretion disc material itself was many orders of magnitudes too small livio94 . Viscous interaction in the sheared Keplerian orbitKeplerian disc allows some material to spiral inwards, losing angular momentumangular momentum, while excess momentum is carried outwards by other parts of the flow. In the famous -parameterisation of Shakura & Sunyaev ss73 , this viscosityviscosity was replaced by a single dimensionless constant, which allows one to solve the structure equations for thin, viscously heated accretion discsaccretion disc!thickness pringle81 .
A very different way of transporting the angular momentumangular momentum is via density waves in the disc. In self-gravitating discs, the ability of density waves to transport angular momentum is a direct result from purely gravitational interaction between the wave and the surrounding disc material toomre69 ; bt87 . Waves of this type can still transport angular momentumangular momentum in the absence of self gravity, provided some mechanism exists that exchanges momentum between the wave and the fluid. Sawada et al. sawada conducted numerical simulations of mass transfer via Roche equipotentialRoche lobe overflow of inviscid, non self gravitating discs, and witnessed the development of strong spiral armsspiral shocks in the disc which were responsible for the bulk of the angular momentum transport throughout the flow. Such trailing spiral armsspiral patterns are the natural result of a tidal deformation of the disc that is sheared into a spiral armsspiral pattern by the (near) Keplerian orbitKeplerian rotation profile of the disc material savonije .
In this review I aim to give an overview of the observational efforts to study such spiral armsspiral structures in the discs of cataclysmic variablecataclysmic variables (CVs). Tomography is ideally suited for the study of disc structure, and the detection of a spiral armsspiral structure in the disc of IP PegasiIP Peg shh97 , 13 years after the work by Sawada et al., triggered a renewed interest in such models. Boffin, this volume, will focus on the theoretical side of the issue and the comparison between the observations and numerical simulations of spiral armsspiral waves in discs.
2 Prospect for detecting spiral waves in discs

Tidally generated spiral armsspiral waves are the result of tidal torques of the companion star on the orbiting disc material. Initially triggered at the outer edge of the disc, where the tidal interaction between the disc and the companion star is strongest, they take the form of trailing spiral armsspirals because the azimuthal velocity of the disc material is supersonicsupersonic and increases monotonically with decreasing distancedistance from the compact object (). Both the density as well as the disc temperature are much higher at the location of the spiral armsspirals, and continuum and line emission from such spiral armsspirals can thus be expected to be in clear contrast with the surrounding areas of the disc. This contrast depends on the density contrast in the wave, i.e. the strength of the shock, as well as local radiative transfer conditions.
Although predicted in the 80s, observational evidence for spiral armsspirals relies on the ability to spatially resolve the accretion discs in interacting binaries. Indirect imaging methods are thus required to search for such global disc asymmetries. Since the wave pattern is a co-rotating structure close to the orbital plane, Doppler tomographyDoppler tomography of strong emission lines is the ideal tool at hand. Although providing an image of the line emission distribution in velocity space, and not spatial coordinates, spiral armsspirals should be readily identified as they maintain their spiral shape in the velocity coordinate frame.
Since the application of Doppler tomographyDoppler tomography to the discs in CVs (Marsh, this volume), a range of objects have been imaged, showing a rich variety of accretion structures, but no clear evidence for spiral armsspiral arms in the accretion discs. This was part of the reason that the interest in spiral armsspiral waves diminished after a series of landmark papers in the late eighties spruit1 ; spruit2 , and a solution to the angular momentum puzzle was sought in local magneto-turbulent processes bh91 . In 1997, however, convincing observational evidence for tidally driven spiral armsspirals in the disc of a CV was found for the first time.
3 IP Pegasi in outburstoutburst
As part of a programme to study the disc evolution of the cataclysmic variable!dwarf novadwarf nova IP PegasiIP Peg through Doppler tomographyDoppler tomography, the system was observed just after rise to one of its outburstoutbursts. Although such outburstoutbursts occur regularly and have a characteristic recurrence time, one cannot predict them accurately. Obtaining scheduled telescope time during such outburstoutbursts is therefore not straightforward. For IP PegasiIP Peg, the average recurrence time for outburstoutbursts is 88 days, with a considerable RMS variation of 18 days thesis .
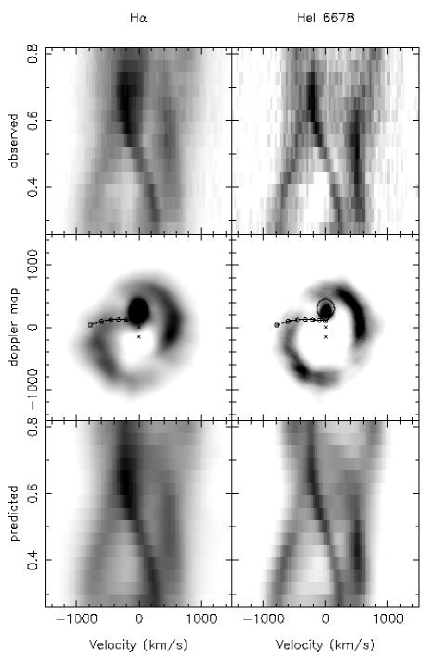
When a Doppler mapDoppler map was constructed of the hydrogen and helium emission from IP Pegasi, a surprising emission pattern was found shh97 ; shh98 . The accretion disc was far from symmetric, instead accretion disc!emissiondisc emission was dominated by a two armed pattern in the lower left and upper right quadrants of the Doppler mapDoppler map (Figure 1). The spiral armsspiral arm velocities range between 500 and 700 km/s, corresponding to the outer regions of the accretion disc. The emissivity contrast between the spiral armsspirals and other parts of the disc, is about a factor of 3 for H, and 5 in the case of HeI6678 emission. There is no evidence for line emission from the bright spotbright spot. The spiral armsspiral arm in the lower quadrant, closest to the secondary, extends over an angle of 100∘, and is weaker than the arm in the opposite quadrant. Strong emission from the irradiationirradiated secondary starsecondary star is also present, producing the prominent S-wave at low velocities.
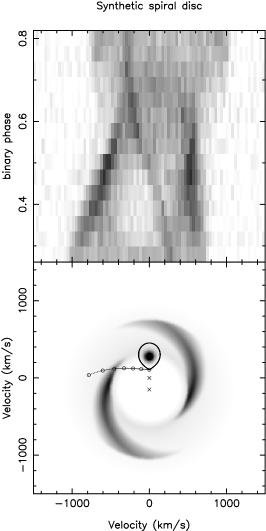
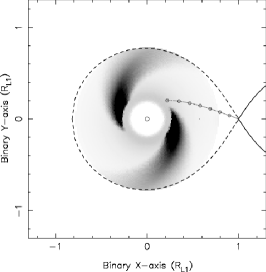
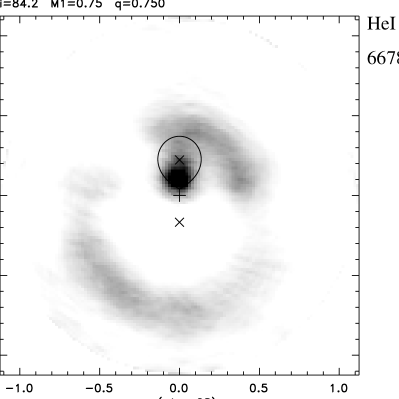
The location of this pattern corresponds closely to the radii and azimuths where tidally driven spiral armsspiral waves are expected. Although the Doppler mapDoppler map is in velocity coordinates, and not Cartesian position coordinates, a spiral armsspiral pattern in position space corresponds to a spiral armsspiral pattern in velocity space. In Figure 2, a simple disc model is shown containing an accretion disc around the white dwarf with a purely geometrical spiral armsspiral pattern and a Keplerian orbitKeplerian velocity field. The two armed trailing spiral armsspiral in position coordinates, maps into a similar two armed pattern in velocity space. Although this model is a purely geometric pattern, the location of the spiral armsspiral roughly corresponds to the location in the disc were tidally driven waves are expected from model simulations. Even such a simple model already captures most of the structure we observe in IP PegasiIP Peg, indicating that most of the accretion disc!emissiondisc emission in IP Peg during outburstoutburst is indeed localised in a two armed pattern.

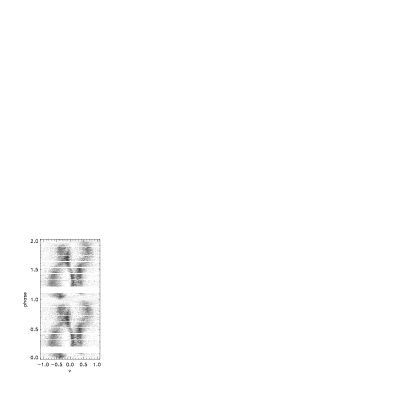
Let us look at the main signatures of spiral armsspiral arms in the observable line profiles based on our simple model. In Figure 3, the velocity and emissivity of the model disc is plotted as a function of azimuth in the Doppler Doppler maptomogram. Azimuth 0 corresponding to the positive Vy axis, increasing clock wise. The defining feature of a trailing spiral armsspiral is the change in velocity as a function of azimuth in the Doppler maptomogram. This corresponds to a change in radius as a function of azimuth in position coordinates that is determined by the opening angle of the spiral armsspiral, . The velocity field of the disc relates this geometrical opening angle to a particular velocity-azimuth relation in the Doppler mapDoppler map. In the spiral armsspiral arm dominated line profiles, this produces a regular motion of the double peaks, since azimuth in position coordinates translates to orbital phase in the observed spectrogram. Near orbital phases 0.25 and 0.75, the two arms cross over, producing a sudden jump in the position of the double peaks. For a symmetric Keplerian orbitKeplerian disc on the other hand, the line profile is symmetric and the velocity of the double peaks correspond to the velocity of the outer edge of the disc. This results in a constant double peak separation as a function of orbital phase and a circular disc image in the Doppler mapDoppler map. With a two armed spiral armsspiral, the double peaks move, varying their separation considerably and sharply across the binary orbit in a particular way. Although an identification in Doppler mapDoppler maps is perhaps more straightforward, spiralsspiral arms may thus also be identified in the observed line profiles directly.
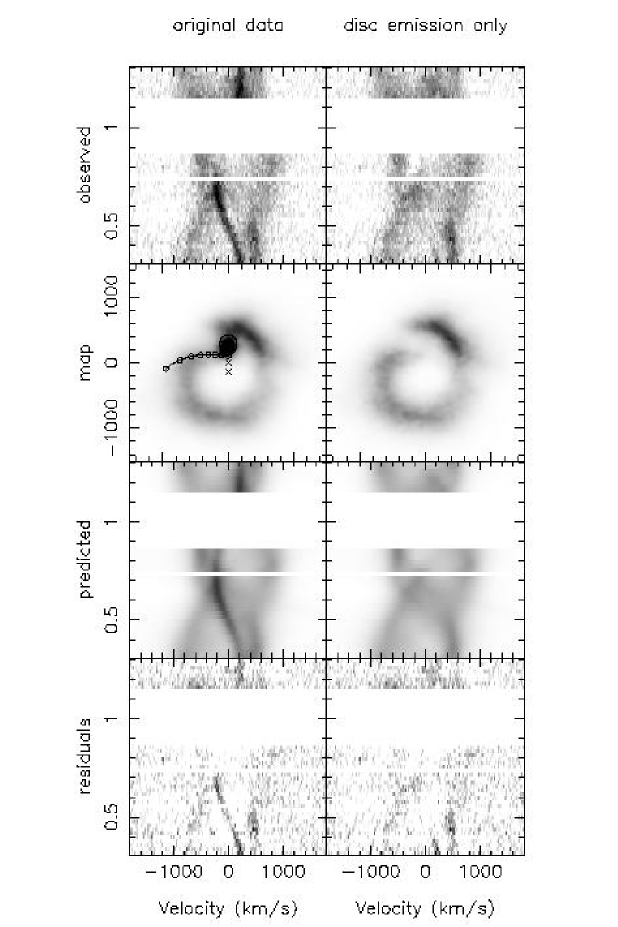
A week later, during the same outburstoutburst, more spectroscopy was obtained before the decline of the outburstoutburst had started. The Doppler image (Figure 4) shows that the spiral armsspiral pattern persists throughout the outburstoutburst, and the secondary star now makes a considerably larger contribution (from 6% to 10%) to the line flux. The arm in the upper right quadrant is still stronger, and the location of the arms have not changed, although the upper right arm appears shorter. To highlight the spiral armsspiral arms in the line profiles, the S-wave of the secondary starsecondary star was subtracted from the data in the following manner. A Roche lobe shaped mask was used to select all the emission from the secondary, which was then projected in order to produce the trailed spectrogram of the red star emission. This was subtracted from the observed data, and a Doppler image of the disc emission only was constructed (Figure 4, right). The dramatic phase dependence of the double peaks is now clearly visible, and is directly related to the two spiral armsspiral arms in the disc. This also confirms that the presence of a strong S-wave due to the mass donor does not distort the reconstructed disc structure, since they occupy different locations in the velocity plane.

3.1 Ionised Helium from the disc
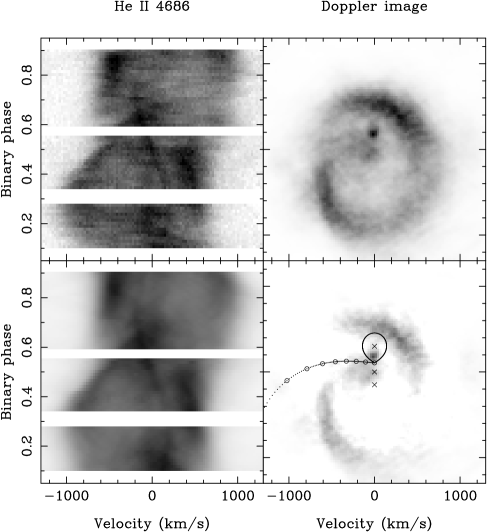
In a different outburstoutburst Harlaftis et al. har99 secured a whole orbit, including eclipse, of IP PegasiIP Peg with high spectral (40 km/s) and phase resolution (0.01). This time, the outburstoutburst started two days before the observations, and the HeII emission line at 4686Å was observed to provide a comparison with the previously observed H and HeI emission patterns. The trailed spectrogram of HeII (Figure 5), again shows the familiar behaviour of the double peaks from the disc, leading to a two armed spiral armsspiral in the Doppler Doppler maptomogram. A very similar emission pattern from the disc was also present in the nearby Bowen blend consisting of CIII/NIII emission and the Helium I line at 4471Å. The symmetric component of the map was calculated, using the velocity of the white dwarfwhite dwarf as the centre of symmetry, and subtracted in order to highlight the location of the two arms (Figure 5, bottom right).
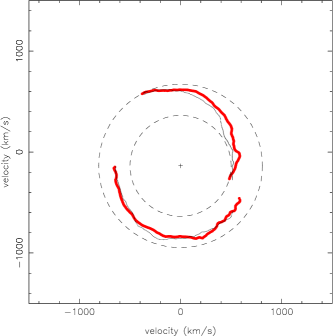
In order to characterise the properties of the spiral armsspirals quantitatively, we determined the position of the two spiral armsspiral arms as a function of velocity in the reconstructed Doppler maptomogram. A slice through the map, starting from the white dwarfwhite dwarf at km/s, was made for each azimuth in order to extract the radial profile. Each radial profile was then cross correlated with a Gaussian in order to determine the velocity of the spiralspiral arms at that particular azimuth. Figure 6 plots the fitted positions of the spiral armsspirals in the velocity plane together with two radial slices across the map. The two spiral armsspirals can be traced for almost 180 degrees, and the velocity of the arms varies from 495 km/s to 780 km/s, indicated by the two dashed circles. Near the azimuths where the spiral armsspiral cross over, the fitting assumptions break down as there is a sudden transition between the velocity of one arm and the next. Unfortunately, the contrast of the arms is too low to follow this switching with our cross correlation method, or a double Gaussian. The widths of the arms are significant, and even change as a function of azimuth. We are thus resolving an intrinsically broad feature. Such an analysis will clearly profit from even higher resolution and signal to noise data since at peak intensity the width of the arm is comparable to our resolution element, and the maximum entropyentropy constraint will tend to broaden features as much as is allowed by the signal to noise of the data.
A tidally distorted disc will not have a pure Keplerian orbitKeplerian velocity field, and we will see later that the observations indeed indicate this is not the case in IP PegasiIP Peg. However, we can estimate the radii corresponding to the velocity of the spiral armsspirals under the assumption of Keplerian orbitKeplerian velocities. The arms then cover a substantial part of the disc, between 0.3 and 0.9 times the distancedistance to the point, with the strongest emission from the outer regions. The dynamics of the majority of the accretion disc material are thus affected by the presence of these spiral armsspirals.
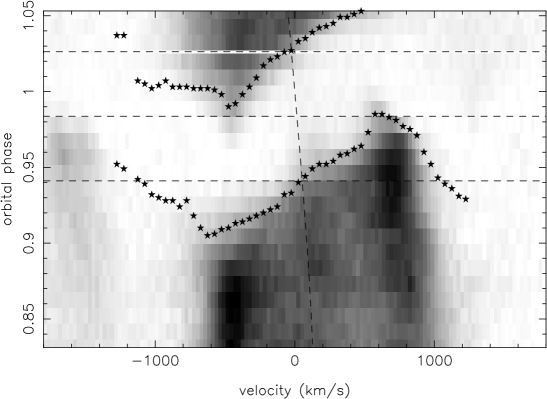
The eclipses of the lines are also affected by the large accretion disc asymmetry. In Figure 7, the eclipse of the Helium II emission line is plotted. For each velocity bin, the orbital phases where half the light is eclipsed are marked by asterisks. The outer disc on the blue-shifted peak is eclipsed first, followed by emission at higher, blue-shifted velocities. After the blue side of the disc is covered, the red-shifted is emission is progressively eclipsed, and during egressegress, the situation reverses. This is the classical pattern of the eclipse of a pro-gradely rotating discaccretion disc!emission, where the disc velocity increases with decreasing radius. A strictly Keplerian orbitKeplerian accretion disc would result in a smooth eclipse, symmetric around orbital phase 0. Mid-eclipse for the accretion disc!emissiondisc emission from IP PegIP Peg occurs considerably earlier (orbital phase 0.987) compared to the continuum, and most of the light is eclipsed well before white dwarfwhite dwarf ingressingress. A large asymmetry in the outer disc is thus corroborated by the eclipse. The distorted disc eclipse is a combination of the spiral asymmetry as well as deviations from Keplerian orbitKeplerian velocities. Although these eclipse phases are not fitted by Doppler tomographyDoppler tomography codes, high quality eclipse data has the potential to reveal departures from Keplerian orbitKeplerian velocities and disentanglementdisentangle these two effects.
Eclipse mapping of this data in both the lines and continuum, reveals the presence of a two armed asymmetry in the outer regions of the disc, at the azimuths corresponding to the spiral armsspiral arms in the Doppler maps bhs00 (see also Baptista, this volume). The velocities of the spiral armsspirals as derived from the emission lines, can be compared with the position of the spiral armsspirals from the eclipse map. This indicates that velocities near the spiral armsspirals deviate considerably from the local Keplerian orbitKeplerian value. The two imaging methods thus nicely complement each other and both support a tidal interpretation of the spiralsspiral arms.
Apart from the data sets discussed here, Morales-Rueda et al. luisa , also recovered prominent spiral armsspiral waves in the disc of IP PegasiIP Peg during outburstoutburst in a range of emission lines. The disc structure during their observations, about 5 days after the start of the outburstoutburst, is very similar to the Doppler mapDoppler maps presented here, with a slightly stronger arm in the upper right quadrant. They also note the shifted emission line eclipses and shielding of the irradiationirradiated companion star by the geometrically thick discaccretion disc!thickness.
Doppler tomographyDoppler tomography of IP PegasiIP Peg during outburstoutburst thus invariably shows the presence of spiral armsspiral shaped disc asymmetries. The two armed spiralspiral arms dominates the accretion disc!emissiondisc emission from the start of the outburstoutburst maximum and persists for at least 8 days, corresponding to about 50 binary orbits. The spiral armsspirals are present in a range of emission lines from neutral hydrogen to ionisationionised helium, the latter indicating that the gas concerned has to be hot, although it is not clear if we are looking at direct emission from the shock, or recombination emission from the spiral armsspiral arms. The asymmetry between the two arms that was observed in the discovery data, is also present at other epochs and in other lines. The disc structure is co-rotating with the binary, and corresponds to the velocities were tidally driven spiral armsspiral arms are expected. A more detailed comparison between theory and observations is discussed by Boffin, this volume. We shall see that the observed properties of the spiral armsspirals fit recent hydro-dynamical simulations of such discs in detail ss99 .
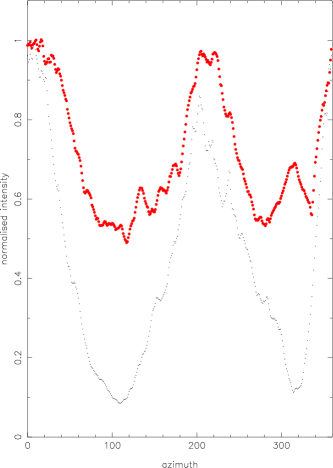
Although the accretion disc!emissiondisc emission of the different data sets is in general terms the same, differences between the various data sets should tell us something about the evolution of the spiral armsspiral across the outburstoutburst (and therefore their origin). In addition, comparing lines with different excitation potential allows us to investigate the physical conditions of the emitting gas directly. Unfortunately, the various data sets have been obtained with different telescopes and instruments, different resolutions, and different orbital phase coverage. Disentangling those systematic effects from true variations of the spiral armsspiral in various lines is therefore not straightforward. Ideally one would observe a range of emission lines simultaneously with the same instrumental setup, while covering a substantial part of the disc outburstoutburst to study its evolution. As a first step, we have obtained echelle spectroscopy of IP PegasiIP Peg during a recent outburstoutburst with the NTT (Steeghs & Boffin, in preparation). Covering a large part of the optical spectrum at high resolution, ensures that we will be able to compare the properties of the spiral armsspiral among a large set of emission lines, obtained under identical circumstances. Figure 8 compares the properties of the spiral armsspirals between just two lines covered, and indicates a very similar position for the spiral armsspirals in terms of velocity as a function of azimuth for the H and HeI6678Å lines. The intensity modulation, on the other hand is significantly different.
4 The quiescent disc
In stark contrast with the prominent spiral armsspiral waves observed during outburstoutburst, Doppler mapDoppler mapping of IP Pegasi during quiescent epochs does not reveal such features mh90 ; ksh94 ; hmd94 ; wolf98 . Although significant disc asymmetries are observed even during quiescencequiescence, it is clear that the open spiral armsspiral pattern the disc carries in outburstoutburst is not present. The disc radii of cataclysmic variable!dwarf novadwarf novae are expected to vary significantly across the outburstoutburst cycle. In the disc instability picture, a cataclysmic variable!dwarf novadwarf nova disc is in a cool state during quiescent phases, when most mass transferred from the mass donor is not accreted by the white dwarf. The disc density builds up until a radical opacity change due to the ionisationionisation of hydrogen flips the disc from a neutral, cool state to a hot, ionisationionized state. Angular momentum transport in this hot state is increased by a factor of 10 or so, which results in a rapid expansion of the disc at the onset of the outburstoutburst. During outburstoutburst, the disc is depleted as more mass is accreted than is transferred from the mass donor, until the density in the disc drops below the critical value again and the system returns to quiescencequiescence.
Disc radiusaccretion disc!radius variations are indeed observed in cataclysmic variable!dwarf novadwarf novae, and the disc in IP PegasiIP Peg fills between half of the primary Roche equipotentialRoche lobe during quiescence up to most of the Roche lobe during outburstoutburst wood86 ; wmh93 ; thesis . Tidally driven waves are thus much more likely to have an effect on the disc in outburstoutburst, since the tidal torques are a steep function of the distancedistance to the secondary starsecondary star. The fact that spiral armsspirals are not prominent in quiescencequiescence, is therefore what one expects if they are due to the tidal torques of the companion starsecondary star ss99 . The detailed properties of the spiral armsspirals depend upon disc temperature, radius and the mass ratiomass ratio of the binary. The most likely discs carrying prominent open-armed spiral armsspirals are thus cataclysmic variable!dwarf novadwarf novae in outburstoutburst and the cataclysmic variable!nova-likenova-like variables, where the disc is always in the hot, ionisationionised state. Dwarf novae are likely to display highly variable spiral armsspiral arm structures, depending on the state of the system, whereas cataclysmic variable!nova-likenova-like variables would provide a more persistent tidal pattern since large accretion disc!radiusdisc radius variations are relatively rare.
Marsh, this volume, has compiled an up to date overview of all the systems for which Doppler mapDoppler maps have been published. One would perhaps expect that such spiral armsspirals should have been found before if they are a common phenomenon. The number of Doppler maps of dwarf novae in outburstoutburst are very rare indeed. And even in quiescencequiescence, some well known systems have not yet been Doppler mapmapped using good quality data. Unfortunately, in the case of cataclysmic variable!nova-likenova-likes where one would have the potential of observing a persistent spiral armsspiral pattern, Doppler mapDoppler mapping has shown complicated emission geometries. In those systems, line emission is not dominated by a disc component, instead prominent spots dominate the Doppler maptomograms whose interpretation is unclear. However, IP PegasiIP Peg is no longer the only system with evidence for distortions of a spiral nature. The next section will discuss a small number of other systems which display very similar disc behaviour.
5 Disc asymmetries in other systems
5.1 EX Dra
The dwarf nova EX DraEX Dra was the second object to show similar disc behaviour. This is another eclipsing system above the period gapperiod gap and is in many ways very similar to IP Pegasi bill ; fiedler . Joergens et al. exdraspiral present Doppler images of EX DraEX Dra during outburstoutburst, and the similarity of the Doppler mapDoppler maps with those of IP Pegasi is obvious (Figure 9). Although perhaps not as convincing as in IP PegasiIP Peg in all the mapped lines, the disc carries a two armed asymmetry during outburstoutburst in the same quadrants of the Doppler mapDoppler map. The appealing characteristic of this object is its very short outburstoutburst recurrence time. Although its orbital period and mass ratio is very similar to IP Peg, EX Dra’s outburstoutbursts recur every 23 days, and catching such a system in outburstoutburst is thus more likely. It would be an ideal target for a longer campaign, with the prospect of securing the disc evolution across the whole outburstoutburst cycle, and performing time lapsed tomography in order to construct a movie of the accretion disc along its outburstoutburst cycle. A photometric campaign lasting over 6 weeks was conducted during the summer of 2000, just after this workshop. Although no Doppler tomographyDoppler tomography will be possible, two outburstoutburst cycles were covered, and eclipse mapeclipse mappingeclipse mapping methods will reveal the development of disc asymmetries and radial temperature variations.
5.2 U Gem
U GemU Gem is one of the brightest and best studied CVs, reaching a magnitude of V8.5 during outburstoutburst. Surprisingly, no outburstoutburst Doppler tomography of this system was available until very recently, Groot observed the system during the March 2000 outburstoutburst groot . Figure 10 shows the HeII Doppler maptomogram of U Gem in outburstoutburst, revealing a prominent two armed spiral armsspiral pattern. The spiral armsspirals are strong even towards the late phases of the outburstoutburst maximum, and weaken once decline sets in. This supports a tidal interpretation for these structures since the spiral armsspirals are there when the disc is hot and large, but weaken once the disc shrinks back towards quiescencequiescence like in IP Pegasi. The rise and decline phases of the outburstoutbursts are particularly useful for testing the tidal interpretation of spiral armsspiral waves. During those phases the spiral armsspiral arm geometry will change dramatically, and the exact nature of the evolution will tell us if indeed the spiral armsspirals behave as tidally driven spiral armsspirals would do, and how they affect the angular momentumangular momentum exchange in the accretion disc.
5.3 SS Cyg
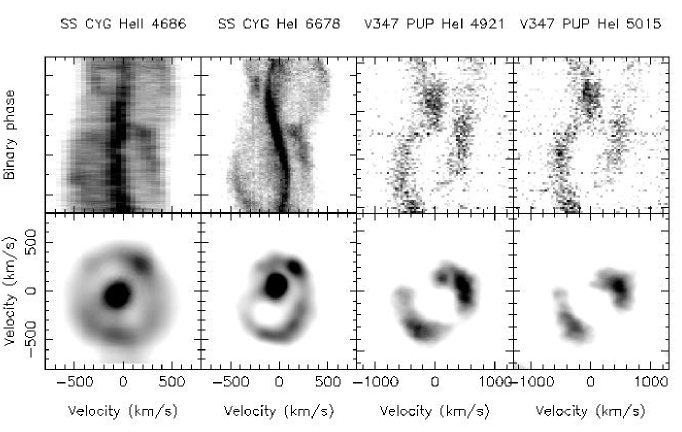
During outburstoutburst, SS CygniSS Cyg is the brightest CV in the sky, with an almost continuous light curve available for the last 100 years thanks to amateur astronomers. Its outburstoutburst history has been well studied and compared with disc instability predictions canizzo . Phase resolved spectroscopy reveals emission from the secondary starsecondary star as well as a distorted accretion disc, both in quiescencequiescence and outburstoutburst pais1 ; pais2 . Doppler tomographyDoppler tomography during outburstoutburst revealed enhanced emission from the disc in the top right and lower left quadrant of the Doppler maptomograms in the Balmer, HeI and HeII lines slingpaper . maximum entropyMEM maps of two emission lines are presented in Figure 11. Again, the disc has a two armed asymmetry, but on the other hand differs significantly from a simple two armed spiral armsspiral pattern. SS CygSS Cyg is an intermediate inclinationinclination system, and our line of sight thus penetrates deeper into the disc atmosphere, producing broad absorption wings from the optically thick disc during outburstoutburst. This may complicate the comparison between models of spiral armsspiral arms and the line emission from them because of more intricate, and poorly understood, radiative transfer conditions in the vertically stratified disc. However, these differences need an explanation and given the brightness of SS Cyg, justifies high resolution phase resolved spectroscopy of this system in quiescencequiescence and outburstoutburst.
5.4 V347 Pup
The accretion discs of cataclysmic variable!nova-likenova-likes are in many ways regarded as dwarf nova in permanent outburstoutburst, since the high mass transfer rate in the disc keeps the disc gas ionisationionized and stable against thermal disc instabilities. Unfortunately the properties of the emission lines of these systems remains a puzzle. The atlas of Doppler mapDoppler maps from ksh94 contains many cataclysmic variable!nova-likenova-like systems, for which evidence for an accretion disc is absent in most cases. One of the few cataclysmic variable!nova-likenova-likes that appears to reveal a clear signature of an accretion disc is the eclipsing cataclysmic variable!nova-likenova-like V347 PupV347 Pup still . Doppler mapDoppler mapping revealed the presence of an accretion disc, containing a two armed asymmetry. However, the properties of some of the emission lines at a different epoch several years later were quite different (Steeghs et al., in preparation). The Balmer lineBalmer lines were dominated by a spot of emission in the lower left side of the Doppler maptomogram rather than the disc, a typical feature of cataclysmic variable!nova-likenova-like variables. However, the HeI emission (Figure 11) appears to be originating from the disc only, and displays a two armed asymmetry like that was observed in the Balmer lineBalmer lines by Still et al. still The opportunities to investigate the tidal structures of a high mass transfer rate accretion disc are ideal in this eclipsing object, and follow up NTT data is under investigation.
5.5 A systematic picture?
Phase resolved spectroscopy of CVs in outburstoutburst, suitable for Doppler mapping of the accretion disc, is still limited to a small number of objects. It is very encouraging that on the occasions that such data are available and can be compared, very similar accretion disc distortions are seen. This suggests a common physical cause for these large scale asymmetries and tidally driven waves appear to offer the most likely explanation. It is interesting to note that all the cataclysmic variable!dwarf novadwarf novae that have indicated spiral-type distortions are long period systems above the period gapperiod gap. One does expect the structure of the spiral armsspiral arms to depend on the mass ratiomass ratio of the binary, with higher mass ratio binaries corresponding to a heavier secondary starsecondary star that induces stronger tidal torques. On the other hand selection effects work against us since the outburstoutburst of the short period systems are usually short, and suitable outburstoutburst spectroscopy of short period cataclysmic variable!dwarf novadwarf novae during outburstoutburst maximum is extremely rare. Tomography of OY CarOY Car in outburstoutburst oycar , reveals an extended arm on the side of the gas streamgas stream impact, but not a two armed spiral armsspiral pattern. Limited resolution and signal to noise in this case prevents a strong case for or against spiral armsspirals in SU UMa systems.
The important question is whether spiral armsspiral waves affect the structure of accretion discs under a wide range of conditions, or are merely a dynamical side effect of the expanding disc during cataclysmic variable!dwarf novadwarf novae outburstoutbursts. Clear progress requires a more balanced observational picture covering the observational parameter space in terms of orbital periods, mass ratiomass ratios, outburstoutburst behaviour, etc. This relies on our ability to obtain a considerable number of data sets of outburstoutbursting dwarf novae, in particular during the rise and decline phases. Flexible, or even robotic, scheduling of telescope time would be highly beneficial to such projects.
Doppler tomographyDoppler tomography has proven to be an invaluable tool for the discovery and study of spiral armsspiral waves in the discs of CVs. With better resolution and signal to noise data becoming available with large aperture telescopes, however, there is also room for improvements to the technique itself. In the next section I describe an extension to the Doppler tomographyDoppler tomography technique that aims to improve our ability to fit to data sets containing anisotropic emission sources, a rather common situation.
6 Modulation mapping
Doppler tomographyDoppler tomography provides a velocity resolved image of the accretion flow in the corotating frame of the binary. Since it relies on only a few basic assumptions, such images can be recovered in a model independent way. They then provide a perfect frame in which to compare data with models. One of those assumptions is that the flux from any point fixed in the rotating frame is constant (Marsh, this volume). However, observations show the presence of anisotropic emission sources, that modulate their emission as a function of the orbital phase. Some general examples are the irradiationirradiated front of the mass donor, the bright spothot spot, and the anisotropic radiationanisotropic emission from spiral armsspiral shocks. Doppler tomographyDoppler tomography can still be used in that case, since the Doppler mapDoppler map serves to present a time averaged image of the distribution of line emission. However, one will not be able to fit the data very well, and the phase dependent information contained in the observed line profiles is lost. The remainder of this review will present a straightforward extension to the Doppler tomographyDoppler tomography method that tries to remove the above mentioned assumption from tomography.
6.1 Extending Doppler tomographyDoppler tomography
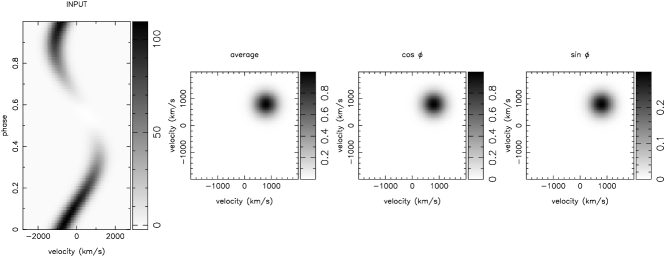
Rather than assuming that the flux from each point in the binary frame is constant, I include modulations of the flux on the orbital period. The line flux from each location (in terms of its position in the plane of the Doppler maptomogram) is not just characterised by the average line flux, but also the amplitude and phase of any modulation on the orbital period (Figure 12). We thus have two additional parameters to describe the line flux form a specific velocity vector. The flux from a modulated S-wave as a function of the orbital phase can be written as;
where is the average line flux for the s-waves-wave, and and the cosine and sine amplitudes (Figure 12). In other words, the amplitude of the modulation is , and its phase is . The velocity of the S-wave is defined in terms of the vector in the usual manner (Marsh, this volume);
With the systemic velocitysystemic velocity of the binary. In this prescription, we need three images describing the values of , and for each velocity instead of the conventional one describing . In other words the projection from Doppler mapDoppler map to trailed spectrogram is then;
with describing the local line profile at a Doppler shift of , which is assumed to be a Gaussian convolved with the instrumental resolution.
Keith Horne implemented a similar extension to the filteringfiltered back projectionback-projection code. However, cross talk among the three terms results in significant artifacts in the back-projected maps. I choose to implement the extension using a maximum entropyentropy optimiser in order to reconstruct artefactartefact free images. Since the entropyentropy is only defined for positive images, and the cosine and sine amplitudes can be either positive or negative, the problem was implemented using 5 images to characterise the data. One (positive) average image, and two (positive) images for both the cosine and sine amplitudes. For those two images one image reflects positive amplitudes, the other negative amplitudes. The image entropyentropy for each image is defined in the usual manner relative to a running default image, and the data is fitted to a requested while maximising the entropyentropy of the 5 images.
6.2 A test reconstruction
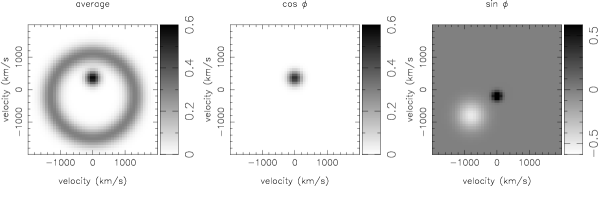
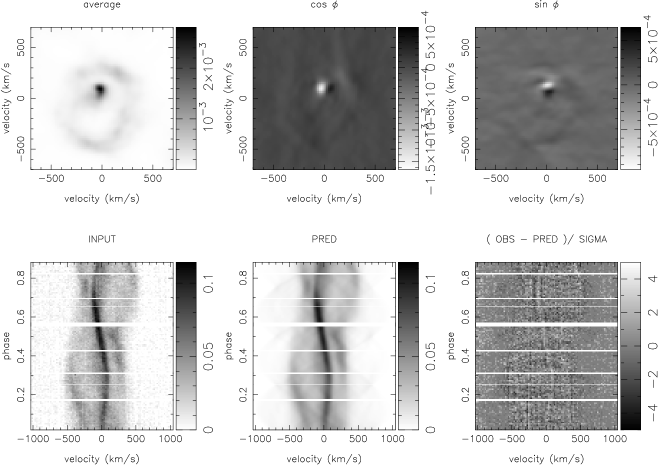
In order to test the method, and check for possible artefacts, fake data was generated and noise was added to that data to see how well the input images can be reconstructed by the code. In Figure 13, I show an example of an input data set consisting of a constant emission from a disc as well as various anisotropic contributions from 3 spots. The large modulation of the S-waves corresponding to the spots results in a trailed spectrogram that cannot be fit using the conventional Doppler tomographyDoppler tomography technique. However, using the above described extension, the modulation mapping code is able to fit the input data to a of 1, without introducing any spurious features in any of the images, or leaving systematic residuals to the fit. As expected, the higher the signal to noise of the input data, the more reliable and accurate the reconstruction is. Most importantly though, there is no cross-talk between the various images. A series of tests were performed to confirm that the problem is well constrained and that maximum entropyentropy ensures that no image structure is added unless the data dictates it. Two different types of default were used. For the average image, the default is set to a Gaussian blurred version of the average image after each iteration, while for the modulation images we have tried both Gaussian blurring as well as steering the images to zero. Both converge easily to the maximum entropyentropy solution. Of course this method suffers from the same limitations as Doppler tomographyDoppler tomography with regards to errors in the assumed systemic velocitysystemic velocity of the binary, limited image structure due to poor signal to noise, and artefactartefacts due to limited phase sampling.
6.3 Application to real data
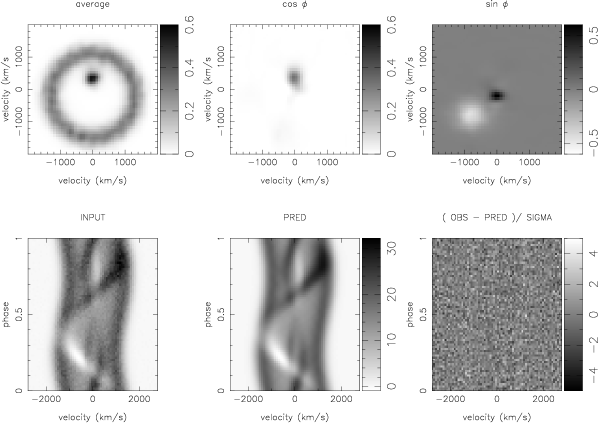
As an example of applying the method to real data, we use the previously discussed data of SS CygniSS Cyg during outburstoutburst (Figure 11). Figure 14 looks at the residuals between predicted and observed data when conventional maximum entropyMEM Doppler tomographyDoppler tomography was applied to the HeI emission line data. Although recovering the general features in the data, such as the S-wave from the irradiationirradiated secondary and the two armed disc asymmetry, residuals are significant and the best that can be achieved is 3.2. In particular the anisotropic radiationanisotropic emission from the secondary star and parts of the disc leave large residuals due to their phase dependence. Doppler tomography tries to reproduce this phase dependence as best as it can, but is fundamentally unable to describe such emission sources adequately.
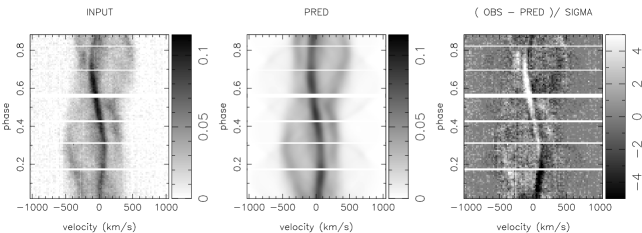
If the same data is passed to the modulation mapping code, a much better fit to the data can be obtained (Figure 15). The value of the fit is 1, as good as one may expect, and leaves much reduced residuals between data and fit. The structure of the average image is very similar to that obtained with the conventional method, indicating that the majority of the emission is relatively unmodulated. In the two modulated images, one can identify in particular the emission from the secondary and some areas of the disc. However, the two images tell us not only where the modulated emission is coming from, but also the phase of the modulation. The secondary starsecondary star emission shows a left-right asymmetry in the cosine image, and a front-back asymmetry in the sine image, indicating that the emission is indeed beamed away from the Roche equipotentialRoche lobe surface. Although one ideally applies Roche tomography in order to model the contribution of the secondary, modulation mapping ensures that strong anisotropic S-waves originating from the mass donor are fitted well, and that they do not leave artefactartefacts or limit the goodness of fit that can be achieved.
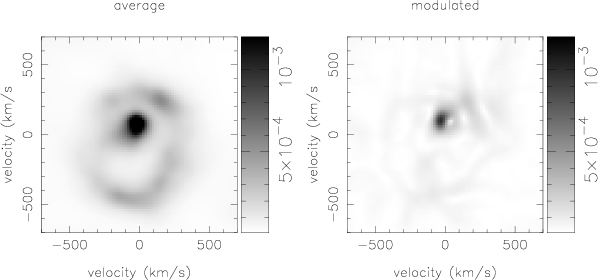
Obvious other emission sources where the phasing and beaming of the emission can be quantified with this method are the emission from the bright spotbright spot, and emission from anisotropic spiral armsspiral shocks. In SS Cygni, the emission from the disc seems to be only weakly modulated (Figure 16), which may not be too surprising because of its low orbital inclinationinclination . Shear broadening, for example, leads to anisotropic emission and is and proportional to . Its effect is thus considerably reduced for inclinationinclinations below 60∘ ss99 . Work is in progress to apply this method to the emission of the spiral armsspirals in IP Peg and other objects in order to quantify the anisotropy of the emission from the spiral armsspiral shocks.
Modulation mapping provides a straightforward extension to Doppler tomography, with a wide range of applications. The code as such does not need to make any assumptions about the nature of the modulations, except that the period of modulation is the orbital period. It thus relaxes one of the fundamental assumption of Doppler tomographyDoppler tomography, in order to make the technique more versatile. Many data sets already exist that could benefit from this extension, but it will be of particular use for the high resolution data sets that will be obtained with the new large aperture telescopes. An even more general prescription can easily be envisaged that attempts to model modulations on other periods as well.
7 Conclusions
Doppler tomographyDoppler tomography of the cataclysmic variable!dwarf novadwarf nova IP PegIP Peg has revealed a remarkable two armed spiral armsspiral structure in its accretion disc that dominates the emission from a range of emission lines over a large range of radii. The pattern is observed from the start of the outburstoutburst up to the later stages of the outburstoutburst maximum, and is fixed in the binary frame. Its location in the Doppler maptomograms fits remarkably well with the two armed spiral armsspiral shocks that are expected to be generated by the tidal torques of the companion star. A tidal origin is also supported by the fact that the structure is corotating with the binary for at least 50 orbital periods, and the fact that the asymmetry is not visible during quiescencequiescence, when tidal torques on the much smaller accretion disc are significantly reduced.
In order to appreciate the relevance of tidally driven spiral waves for the structure of accretion discs in general, a more varied observational picture is required, spanning a range of objects and source states. Since the detection of spiral armsspirals in IP PegasiIP Peg, a handful of other systems have displayed very similar disc structures, but a systematic picture is still difficult to extract. A second important restriction of the current data sets, is the limited coverage we have of each outburstoutburst. In the CV sub-class of cataclysmic variable!dwarf novadwarf novae we have a truly unique opportunity to track the evolution of the disc in real-time through time-lapsed tomography. What is needed is a focused campaign that aims to obtain spectroscopy across a significant fraction of the outburstoutburst cycle. Such a data set would be an extremely valuable test bed for both disc instability models as well as the question of angular momentum transport associated with density waves. Although the observed spiral armsspirals appear to fit to detailed simulation in surprising detail, it is still not clear what the impact of such prominent spiral armsspiral arms is on the angular momentumangular momentum budget of the disc and how it relates to the local shear viscosityviscosity. This requires improved observations and realistic simulations in order to test quantitatively the impact of such waves (Boffin, this volume).
I also discussed an extension to Doppler tomographyDoppler tomography, with the aim of mapping modulated emission sources in emission line data. This is a rather common situation and will not only benefit the observational study of spiral armsspiral waves, but a range of other emission sources commonly observed. I demonstrated that artefactartefact free reconstructions can be calculated from phase resolved spectroscopy using maximum entropyentropy regularisation.
References
- (1) Balbus S. A., Hawley J. F., 1991, ApJ, 376, 214
- (2) Baptista R., Harlaftis E. T., Steeghs D., 2000, MNRAS, 314, 727
- (3) Billington I., Marsh T.R., Dhillon V.S., 1996, MNRAS, 278, 673
- (4) Binney J., Tremaine S., 1987, Galactic Dynamics. Princeton Series in Astrophysics, Princeton University Press
- (5) Cannizzo, J. K., Mattei, J. A., 1998, ApJ, 505, 344
- (6) Fiedler H., Barwig H., Mantel K. H., 1997, A&A, 327, 173
- (7) Frank J., King A., Raine D., 1985, Accretion Power in Astrophysics, Cambridge Astrophysics Series, Cambridge University Press
- (8) Groot P., 2000, ApJL, submitted
- (9) Harlaftis, E.T, Marsh, T., 1996, A&A, 308, 97
- (10) Harlaftis E. T., Marsh T. R., Dhillon V. S., Charles P. A., 1994, MNRAS, 267, 473
- (11) Harlaftis E. T., Steeghs D., Horne K., Martin E., T. M., 1999, MNRAS
- (12) Joergens V., Spruit H. C., Rutten R. G. M., 2000, A&A, 356, 33
- (13) Kaitchuck R. H., Schlegel E. M., Honeycutt R. K., Horne K., Marsh T. R., White J. C. I., Mansperger C. S., 1994, ApJS, 93, 519
- (14) Livio M., 1994, in ”Interacting Binaries”, Saas-Fee Advanced Course 22. Lecture Notes 1992. Swiss Society for Astrophysics and Astronomy, XVI, Springer-Verlag Berlin Heidelberg New York
- (15) Marsh T. R., Horne K., 1990, ApJ, 349, 593
- (16) Martinez-Pais I. G., Giovannelli F., Rossi C., Gaudenzi S., 1994, A&A, 291, 455
- (17) Martinez-Pais I. G., Giovannelli F., Rossi C., Gaudenzi S., 1996, A&A, 308, 833
- (18) Morales-Rueda L., Marsh T., Billington I., 1999, MNRAS,
- (19) Pringle J. E., 1981, ARA&A, 19, 137
- (20) Savonije G.J., Papaloizou J.C.B., Lin D.N.C., 1994, MNRAS, 268, 13
- (21) Sawada K., Matsuda T., Hachisu I., 1986, MNRAS, 219, 75
- (22) Shakura N. I., Sunyaev R. A., 1973, A&A, 24, 337
- (23) Spruit H. C., Matsuda T., Inoue M., Sawada K., 1987, MNRAS, 229, 517
- (24) Spruit H. C., 1987, A&A, 184, 173
- (25) Steeghs D., 1999, PhD thesis, University of St.Andrews (available at http://www.astro.soton.ac.uk/ds/thesis.html).
- (26) Steeghs D., Stehle R., 1999, MNRAS, 307, 99
- (27) Steeghs D., Harlaftis E. T., Horne K., 1997, MNRAS, 290, L28
- (28) Steeghs D., Harlaftis E. T., Horne K., 1998, MNRAS, 296, 463
- (29) Steeghs D., Horne K., Marsh T. R., Donati J. F., 1996, MNRAS, 281, 626
- (30) Still M. D., Buckley D. A. H., Garlick M. A., 1998, MNRAS, 299, 545
- (31) Toomre A., 1969, ApJ, 158, 899
- (32) Wolf S., Mantel K. H., Horne K., Barwig H., Schoembs R., Baernbantner O., 1993, A&A, 273, 160
- (33) Wolf S., Barwig H., Bobinger A., Mantel K.-H., Simic D., 1998, A&A, 332, 984
- (34) Wood J., Horne K., Berriman G., Wade R., O’Donoghue D., Warner B., 1986, MNRAS, 219, 629