The X-ray emission of 3C 346 and its environment
Abstract
We present a detailed spectral and spatial analysis of the X-ray properties of the compact and unusual radio galaxy 3C 346, combining information from ROSAT and ASCA. The dominant component of X-ray emission ( ergs s-1 in each of the 0.5-3 keV and 2-10 keV bands) is unresolved and not heavily absorbed (intrinsic N cm-2), with evidence for variability of % over 18 months. We relate the X-ray emission to radio structures on both milliarcsecond scales and the arcsecond scales which Chandra can resolve. The absence of X-ray absorption, and the radio/optical/X-ray colors, when combined with previous radio evidence that the source is a foreshortened FRII, suggest that the radio jets are seen at an angle to the line of sight of about 30∘, intermediate between the radio-galaxy and quasar classes. Roughly a third of the soft X-ray emission is from a cluster atmosphere, for which we measure a temperature of keV, making this the second low-redshift () powerful radio galaxy, after Cygnus A, with a measured cluster temperature. At a jet angle of , all the radio structures lie within the core radius of the cluster, for which the cooling time is sufficiently long that there is no reason to expect the presence of a cooling flow. The radio lobes of 3C 346 are roughly in pressure balance with the external medium under the assumptions that the energy densities in the magnetic field and radiating particles balance and that a source of excess pressure in the radio lobes, commonly invoked in other radio galaxies, is absent here.
1 Introduction
3C 346 is a well-known compact radio source in a 17th magnitude galaxy at (e.g. Laing et al., 1983). Although originally classified as a member of the physically small class of Compact Steep Spectrum (CSS) radio sources (Fanti et al., 1985), Spencer et al. (1991) argue that its luminous core and small, one-sided (eastwards), distorted jet structure are best explained by the foreshortening of a normal radio galaxy by a combination of relativistic beaming and small angle to the line of sight. The radio morphology then suggests it would be a member of the FRII class, as defined by Fanaroff & Riley (1974), and this is consistent with its 178 MHz power of W Hz-1 sr-1, about a factor of five higher than the fuzzy boundary between sources exhibiting FRI structure and those classed as FRIIs. Subsequent authors have generally supported the foreshortened FRII picture, and in particular Cotton et al. (1995) use the VLBI radio-core dominance and jet-to-counterjet ratio to infer an angle to the line of sight of , and a speed relative to that of light of . Unified Models (e.g. Barthel, 1989) class FRII radio sources with their jets this close to the line of sight as quasars in contrast to radio galaxies, and so the absence of an expected strong broad emission-line region (BELR) needs explanation. Dey & van Breugel (1994) combine their upper limit for the flux of H with the emission-line flux of H + [N II] from narrow-band imaging data of Baum et al. (1988) to suggest that the nuclear regions are seen through a large extinction ( mag), such that the BELR may only be detectable in the infrared. However, such a large extinction would then be unusual for a source of 3C 346’s presumed orientation.
At high radio frequencies (15 GHz), 3C 346’s one sided wiggly jet breaks into a series of bright knots which van Breugel et al. (1992) label as B, C, D, and E with increasing distance from the core. The brightest knot, C, at east of the radio core may reside outside the optical galaxy if the jet is indeed at a small angle to the line of site. Dey & van Breugel (1994) detected excess emission in ground-based and red images which they attributed to knot C and its nearby companion, knot B. More recently an HST snapshot image with the WFPC2 has provided a spectacular view of the jet at optical wavelengths (F702W filter: Å), with a one-to-one correspondence between optical and radio features in the jet, including knots B, C, and D (de Koff et al., 1996; de Vries et al., 1997).
3C 346 was detected in the X-ray with the Einstein IPC, yielding counts in 2.9 ks, and giving a 0.5-3 keV luminosity of ergs s-1 to within an estimated uncertainty (Fabbiano et al., 1984). Subsequent longer observations were made with the ROSAT PSPC, which permitted Hardcastle & Worrall (1999) to show that the X-ray emission is a composite of resolved and unresolved components, and with ASCA, from which Sambruna et al. (1999) derived a power-law spectral index for the overall X-ray emission as part of a statistical study of the X-ray emission from a number of radio-loud active galaxies. In this paper we present a detailed analysis of the X-ray properties, combining information from ROSAT and ASCA (§2). We discuss the pressure and cooling time of the cluster gas which gives rise to the extended X-ray emission (§3), and we discuss the likely origin of the unresolved X-ray emission in the context of what is known from radio and optical measurements (§4). Our conclusions are in §5.
Throughout the paper we adopt a Friedmann cosmological model with = 50 km s-1 Mpc-1, = 0. At the redshift of 3C 346, 10 arcsec corresponds to 37.5 kpc.
2 X-ray Analysis and Results
Dates and exposure times for the ROSAT and ASCA X-ray observations are given in Table 1. Our analysis made use of the IRAF/Post Reduction Off-line Software (PROS) for ROSAT and FTOOLS and XSPEC for ASCA. The ASCA data are from the two Gas Imaging Spectrometers (GIS) and the two Solid-State Spectrometers (SIS). The SIS data were taken in a mixture of 2-CCD faint and bright mode; the faint-mode data were converted to bright mode by the standard processing software before analysis. Our screening used standard recommended procedures, and values adopted included an elevation angle degrees for dark earth (and 12 degrees for bright earth with the SIS), and a cut-off rigidity of 6 GeV/c for the SIS and 4 GeV/c, with extra screening, for the GIS. Four 8-sec intervals of anomalously high background counts in the SIS1 were excluded from the data. Our spatial analysis of the ROSAT data used generalized software (Birkinshaw, 1994; Worrall & Birkinshaw, 1994) for fitting radial profiles to combinations of models convolved with the instrument Point Response Function (PRF).
2.1 ROSAT Spatial and Spectral Results
The ROSAT PSPC image centered on 3C 346 is shown as a contour plot in in Figure 1. A re-registration of the X-ray image by 5 arcsec (within ROSAT’s absolute positional accuracy) aligns the centroid of the X-ray emission with the radio core of 3C 346, and the X-ray source 3.34 arcmin to 3C 346’s northeast with a star of late-type color index listed in the USNO catalog (R=12.8 mag, B=15.2 mag). The northeast source, at an X-ray flux of ergs cm-2 s-1 (0.2 - 2 keV), has an X-ray-to-optical flux ratio consistent with the range measured for late-type stars in the EMSS survey (e.g. Sciortino et al., 1995), and, although there are insufficient counts to constrain well the X-ray spectrum, it can be fitted with gas components of temperature and K, consistent with findings for late-type stellar coronae (Preibisch, 1997).
Figure 2 shows the X-ray radial profile that we extracted for 3C 346, excluding a circle of radius around the source to the northeast. The boundaries of the 23 bins were selected so as to give at least 20 counts per bin, and only counts in the energy band 0.2-1.9 keV, where the PRF is well modelled, were used. Background was measured from an annulus of radii 3 and 5.7 arcmin, again excluding the nearby source. A fit of this radial profile to the PRF gives an unacceptable of 208, indicating the presence of extended X-ray emission, whereas the X-ray source to the northeast is consistent with being point-like. A single-component -model111Counts per unit area per unit time at radius proportional to ., a description of gas in hydrostatic equilibrium (e.g. Sarazin, 1986), also gives a poor fit to the emission centered on 3C 346, with for and an unacceptably small core radius of arcsec. The composite of a point source and -model gives acceptable fits which are relatively insensitive to the value of , which is itself highly correlated with core radius, (Fig. 2). In Hardcastle & Worrall (1999) we present results for one set of acceptable parameters. Here we extend that work by exploring the uncertainties in physical parameters resulting from the full range in spatial and spectral model parameters.
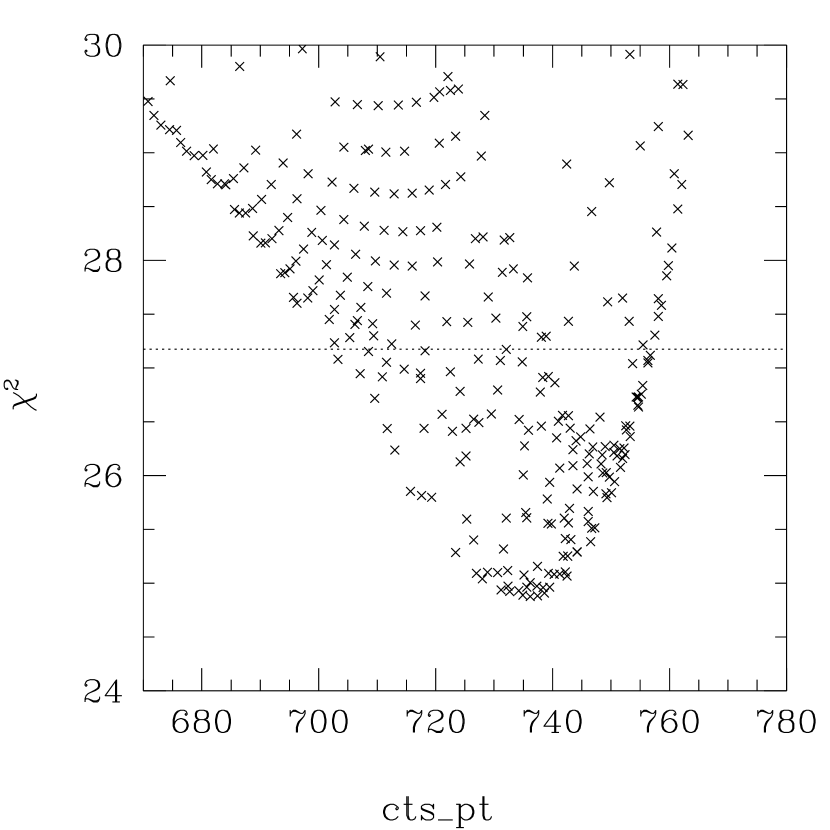
Figure 3 shows as a function of counts in the unresolved component and in the model (out to a radius of ), where each cross shows the minimum value of for a given trial combination of and , where the model normalizations are free parameters of the fit. Fits are performed over a broader range of and than shown in the left-hand plot of Figure 3, such that all combinations of parameters giving a particular value of (less than ) are adequately sampled. The model being fitted to the data has four parameters (point-source normalization, beta-model normalization, , and ), and in principle could be written in such a way as to make any quantity which is dependent on one or more of these four parameters to be itself a parameter of the model. In practice, the trade-off between computing time and programming time makes it more efficient to use the brute-force method of computing for many parameter-value combinations and plotting as a function of the quantity of interest, as shown in Figures 3 and 4.
The counts in the point-source model are highly correlated with the counts in the model and so, since we are interested in comparing the division of counts between the two components found in this spatial analysis with spectroscopic results, our errors are given by ( for two interesting parameters). Our spatial fitting thus finds ROSAT PSPC counts (0.2-1.9 keV) in the unresolved component, and in resolved emission out to a radius of (including the correction for missing counts from the region of the nearby source to the northeast). The resolved emission is well concentrated within a radius of , as indicated by the shape of the radial profile and the preference for values of close to unity (Fig. 2); extending the radius to increases the counts in the model only by 5.6%.
Spectral fits to the ROSAT PSPC data (over the same spatial on-source and background regions as used in our spatial analysis, but over a broader energy range) give acceptable fits to either a power law of energy index 0.75 ( for 23 degrees of freedom) or a Raymond-Smith thermal model with 30% solar abundances and keV (). In neither case is excess absorption over the column density through the Galaxy required, with upper limits of cm-2 and cm-2 for the power-law and thermal models, respectively. Interestingly, while a combination of power-law and thermal spectral components does not decrease sufficiently to argue, using an F-test, that two components are required based on the spectral analysis alone, the two-component fit settles on parameters which give roughly the same division of counts between the power-law and thermal components as did the spatial analysis between the unresolved and resolved components, respectively.
The extended X-ray emission is undoubtedly dominated by thermal radiation from hot gas. 3C 346’s radio lobes lie within of the core, and so any upscattering of photons by the relativistic plasma occurs well within the PSPC’s PRF (see profile in Fig. 2), and cannot account for the resolved component. The fact that the extended emission is well fitted by a -model, and the post-facto result that the luminosity and temperature of this component fall in the range measured for the atmospheres of other radio galaxies, further support a thermal origin for these X-rays.
We model the unresolved emission with a power-law spectrum, on the assumption that any contributions to this component from discrete sources and galaxy-scale gas are negligible. That this is overwhelmingly likely is clear because the soft X-ray luminosity of the unresolved emission is ten times higher than that of any elliptical galaxy in the compilation of Fabbiano et al. (1992), and a thousand times higher than for typical elliptical galaxies. Furthermore, if we assume only 30% of the unresolved emission is thermal, and model it as a sphere of radius , half the FWHM of the PSPC PRF, we find that the emitting gas would have a cooling time much less than the Hubble time, and a mass deposition rate of /yr. Such a cluster-scale mass deposition in what would be a galaxy-scale cooling flow is unreasonable.
Since the extracted spectrum should contain all the counts from the unresolved component, we performed two-component spectral fits with the constraint that the power-law component provide between 702 and 757 counts between 0.2 and 1.9 keV. For these fits, the hydrogen column density was fixed at the Galactic value (since single-component fits required no excess absorption), and abundances were fixed at 30%, the typical value for cluster gas (Arnaud et al., 1992). The fits constrained the temperature of the gas to be keV and the power-law energy index, , () to be (other temperature and slope combinations being inconsistent with the required counts in the power-law model). The statistical uncertainty in the division of counts between the two components dominates the errors in the spectral model parameters. For example, allowing the abundance percentage to vary by a factor of three from the adopted value (i.e. allowing it to cover a range from 10% to 90%) increases the lower and upper uncertainties in temperature by at most 20% and 40%, respectively. Tables 2 and 3 summarize the results for the cluster gas and unresolved (power-law) emission (which we attribute to the active galaxy). The tables include the luminosities in various spectral bands, where the uncertainties are dominated by the errors in counts represented in Figure 3.
Now that we have measured a gas temperature, we return to the spatial fits to compute other parameters of interest (Table 2) such as the central pressure and density, and their equivalents at a radius of , roughly the projected outer radius of the radio lobes, which appear as an elliptical halo around the resolved jet features (van Breugel et al., 1992). Figure 4 is a similar plot to Figure 3, but for central gas pressure, assuming a temperature of keV. For between 1.2 and 3.2 keV, the PSPC count-rate per unit emission measure is independent of temperature, to within the statistical uncertainties. This means that our density measurements are unaffected by the temperature uncertainty, whereas the pressure and cooling-time errors given in Table 2 have been increased to include a contribution from the temperature range, since pressure is and cooling time is approximately .
2.2 ASCA Spectral Results using ROSAT Spatial Analysis
ROSAT has found that the soft X-ray emission from 3C 346 divides roughly as two-thirds point-like and one-third extended emission concentrated within a radius of . Visual inspection of the ASCA images showed no evidence for resolved X-ray emission, consistent with ASCA’s larger PRF as compared with ROSAT. For the results presented here, we extracted spectra from circular regions centered on the source position, using a radius of for the SIS, and the larger value of for the GIS to accommodate this detector’s contribution to the PRF. Background was measured from off-source regions on the images. Although the location of the X-ray emitting star to the northeast of 3C 346 (Fig. 1) falls within our on-source regions, the X-ray emission is weak and soft compared with that from 3C 346, and contamination in ASCA’s somewhat harder spectral band is negligible. Spectra were rebinned to a minimum of 20 counts per bin before we performed fitting of the SIS and GIS data jointly to various models. We followed the recommended procedure of excluding energies below 0.6 keV (0.4 keV for the SIS) and above 10 keV, where the detector spectral responses are uncertain.
As is the case for ROSAT, the data give an acceptable fit to a single-component power law with no excess absorption over the line-of-sight column density through our galaxy ( = 159 for 154 degrees of freedom). Uncertainty contours for power-law photon index ( + 1) and normalization are shown in Figure 5. Our spectral-index measurement of (), upon which the GIS and SIS separately agree well, is a little steeper than that found independently by Sambruna et al. (1999) from the same observation (), but results agree within the uncertainties. Excess intrinsic absorption is less well constrained than with ROSAT, and the 3 upper limit on line of sight hydrogen column density is cm-2.
Although we know from the spatial analysis of the ROSAT data that a single component power law is an inadequate description of the X-ray emission from 3C 346, is is instructive to compare the ROSAT and ASCA results for this spectral model. Figure 5 provides the first indication that the X-ray emission may have varied between the ROSAT and ASCA observations.
The statistical errors on the ASCA data are too large to constrain well the parameters for a two-component, power law and thermal, fit. We have therefore fixed the thermal component to be within the temperature and normalization bounds determined using the ROSAT data. Figure 6 compares the ASCA-derived uncertainties in power-law normalization and photon spectral index with the range found from ROSAT. There is no line of fixed normalization in Figure 6 which goes through both the ROSAT and ASCA error regions, even for different photon spectral indices – a case which would have been interpreted as a change in spectral slope between the ROSAT and ASCA energy bands. Instead, we conclude that the power-law component has decreased by % between the ROSAT and ASCA measurements.
The only other X-ray measurement of which we are aware is that with the Einstein Observatory reported by Fabbiano et al. (1984). Our estimates of the total 0.5-3 keV luminosity from ROSAT and ASCA (Tables 2 and 3) of ergs s-1 and ergs s-1, respectively, are both consistent with the Einstein luminosity of ergs s-1.
3 The Cluster Gas
Table 2 summarizes the properties of the X-ray emitting gas. 3C 346 is the second low-redshift () powerful radio galaxy, after Cygnus A (3C 405), with a measured cluster temperature. Indeed, the X-ray atmospheres around most powerful radio galaxies at low redshift are currently undetected, although for ROSAT-observed sources there is some evidence that gas may well be present at levels close to the X-ray upper limits (Hardcastle & Worrall, 2000b). The cluster around Cygnus A is considerably hotter and richer than that around 3C 346, whose atmosphere is more similar to that around a typical low-power (FRI) radio galaxy (Fig. 7). The cooling time of 3C 346’s cluster atmosphere (Table 2) is sufficiently long that there is no reason to invoke the presence of a cooling flow. Optical evidence for cluster membership is presented by Zirbel (1997), who classifies the cluster as Bautz-Morgan class I, with a richness of .
The southwest radio lobe, modelled as lying at an angular distance between and from the core, is estimated to have a minimum pressure in magnetic field and radiating particles of dynes cm-2 (Hardcastle & Worrall, 2000b). The closeness of this value to the gas pressure (Table 2) may suggest a finely tuned pressure-confined source. This makes 3C 346 different from most other X-ray detected FRII (Hardcastle & Worrall, 2000b) and FRI radio galaxies (e.g. Worrall & Birkinshaw, 2000), which need an additional source of internal pressure in order to balance the external gas pressure.
4 The Unresolved X-ray Emission
Unresolved emission dominates the X-radiation at both ROSAT and ASCA energies. The measurements are summarized in Table 3. The fact that the unresolved emission is not heavily absorbed (with an upper limit of cm-2) means either that it is nonthermal and related to the radio structures on VLBI to arcsec scales, or that the central AGN regions are not hidden by obscuration. The low absorption and X-ray variability support conclusions based on VLBI data (Cotton et al., 1995) that the source is a foreshortened FRII, and so it should be more closely related to the quasar than radio-galaxy class.
The absence of broad H is then unusual. Explaining this by an extinction of mag (Dey & van Breugel, 1994), and adopting the gas to dust ratio applicable to our own galaxy, implies that the broad-line regions, and so too presumably the AGN, lie beyond gas which provides a line of sight Hydrogen column density of cm-2 (Burstein & Heiles, 1978). We have placed an upper limit on an X-ray component this heavily obscured by fitting the ASCA data to thermal emission (fixed as before) together with two power-law components, one of which is absorbed by cm-2 and one of which suffers no intrinsic absorption in the source. These fits were run for two adopted spectral indices for the absorbed power law: and (photon index of 1.7 and 2.0). In neither case were the fitted spectral indices and normalizations for the unabsorbed emission much changed from Figure 6, although the uncertainties in spectral index increased as expected, particularly to allow steeper slopes. Although on the basis of an F-test there is no justification for including the extra (absorbed) component, the 90% upper limits on its intensity are quite high: in units of photons cm-2 s-1 keV-1 at 1 keV, the normalizations are and for slopes of and 1.0, respectively. These values correspond to an upper limit on the pre-absorption 2-10 keV X-ray luminosity of ergs s-1, or about 50% as luminous as the detected X-rays. More sensitive high-energy X-ray measurements are required to investigate whether such an absorbed central X-ray component is present in 3C 346.
It seems reasonable that the unabsorbed unresolved X-ray emission comes primarily from the inner regions of the radio jet, within an arcsec of the core (Worrall, 1997). Indeed, the ratio of 3C 346’s radio-core and unresolved-X-ray flux densities are in agreement with those for other 3CRR radio galaxies and quasars, from which we have made a statistical argument that each source has a beamed nuclear soft X-ray component directly related to the radio core (Hardcastle & Worrall, 1999). In common with other 3CRR radio galaxies and quasars, the core radio spectrum is flat, with VLA flux densities of 220 mJy at 5 GHz and 243 mJy at 15 GHz, and a 5 GHz VLBI measurement of 165 mJy (van Breugel et al., 1992; Giovannini et al., 1990). An optical core component of Jy at 7000 Å has been separated from the galaxy in HST data by Chiaberge et al. (1999). Combined with our X-ray measurements, these results imply interpolated two-point spectral indices of , , and , and place 3C 346 within the color range of low-power FRI radio galaxies (Hardcastle & Worrall, 2000a). Radio-loud quasars from 3CRR typically have steeper values of , in the range 1.0 to 1.6 (Wilkes et al., 1994). The spectral energy distribution therefore argues that the viewing angle to 3C 346 is not too much smaller than , placing it on the boundary between a radio galaxy and quasar.
It is likely that a significant fraction of the X-ray emission which is unresolved to ROSAT and ASCA actually comes from the radio and optical knots, and in particular the brightest of these, knot C, from the core. The radio spectral index in the knot between 1.6 and 15 GHz (Spencer et al., 1991; Dey & van Breugel, 1994; van Breugel et al., 1992) is roughly , consistent with synchrotron emission from an electron population which is energized by first-order Fermi acceleration at strong shocks. The optical flux-density (de Vries et al., 1997) is below an extrapolation from 15 GHz, implying an energy-loss break in the electron spectrum. Modelling the knot as a sphere of radius 165 pc, based on the 15 GHz measurements (van Breugel et al., 1992), we find a good fit to the radio and optical data for an equipartition magnetic field of Gauss and an electron spectral index which breaks by unity at eV. If, as is likely, the electron spectrum extends to eV, we expect significant X-ray synchrotron emission from the knot, amounting to roughly 10% of the total unresolved emission. This should be easily detectable with Chandra, which has the spatial resolution to separate the core and jet. Chandra observations will also make a strong test of the equipartition assumption which has been brought into question by the results for the jet in quasar PKS 0637-752 (Chartas et al., 2000; Schwartz et al., 2000). If the X-ray emission in 3C 346’s knot is above the synchrotron prediction, then we will be forced to infer a Compton-scattering origin, either from the synchrotron self-Compton process - which is most effective if the source is out of equipartition in the sense of weak magnetic field strength – or from Compton scattering of external photons. If this is the case, then an even higher fraction of the unresolved X-rays might originate in the jet.
5 Conclusions
ROSAT and ASCA measurements of the nearby powerful radio source 3C 346 find extended emission, consistent with a cluster atmosphere, and unabsorbed unresolved emission, consistent with non-thermal radiation from radio structures on VLBI to arcsecond scale sizes. We measure a temperature of keV for the extended emission, making this the second low-redshift () powerful radio galaxy, after Cygnus A, with a measured cluster temperature. The temperature and luminosity of the cluster gas are consistent with the correlation found for the atmospheres around nearby, less powerful, radio galaxies (Fig. 7). The cooling time for the cluster gas is too long for a significant cooling flow to have become established. The radio lobes of 3C 346 are roughly in pressure balance with the external medium under the assumptions that the energy densities in the magnetic field and radiating particles balance, and that a source of excess pressure in the radio lobes, commonly invoked in other radio galaxies, is absent here.
3C 346’s orientation to the line of sight is uncertain. It was originally classified as being an intrinsically small member of the CSS class, but radio measurements have since been used to infer a jet-angle to the line of sight of . The evidence that the unresolved X-ray flux is not only unabsorbed but has varied by % over 18 months makes it likely that a significant fraction of this emission is from deep in the radio jets, in sub-arcsec regions and influenced by relativistic beaming, which would support a small angle to the line of sight. However, the radio/optical/X-ray colors are not those of a quasar, rather they are similar to those of other nearby radio galaxies, and so we support the idea that this source is at an orientation intermediate between quasars and radio galaxies.
3C 346 is one of a relatively small number of radio galaxies where optical emission has been detected from the radio jet. We predict that the brightest knot in the jet is detectable with Chandra, and observations will test the equipartition assumptions which have been challenged recently by the Chandra observations of PKS 0637-752. Chandra observations are also required to probe the possible presence of an additional heavily absorbed X-ray emission component of ergs s-1 (2-10 keV), where the absorption is due to the gas suggested to be obscuring the broad-line emission regions in this source.
References
- Arnaud & Evrard (1999) Arnaud, M. & Evrard, A.E. 1999, MNRAS, 305, 631
- Arnaud et al. (1992) Arnaud, M., Rothenflug, R., Boulade, O., Vigroux, L. & Vangioni-Flam, E. 1992, A&A, 254, 49
- Barthel (1989) Barthel, P.D. 1989, ApJ, 336, 606
- Baum et al. (1988) Baum, S.A., Heckman, T.M. & van Breugel, W.J.M. 1988, ApJS, 68, 643
- Birkinshaw (1994) Birkinshaw, M. 1994, in Astronomical Data Analysis Software and Systems III, ASP Conference Series Volume 61, eds. D.R. Crabtree, R.J. Hanisch & J. Barnes, 249.
- Burstein & Heiles (1978) Burstein, D. & Heiles, C. 1978, ApJ, 225, 40
- Chartas et al. (2000) Chartas, G. et al. 2000, ApJ, 542, 655
- Chiaberge et al. (1999) Chiaberge, M., Capetti, A. & Celotti, A. 1999, A&A, 349, 77
- Cotton et al. (1995) Cotton, W.D., Feretti, L., Giovannini, G., Venturi, T., Lara, L., Marcaide, J. & Wehrle, A.E. 1995, ApJ, 452, 605
- de Koff et al. (1996) de Koff, S, Baum, S.A., Sparks, W.B., Biretta, J., Golombek, D., Macchetto, F., McCarthy, P. & Miley, G.K. 1996, ApJS, 107, 621
- de Vries et al. (1997) de Vries, W.H., O’Dea, C.P., Baum, S.A., Sparks, W.B., Biretta, J., de Koff, S., Golombek, D., Lehnert, M.D., Macchetto, F., McCarthy, P. & Miley, G.K. 1997, ApJS, 110, 191
- Dey & van Breugel (1994) Dey, A. & van Breugel, W.J.M. 1994, AJ, 107, 1977
- Fabbiano et al. (1992) Fabbiano, G., Kim, D.-W. & Trinchieri, G. 1992, ApJS, 80, 513
- Fabbiano et al. (1984) Fabbiano, G., Miller, L., Trinchieri, G., Longair, M. & Elvis, M. 1984, ApJ, 277, 115
- Fanaroff & Riley (1974) Fanaroff, B.L. & Riley, J.M. 1974, MNRAS, 167, 31P
- Fanti et al. (1985) Fanti, C., Fanti, R., Parma, P., Schilizzi, R.T. & van Breugel, W.J.M. 1985, A&A, 143, 292
- Giovannini et al. (1990) Giovannini, G., Feretti, L. & Comoretto, G. 1990, ApJ, 358, 159
- Hardcastle & Worrall (1999) Hardcastle, M.J. & Worrall, D.M. 1999, MNRAS, 309, 969
- Hardcastle & Worrall (2000a) Hardcastle, M.J. & Worrall, D.M. 2000a, MNRAS, 314, 359
- Hardcastle & Worrall (2000b) Hardcastle, M.J. & Worrall, D.M. 2000b, MNRAS, in press
- Helsdon & Ponman (2000) Helsdon, S.F. & Ponman, T.J. 2000, MNRAS, 315, 356
- Laing et al. (1983) Laing, R.A., Riley, J.M. & Longair, M.S. 1983, MNRAS, 204, 151
- Preibisch (1997) Preibisch, T. 1997, A&A, 320, 525
- Sambruna et al. (1999) Sambruna, R.M., Eracleous, M. & Mushotzky, R.F. 1999, ApJ, 526, 60
- Sarazin (1986) Sarazin, C.L. 1986, Rev. Mod. Phys., 58, 1
- Sciortino et al. (1995) Sciortino, S., Favata, F. & Micela, G. 1995, A&A, 296, 370
- Schwartz et al. (2000) Schwartz, D.A. et al. 2000, ApJ, 540, L69.
- Spencer et al. (1991) Spencer, R.E., Schilizzi, R.T., Fanti, C., Fanti, R., Parma, P., van Breugel, W.J.M., Venturi, T., Muxlow, T.W.B. & Rendong, N. 1991, MNRAS, 250, 225
- Stark et al. (1992) Stark, A.A., Gammie, C.F., Wilson, R.W., Bally, J., Linke, R.A., Heiles, C. & Hurwitz, M. 1992, ApJS, 79, 77
- van Breugel et al. (1992) van Breugel, W.J.M., Fanti, C., Fanti, R., Stanghellini, C., Schilizzi, R.T. & Spencer, R.E. 1992, A&A, 256, 56
- Wilkes et al. (1994) Wilkes, B.J., Tananbaum, H., Worrall, D.M., Avni, Y., Oey, M.S. & Flanagan, J. 1994, ApJS, 92, 53
- Worrall (1997) Worrall D.M. 1997, in Relativistic Jets in AGNs, ed. M. Ostrowski, M. Sikora, G. Madjeski & M. Begelman (Astronomical Observatory of the Jagiellonian University, Krakow), 20 (astro-ph/9709165)
- Worrall & Birkinshaw (1994) Worrall, D.M. & Birkinshaw, M. 1994, ApJ, 427, 134
- Worrall & Birkinshaw (2000) Worrall, D.M. & Birkinshaw, M. 2000, ApJ, 530, 719
- Zirbel (1997) Zirbel, E.L. 1997, ApJ, 476, 489


| Source | NH a | Date | Mission | Instrument | Energy | Exposure | |
|---|---|---|---|---|---|---|---|
| (cm-2) | Band (keV) | (ks) | |||||
| 3C 346 | 0.161 | 1993 Aug 14-17 | ROSAT | PSPC | 0.2–2.5 | 16.9 | |
| 1995 Feb 17-18 | ASCA | SIS, GIS | 0.4–10 | 21.6 | |||
| aafootnotetext: From Stark et al. (1992) |
| Parameter | Value |
|---|---|
| ROSAT counts (0.2-1.9 keV), | |
| a | |
| a | arcsec |
| keV | |
| Density: , | , cm-3 |
| Pressure: , | , dynes cm-2 |
| Cooling time: , | , years |
| ergs s-1 | |
| ergs s-1 | |
| (extrapolated) | ergs s-1 |
| (extrapolated) | ergs s-1 |
| aafootnotetext: and are highly correlated and errors are for two interesting parameters. See Figure 2 |
Note. — All measurements are from the ROSAT PSPC observation. Errors are . Multiply pressure values by 0.1 to give in units of N m-2 (Pascals).
| Parameter | Value |
|---|---|
| ROSAT counts (0.2-1.9 keV) | |
| ROSAT Power-law energy index, | |
| ASCA Power-law energy index, | |
| ROSAT PSPC | Jy |
| ASCA | Jy |
| ROSAT | ergs s-1 |
| ASCA (extrapolated) | ergs s-1 |
| ROSAT | ergs s-1 |
| ASCA | ergs s-1 |
| ROSAT (extrapolated) | ergs s-1 |
| ASCA | ergs s-1 |
Note. — Errors are .