The determination of mass of stellar disks of galaxies from the kinematic data.
Abstract
Different ways of the determination of masses of galactic disks, based on the kinematic data, are briefly discussed. The analysis of the rotation curves which reach maximum inside of a disk, and N-body modeling, reproducing the rotation curves and stellar velocity dispersion of real galaxies, enable to conclude that the mass of a disk is usually significantly less than the total mass of spherical components (bulge + dark halo) inside of optical borders of a galaxy, although the exceptions also exist.
Sternberg Astronomical Institute, 13, Universitetskii pr-t, Moscow, Russia
Volgograd State University,20,2 Prodolnaya, Volgograd, Russia
1. Introduction
The determination of masses of components of galaxies is hampered by the ignorance of the distribution of dark matter (DM) within their optical borders: we do not know whether it is concentrated in the disk (massive disk model) or in halo (massive dark halo model) or in both.
The most direct way to decompose mass distribution into disk and spherical components is the modeling of the rotation curves (RC) accepting that the M/L ratio of stellar components is approximately constant. In practice it usually means that the scalelength of stellar density distribution is taken to be close or equal to the photometric scalelength . But even in this approximation the results are usually ambiguous. The limiting case which do not contradict to the observed rotation curves is the ”max disk model”. In this case the contribution of stellar (+ gaseous) disk is scaled to explain the inner part of the RC, assuming the the role of halo is small there. It should be mentioned however that the result is rather sensitive to the radial extension of the measured rotation curve and to its correct shape. For the typical shapes of RC which have a plateau at large R the resulting values of for ”max disk model” are close to 3 for R = 2 and to 1 for R=4. However the reducing of mass of a disk down to factor 2-3 is usually also compatible with the shape of RC.
Several independent methods were proposed to determine masses and densities of disks, or to obtain some restrictions on the value of ratio of masses of spherical to disk components of individual galaxies, using the additional observational data. Among them are:
a) The presence or the absence of a bar ( is the condition of the development of bar-mode instability in a dynamically cool disk (Ostriker, Peebles, 1973)). However it is evident that the relative mass of spherical component is not the only parameter which determine the condition of the existence of a bar, especially if to take into account that there are several physical mechanisms of bar formation and bar destruction.
b) The introducing of spiral structure constraints related to the development of and modes, which imposes restrictions on the surface density of a disk (Athanassoula et al., 1987). A shortcoming of this approach is that it is based on a definite model of the origin of spiral density waves. In addition, the presence of a gas in the disk makes the condition of the large-scale density wave propagation much more complicated.
c) The estimation of stellar velocity dispersion in the disk (by direct way or by the measurement of the disk thickness for edge-on galaxies). Indeed, gravitational instability ”heats” a collisionless disk if its density exceeds some threshold value, which depends on the initial velocity dispersion and the RC. However there are no reliable analytical criteria of gravitational stability for 3-D collisionless disk, which makes the numerical modeling preferable (Bottema, 1993, 1997, Khoperskov et al., 2001,).
In this work we try to reveal the role of disk components using some pecularities of the shapes of RCs of some galaxies and also to determine the relative masses of spherical components for concrete galaxies, using numerical experiments of dynamical evolution of the disks.
2. Galaxies with the local maximum on the rotation curve
The shapes of the RCs of galaxies are rather different; it gives evidence that their mass distribution is not identical. Some fraction of rotation curves reach a maximum at some R= and/or decline in the periphery. The rotation curve component of exponential disk passes through maximum at . Therefore it is natural to expect that galaxies, in the inner region of which the disk mass fraction is especially large, should be among those where the observed RC has a maximum at . For these galaxies ”max disk model” will give the most justified solution, and, if the results are correct, the relative M/L ratio for them should be systematically lower than for those galaxies where a presence of DM smoothes out the maximum and increases this ratio.
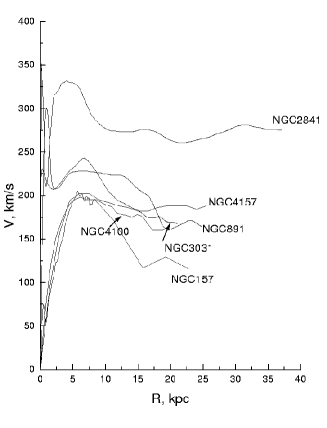
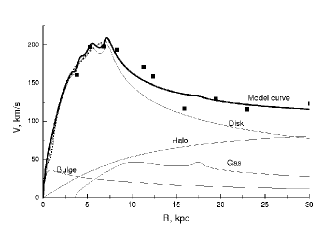
To verify it, we extracted galaxies with the inner maxima of RC from two samples of rotation curves, obtained with a good spatial resolution and presented by Sofue et al., 1999 and Sanders Verheijen, 1998. We also added to the list of objects the galaxy NGC 157, which demonstrates well defined maximum of V(R) (Ryder et al., 1998) . Altogether we found 22 galaxies which are not members of strongly interacting systems, where V(R) has maxima within the optical disk (circumnuclear extrema within R = 1 kpc were not considered). Practically all of these galaxies have photometrically determined values . A comparison of and has shown that in most cases the maximum of V(R) has nothing to do with the stellar disks: only six out of 22 galaxies have ratio close to 2. Their RCs are presented in Fig.1. We have modeled the RC of these galaxies using three components: bulge, disk with the constant and the thickness 0.5 kpc, and spherical quasi-isothermal dark halo component.
| Galaxy | Range of disk mass | |
|---|---|---|
| () | (solar units) | |
| NGC 157 | 4.9-5.2 | 1.6 |
| NGC 891 | 4.4 -11.6 | 11.1 |
| NGC 2841 | 7.6-11.5 | 10.0 |
| NGC 3031 | 3.9-5.2 | 6.0 |
| NGC 4100 | 3.1-5.6 | 6.5 |
| NGC 4157 | 4.6-5.6 | 7.6 |
A range of disk mass values which satisfy the rotation curve of chosen galaxies are given in Table1. The largest values correspond to ”max disk” model. With the exception of NGC 157, the range of possible values of masses of disks remains rather wide. Curiously the total mass within the optical diameter over luminosity is quite normal for these galaxies, being in the range 6-11 solar units (the only exception is NGC 157). It means that either the mass of DM within a given radius is quite normal for these galaxies in spite of the disk predominance in the inner , or the maximum of V(R) is caused not by the stellar disks, but by the non-typical distribution of DM in the halo or by non-circular motions.
The rotation curve of NGC 157 experiences a sharp drop just beyond the optical radius (Ryder et al., 1998). It is the only galaxy we found, where both signs of low mass of DM are present: first, the very extended rotation curve may be explained with low-massive halo, and second, the integral ratio is unusually low.
3. Numerical modeling
A general idea we followed in this work is that the disks of real galaxies should have the stellar velocity dispersion which equals (or, in general case, exceeds) the minimal value necessary for the disk to be gravitationally stable at a given R. To avoid the problem of the absence of reliable analytical criterion of stability for 3-D stellar disks, we use numerical simulations of marginally unstable collisionless disk of a given galaxy, the rotation curve and of which are known. At the end of numerical experiments, the initially unstable disk heats up to a steady condition and its kinematic properties ceased to change; usually it takes place after about 5 - 10 periods of disk revolution. Then we compared both the resulting model RC and dispersion curve with the observed ones to choose the best fit model.
The details of N-body simulations are described by Khoperskov et al., 2001. We used the direct p-p method to model the 3-D disk with given values of scale length and the outer border at , embedded into the rigid spherical components (bulge + halo). The ratio of spherical to disk masses within was considered as a free parameter, which varied from one model to another. Gas and young stars were not taken into account.
Initial velocity dispersion was chosen at sub-critical level for gravitational instability. In practice it corresponds to Toomre parameter ( is radial velocity dispersion of stars, - Toomre’ critical velocity dispersion for axisymmetrical perturbations) 0.8 - 1.2 along the radius. A set of experiments was done, which showed that the end results are not critical to the choice of the initial velocity dispersion if it remains subcritical and bar-mode does not develop in a disk. In the disks which are cool enough for the formation of a strong bar, the dynamical evolution of inner regions continues much longer and their ”heating” becomes more significant.
The experiments with different particle numbers from N = 2000 to N = 80000 enable us to conclude that the end results practically do not depend on N, if (depending on the initial mass distribution in galaxies). However in the presence of a bar the situation may be more complicated.
We applied N-body simulation to seven non-barred spiral galaxies (see Table 2), for which the rotation curves, radial scale lengths and radial distribution of stellar velocity dispersion of the disks are known (Bottema, 1993, 1999, Corsini, 1999).
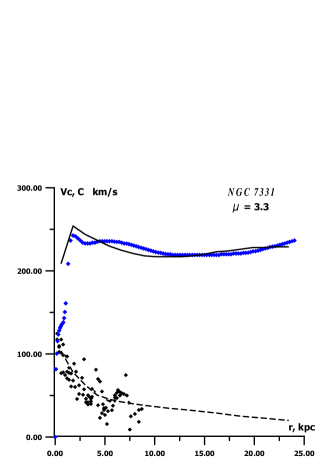
As one can expect, the resulting velocity dispersion at a fixed R depends on : it increases with the decreasing of relative masses of spherical components. For self-gravitating disks without spherical components is about 0.3-0.4 of maximal circular velocity (Morozov, 1987, Khoperskov et al., 2001). Line-of-sight components of the resulting model values of velocity dispersion were compared with the observational measurements and the best fit models were chosen. The example of model fitting for NGC 7331 is illustrated in Figure 3. The best fit values of and disk masses within are given in Table 2.
| Galaxy | Type | D | |||
|---|---|---|---|---|---|
| Mpc | kpc | ||||
| NGC 891 | SA(s)b | 9.4 | 18.4 | 1.8 | 6.7 |
| NGC 1566 | 15.0 | 9 | 1.7 | 3.1 | |
| NGC 2179 | (R)SA(r)0 | 35.6 | 16 | 1.1 | 4.9 |
| NGC 2775 | SA(r)ab | 15.7 | 12 | 1.7 | 4.2 |
| NGC 3198 | SB(rs)c | 8.8 | 10.4 | 2.1 | 1.8 |
| NGC 6503 | SA(s)cd | 5.9 | 4.6 | 2.0 | 0.5 |
| NGC 7331 | SA(s)b | 14.9 | 24 | 3.3 | 6.9 |
4. Conclusion
In general, a comparison of numerical models with observations favors the models with within the radius which exceed the expected values of for the ”max disk” solution favoring the light disk model. Similar conclusions about the predominance of heavy halo were discussed earlier by Bottema, 1993 (see also Khoperskov et al., 2001 and references therein). It is worth mentioning however that the dynamical heating of the disks may be caused not only by the gravitational instabilities, but also by some other reasons - for example by the encounter with neighbour galaxies. In this case the model velocity dispersion should be lower than the observed one for a given . It means that the model values of satisfying to the observations, are just a lower limit, which makes the contrariety with the ”max disk” solution even more significant.
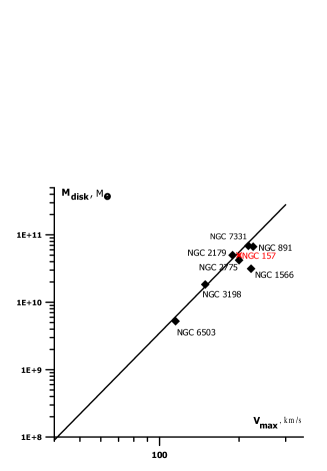
Figure 4 demonstrates that the mass of a disk found for galaxies discusses above is correlated with the maximal velocity of a galaxy rotation (Tully-Fisher - like dependence). This result both qualitatively and quantatively agrees with the relationship (straight line), recently found by McGaugh et al., 2000 for a sample of galaxies covering more than five orders of magnitudes of masses. They used indirect method of evaluation of , accepting = const for stellar disks and adding mass of interstellar gas to it. The origin of this relationship (and also Tully-Fisher relationship between luminosity and of galaxies) is a problem which has to be solved yet. It expresses the existence of a deep connection between masses of visible disks and DM. The latter, as it is confirmed in this work, is hidden in a halo rather than in a disk and its mass is evidently preponderates over within the optical borders of galaxies (however there some exclusions also exist).
This work has been partically supported by the Russian Foundation for Basic Research, grants 98-02-17102 and 99-07-90067.
References
Athanassoula E., Bosma A., Papaioannou 1987, A&A, 179, 23
Bottema R. 1999, A&A…348…77B
Bottema R. & Gerritsen J.P.E. 1997, MNRAS, 290, 585
Corsini E. M., Pizzella A., Sarzi M. et al. 1999, A&A, 342, 671
Khoperskov A.V., Zasov A.V., Tyurina N.V. 2001, Ast.Rep., in press
McGaugh S. S., Schombert J. M., Bothun G. D., de Blok W. J. G, 2000, ApJ, 533, L99
Ostriker J.P. & Peebles P.J.E., 1973, ApJ, 184, 719
Ryder S. D., Zasov A. V., Sil’Chenko O. K., McIntyre V. J., Walsh W. 1998, MNRAS, 293, 411
Sanders R. H. & Verheijen M. A. W., 1998, ApJ, 503, 97
Sofue Y., Tutui Y., Honma M. et al., 1999, A&A, 523, 136
Zasov A.V., Mikhailova E.A., Makarov D.I. 1991, Ast.Lett, 17, 374