Optical and X-ray monitoring of the NLS1 Galaxy Ark 564
Abstract
The Narrow-line Seyfert galaxy Ark 564 was monitored between June 04, 2000 and June 24, 2000 from Skinakas Observatory. The light curves obtained in and bands show night-to-night variations of mag. Comparison with X-ray data from a simultaneous ASCA long-look observation shows that the variations in X-rays are much more pronounced than in the optical band. A cross correlation analysis yields a time lag of days between X-rays and optical light (with the X-rays leading the optical), however with low statistical significance. We discuss possible implications of our results for physical models involving the reprocessing of the primary X-rays by the accretion disc.
Key Words.:
Galaxies: active — Galaxies: Seyfert — Galaxies: individual: Ark 564 — Galaxies: photometry — X-rays: galaxies1 INTRODUCTION
Narrow-line Seyfert 1 (NLS1) galaxies are a peculiar group of AGN characterized by their optical line properties: H FWHM does not exceed 2000 km s-1, the [O III]5007 to H ratio is less than 3, and the UVvisual spectrum is usually rich in high-ionization lines and strong Fe II emission multiplets (Osterbrock & Pogge 1985). In hard X-ray studies NLS1 galaxies comprise less than 10% of the Seyfert galaxies, however, from the ROSAT All-Sky Survey it became clear that about half of the AGN in soft X-ray selected samples are NLS1 galaxies (Grupe 1996, Hasinger 1997).
Boller et al. (1996) found from ROSAT observations that the soft X-ray spectra of NLS1 galaxies are systematically steeper than those of broad line Seyfert galaxies and that an anti-correlation exists between the X-ray photon index and the FWHM of the H line which provides strong evidence for a physical link between the intrinsic properties of the continuum emission and the dynamics of the broad line region. They further discovered that NLS1 galaxies frequently show rapid short time scale X-ray variability which can be interpreted as evidence for small black hole masses in these objects. Further examples of extreme X-ray variability were found in monitoring observations of IRAS 13324-3809 (Boller et al. 1997) and PHL 1092 (Brandt et al. 1999).
An ASCA observation of RE 1034+39 revealed a very strong soft X-ray excess component dominating the spectrum below 2 keV and a very steep hard X-ray spectrum with photon index (Pounds et al. 1995). This prompted Pounds et al. to propose that NLS1 galaxies are the supermassive analogs of Galactic black hole candidates in the soft state. This analogy supports the idea that the properties of NLS1 galaxies originate from accretion near the Eddington rate onto a central black hole of moderate mass.
Recent detailed spectral and variability X-ray studies of NLS1 galaxies show that these objects exhibit peculiar spectral features which have not been observed in Seyfert 1 galaxies with broad optical lines (for a comprehensive overview see Leighly 1999 a,b). The high accretion rate, generally thought to be the determining parameter of the systems, would lead to an increasing ionizing flux and the observed spectral features can be explained as arising from an ionized disc (Pounds & Vaughan 2000).
Ark 564 is the X-ray brightest NLS1 galaxy with a 210 keV flux of erg cm(Vaughan et al. 1999). Its X-ray properties are typical of NLS1 galaxies. It shows no neutral absorption in the rest frame of the galaxy, nor warm absorption due to ionized material. Its soft X-ray continuum has a steep slope (, Brandt et al. 1994), due to the presence of strong soft excess emission and the hard X-ray band energy spectrum is steep (, Leighly 1999b).
The soft and hard X-ray flux of Ark 564 is variable both on short and long time scales (Brandt et al. 1994, Leighly 1999a). In an ASCA observation of day the keV light curve showed an overall variation by a factor . Its excess variance was found to be similar to that of broad line Seyfert 1 galaxies but the variability is stronger in the hard energy band while broad line Seyferts vary more at lower energies (Edelson 2000). Interestingly, the source also showed spectral variations which were uncorrelated with the source flux (Leighly 1999a).
In view of the strong X-ray variability displayed by NLS1 galaxies it appears surprising that in the optical band the objects seem to be less variable than broad line Seyferts (Giannuzzo et al. 1998). In an attempt to evaluate the line - to - continuum time lag Shemmer & Netzer (1999) found no significant variability from Ark 564 on long or short time scales.
A comparison of the variations in different energy bands can provide valuable information for the understanding of the geometry and the nature of an AGN. In particular, time lags between different wave bands have been used to discriminate between primary and reprocessed emission and to obtain bounds on the size of the emission region. However, so far only relatively few X-ray - and UV/optical monitoring programs have been carried out for only a few Seyfert galaxies (see Maoz et al. 2000 and references therein).
We conducted an optical monitoring campaign on Ark 564 at the Skinakas observatory in Crete simultaneously with the ASCA AO8 long-look observation of the source. In the next section we will give the details of the observations, then describe the cross-correlation analysis between the optical and X-ray data and finally discuss the results.
2 Observations and Data Reductions
2.1 The optical observations
We conducted an optical monitoring campaign of Ark 564 from June 04, 2000 to June 24, 2000 at Skinakas Observatory in Crete, Greece. The telescope is an 1.3 m, f/7.7 Ritchey-Cretien. The observations were carried out through standard Johnson and Cousins filters and the CCD used was a Tektronix chip with 24m pixels (corresponding to 0.5′′ on sky). The exposure time was 60, 30, 20 and 10 sec for the and filters respectively. During this 21 day period we obtained data for 17 nights. The object was observed between two and six times each night; in total, there are 60 frames in each filter.The seeing during the observing run was between and . Standard image processing (bias subtraction and flat fielding using twilight-sky exposures) was applied to all images.
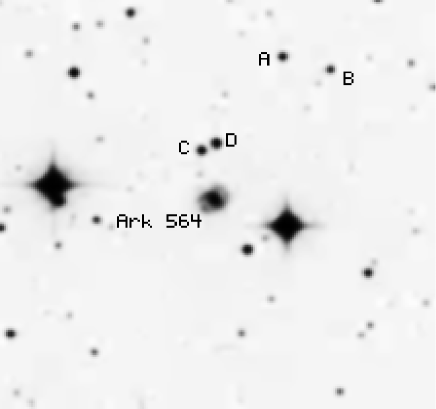
We did not find any published comparison star sequence in the field of Ark 564. We therefore chose four unsaturated stars, close to the galaxy (see Figure 1) and carried out aperture photometry by integrating counts within circular aperture centered on each star. The aperture had a radius equal to 4 times the seeing full-width at half-maximum (FWHM) of each frame in order to include all the light from the stars. Their instrumental magnitudes were transformed to the standard system through observations of standard stars from Landolt (1992) during the last four days of the observing run. Table 1 lists the magnitudes of the reference stars on the field of Ark 564 ; quoted errors include both the uncertainty in the determination of the instrumental magnitudes (based on photon statistics) and the uncertainty associated with the transformation to the standard system.
| A | ||||
|---|---|---|---|---|
| B | ||||
| C | ||||
| D |
For the AGN nucleus aperture photometry was carried out using the same size aperture as for the comparison stars. Since the host galaxy is much less affected by seeing variations, its contribution to the counts within an aperture depends on the aperture’s radius. We corrected for this effect by plotting the instrumental magnitudes vs FWHM for each band. We then fitted the data with a straight line and used the best-fitting parameters to scale the host galaxy contribution at each aperture to its contribution in the largest aperture.
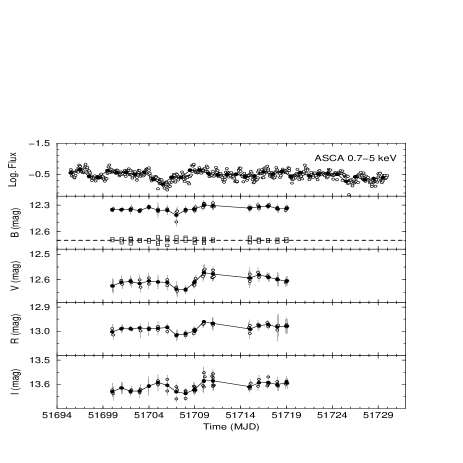
To assure that the comparison stars are constant we performed relative photometry by calculating the difference between a star’s instrumental magnitude in a given epoch and its magnitude in a certain frame, the “reference frame”. For each of the reference stars, these differences were averaged using the remaining three stars as comparison stars. The standard deviation of the resulting light curves was 0.05, 0.03, 0.02 and 0.02 mag in the and band, respectively (see Fig. 2). These values provide an estimate of the typical error on the magnitude measurement of Ark 564. Since during some nights the light curves show scatter larger than average, we used the standard deviation of the reference stars during each night as a measurement of the uncertainty of the object’s magnitude at the same night.
Finally, the redenning correction in the direction of Ark 564 was taken mag. It was derived using (Walter and Fink 1993) and the conversion formula of Cardelli et al. (1989) with . From the curve of Cardelli et al. we also derived the extinction (in magnitudes) in the other filters as well: and .
2.2 The X-ray data
ASCA observed Ark 564 from 2000 June 01 11:51:27 to 2000 July 05 23:57:54. We extracted the X-ray data from the public archive at ISAS and applied standard criteria for the data analysis in order to create light curves for all four instruments. Source counts were accumulated from a rectangle in detector coordinates to maximize the X-ray signal for the SIS0/1. For the GIS2 and GIS3 we used a 6 arcmin radius centered on the source. The background was estimated from a source free region on the same chips from the same observation. In the case of the GIS detectors we chose a region at an off-axis distance of 11′ as the source was very bright. In general, the background level was less than 3% of the source count rate.
During the analysis it became apparent that all four instruments suffered from an unexpected light leak. This is probably due to an expansion of the atmosphere caused by recent solar activity and to the low satellite orbit during the observation. We investigated this light leak effect using energy spectra, low energy light curves, and DFE curves for each of the individual, about three day long, data sets (each FRF file). We found that in the data screening the BR_EARTH criterion should not only be applied to the SIS data but to the GIS data as well. Furthermore, the BR_EARTH criterion for the SIS was changed from to 35∘ and for the GIS from 12.5∘ to 17.5∘.
3 Data Analysis
3.1 Variability Amplitudes
The de-reddened and light curves (in magnitudes) together with the SIS0/1 keV light curve are shown in Fig. 2. Large amplitude variations are seen in the X-ray band on all time scales while in the optical band we observe variations of a much smaller amplitude. We do not detect any significant optical intra-night variations while the X-ray flux changes significantly from orbit to orbit. We performed a test against the hypothesis that the optical flux was constant. In order to increase the signal to noise ratio we used light curves of the mean optical magnitude per night. We find that the small amplitude variations on time scales larger than a day are significant at confidence in all bands.
In order to quantify the amplitude variations we computed the fractional excess variance, (Nandra et al. 1997). The square of this parameter () gives the fractional amplitude of the observed variability. In order to calculate the optical we computed the mean de-reddened magnitudes per night, converted them into flux and corrected for the contribution of the host galaxy to the mean flux. For that reason, we used the PSF fitting routines of DAOPHOT in IRAF to subtract the nucleus image from each frame and calculated the magnitude before and after the nucleus subtraction. After this correction we found that: and . The average optical continuum is .
In the X-ray band, we combined SIS1/0 and GIS2/3 data and accumulated light curves for the SIS keV, keV and the GIS keV bands (we used the GIS data in that band because the GIS light curve has a higher than the SIS light curve count rate). The estimation of depends on the bin size and length of the light curve. The use of light curves of the mean optical magnitude per night in the estimation of the optical means that the optical data were binned in hrs (the typical period during which the optical observations were made each night). Therefore, the X-ray light curves were accumulated in 16920 sec ( orbital periods hours) and were divided in two parts, so that each one of them has a length similar to that of the optical light curves. We computed the for each part and took their mean as our final estimate. Our results are as follows: keV)keV), and keV.
3.2 Cross Correlation analysis
In order to examine the cross-links between variations in different bands we estimated the cross-correlation functions using the Z-transformed Discrete Correlation Function (ZDCF) of Alexander (1997) and the Discrete Correlation Function (DCF) of Edelson & Krolik (1988). Quoted errors on the ZDCF lags correspond to confidense limits and were estimated using the Monte Carlo methods described by Peterson et al. (1998). All the X-ray light curves were binned in 5640 sec while for the optical band we used the light curves of the mean flux per night.
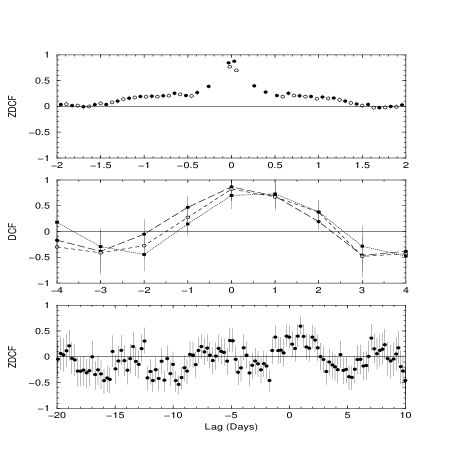
Fig. 3 (upper plot) shows the ZDCF between the SIS keV and the SIS keV, GIS keV light curves (filled, open circles respectively). The highest points are at lags days and days respectively. The errors associated with the maximum peak are quite large, probably because there are a few points arount the peaks in the ZDCF, and the use of a large bin size for the light curves. Therefore, we computed the cross correlation between the same bands using 128 sec binned light curves. The maximum peak was at lag zero. We conclude that there are no measurable delays between the X-ray bands. If there exist any delays between the X-rays bands they have to be smaller than few tens of seconds.
In the same Fig. (middle plot) we plot the cross correlation between the , and light curves (filled circles connected with a long-dashed line, open circles connected with a dashed line and filled squares connected with a dotted line respectively). Due to the small number of points in the light curves the ZDCF (which bins data by equal population) provides two estimates at zero lag and then at lags days. Since we are interested in the estimation of the correlation coefficient at a more evenly spaced grid of lags, we used instead the DCF technique which bins data in time bins of equal width. We used a lag bin size of day and kept the DCF estimates at those lags with at least 10 individual points contributing to the DCF. Fig. 3 shows that the optical variations are well correlated across the different bands (the DCF peak is larger than 0.7 in all cases). The , and bands appear to be delayed with respect to the band light curve with the delay increasing towards longer wavelengths. A parabolic fit is centered at and days. The small number of points in the light curves does not allow us to compute accurate errors on these lag measurements. As a conservative estimate on the lag uncertainty we accept the day, days) interval beyond which the correlation is . We conclude that the small amplitude optical variations vary nearly simultaneously at all bands with at most a day lag between the and the band.
Finally we computed the ZDCF between the X-rays and the band light curve (lower plot in Fig. 3). In the X-rays, in order to increase the signal to noise we combined SIS1/0 data and accumulated a light curve in the keV band (the addition of the keV data, even if we combine GIS2/3, adds more to the noise than the signal, because of the steep X-ray energy spectrum of the source). The ZDCF is plotted at lags where at least half of the optical light curve points contribute to the estimation of the correlation (this is the reason that the center of the plot is not at zero lag). The ZDCF peak is at lag days. Similar results are obtained when we cross correlate the X-ray light curve with the other optical light curves as well. To assess quantitatively the significance of the correlation, we have carried out Monte Carlo simulations as follows. Synthetic optical light curves with an and red noise power spectral density functions were created following the method of Timer and König (1995). The simulated light curves had the same variance and sampling pattern as the real optical light curve. Random Gaussian “errors”, equal to the average error in the real light curve were also added to the points in the simulated light curves. The ZDCF between the synthetic optical and the real X-ray light curve was then computed, and the maximum peak between lags and days was kept. The whole process was repeated 2000 times for each choice of optical power spectrum. In this way the sample distribution of the ZDCF peaks can be computed. We found that the observed correlation is significant at the 87, and level for a and optical power spectrum, respectively. We conclude that the maximum correlation coefficient in the X-ray/optical ZDCF is statistically not significant in the sense that the observed correlation could be due to the red noise character of the variations in the light curves.
4 Discussion
We have presented a temporal analysis of a day long ASCA observation of Ark 564 together with simultaneous optical monitoring observations. Strong variability is observed in all X-ray bands. Optical variations are also observed. Although statisctically significant, their amplitude is much smaller than the amplitude of the X-ray variations. The variations within the optical bands are strongly correlated. The B/V,R,I cross-correlation functions show a sharp peak at a lag which increases from the to the cross-correlation. However, the increase of the delay within the optical bands is not statistically significant and the cross-correlation results are consistent with the hyposthesis that the optical variations vary almost simultaneously at all bands. We also observe a peak at zero lag in the X-ray/optical cross-correlation function. Its presence implies that the optical and X-ray variations are positevely correlated but the statistical significance of the peak is low.
We now discuss our results in terms of models for AGN which involve X-ray reprocessing mechanisms for the production of the UV/optical emission in these objects. Due to the low statistical significance of the X-ray/optical cross-correlation peak and of the time delays within the optical bands, the scenarios that we discuss below based on these results should be considered as suggestive physical interpretations. Denser optical light curves are needed in order to confirm the correlation between the X-ray and optical variations and the existence of time delays within the optical band in this source, allowing us a more quantitatively discussion of the predictions of the respective physical models.
It is generally assumed that the X-rays in AGN arise from within a few innermost radii (, where is the Schwarzschild radius) of a supermassive black hole. There is lot of evidence from X-ray energy spectral observations, mainly the 6.4 keV iron line and the so called “Compton bump” (Nandra & Pounds 1994), that the X-ray source in AGN illuminates a relatively dense and cool material (i.e. the accretion disc). If that is the case, the heated disc is expected to radiate in the ultraviolet/optical as well. So X-rays could be responsible for some or all of the optical radiation via reprocessing (Guilbert & Rees 1988). In fact, some Comptonisation models which provide a good agreement with the observed X-ray energy spectra of AGN, assume a specific geometry which involves a slab of neutral material subtending a solid angle of sr to the X-ray source located above the slab (eg Haardt & Maraschi 1991). The X-ray luminosity of Ark 564 is erg s-1 (Leighly 1999a, Vaughan et al. 1999). The sum of the mean and luminosity during our monitoring campaign is erg s-1. Under the assumption that half of the the X-ray flux is heating the disc, we expect the X-rays to affect the disc output significantly in Ark 564. Consequently, we should observe optical variations which follow those in the X-ray band, perhaps smoothed out (below a certain time scale) due to geometric, light travel time and variability amplitude of Ark 564 is times that in the optical. This result alone strongly suggests that most of the optical emission in Ark 564 is not reprocessed X-ray emission by optically thick material. Either only a small part of the disc is seen by the X-ray source (i.e. the X-ray source is not located above the disk but in its innermost part and has a small height so the solid angle subtended by the disc is small) or the X-rays are not isotropically emitted (i.e. most of the X-ray flux is emitted away from the disc).
Furthermore, our optical campaign revealed small amplitude, but statistically significant optical variations. These are observed at all optical bands and are well correlated (with a maximum time lag of days) within the different bands. What could be their origin? One possibility is that some part of the X-ray emission is, after all, heating the disk, producing a reprocessed, variable optical component. In this case, we expect to observe a time delay between the reprocessed optical and X-ray emission of the order of , where is the distance between the X-ray source and the re-processing region. We do observe a time lag of day between X-ray and optical variations. If this is real (which implies that the low significance of the X-rays/optical correlation is due to the small number of points in the optical light curves) we also expect to observe time delays within the optical band. Assuming the temperature structure of a steady-state accretion disc these delays should follow the relationship (Collier et al. 1998). In this case, and . Interestingly, the ratio of the respective observed lags (see section 3.2) is and . This good agreement between the expected and the observed delays between the optical bands supports the idea that the variable optical component is reprocessed X-ray emission from optically thick material. The upper limit on the time lag between X-rays and optical light curves is days. Consequently, the optical emission region should be at a distance smaller than cm from the black hole, i.e. at of a M⊙ black hole.
On the other hand, optical variations with delays between the optical bands are also expected if there are instabilities propagating through an accretion disc. In the case of a standard thin accretion disc with sub-critical accretion rate the known mechanism for the instability propagations (sound waves) is generally too slow to account for time lags of the order of a few days (e.g. Krolik et al. 1991; Molendi, Maraschi & Stella 1992). If NLS1s have low black hole masses and near-critical accretion rates the sound waves can propagate at a very high speed, however detailed calculations in order to investigate whether the sound crossing time in this case could explain the observed delays are beyond the scope of the present work. Perhaps a more natural explanation for the low-amplitude optical variations is that they are due to a flux modulation of a region that does not dominate the optical emission. For example, the innermost part of a standard accretion disk around a supermassive black hole is expected to emit as a black body mainly at the UV. Some of this radiation will be emitted in the optical band as well. Consequently, if that region is variable due to a thermal or viscous instability one expects simultaneous UV/optical variations and the variability fractional amplitude to decrease with frequency. We find no evidence of energy dependent variability amplitudes, although a longer optical light curve is needed to reduce the errors on the variability amplitudes and place stronger constraints. Densely sampled UV and optical monitoring, simultaneously with X-ray, is needed in order to investigate further the origin of the small amplitude optical variations in Ark 564.
Our results on the amplitude of Ark 564 optical variations are consistent with previous optical observations of other NLS1s like NGC 4051 (Done et al. 1990, Peterson et al. 2000) and IRAS 13224-3809 (Young et al. 1999; but note Miller et al 2000, who observe larger amplitude variations on short time scales in this source). In general, the optical variations in NLS1s are of smaller amplitude than those observed in the X-rays on time scales of day. Although the number of objects that have been studied so far is small, the results suggest that there is no significant reprocessing of X-rays into the optical waveband in NLS1s. Optical variability amplitudes significantly smaller than those in the X-rays have also been observed in “typical” Seyfert 1 galaxies like NGC 3516 and NGC 7469 (Edelson et al. 2000, Collier et al. 1998). Perhaps then, more complex geometrical and physical configurations have to be considered for the Seyefrt galaxies, as a group, instead of the currently used simple reprocessing scenarios. The similarity of the optical variability amplitudes implies a common origin for the optical variable component in Seyfert 1s. One possibility is reprocessing from optically thick material of a small fraction of the X-ray flux. The NGC 469 data support this hypothesis (Collier et al. 1998); the present data on Ark 564 are also consistent with it but this is not the case with NGC 3516 (Edelson et al. 2000). If on the other hand the optical variability is due to instabilities of the accretion disc, the similarity of the optical variability amplitudes is a rather unexpected result if NLS1s have black hole masses smaller and accretion rates higher than other AGNs. The data so far do not permit a detailed comparison between NLS1s and typical S1s; intense optical observations of many objects from both classes is needed to clarify this issue.
Acknowledgements.
We thank J. Englhauser and T. Reiprich and for helping us with the observations. Part of this work was done in the TMR research network ’Accretion onto black holes, compact stars and protostars’ funded by the European Commission under contract number ERBFMRX-CT98-0195. Skinakas Observatory is a collaborative project of the University of Crete, the Foundation for Research and Technology-Hellas, and the Max–Planck–Institut für extraterrestrische Physik.References
- (1) Alexander T., 1997, in: Maoz D., Sternberg A., Leibowitz E. (eds) Astronomical Time Series. Kluwer, Dordrecht, p.163
- (2) Boller T., Brandt W.N., Fink H., 1996, A&A 305, 53
- (3) Boller T., Brandt W.N., Fabian A.C., Fink H., 1997, MNRAS 289, 393
- (4) Brandt W.N., Fabian A.C., Nandra K., Reynolds C.S., Brinkmann W., 1994, MNRAS 271, 958
- (5) Brandt W.N., Boller Th., Fabian A.C., Ruszkowski M., 1999, MNRAS 303,53
- (6) Cardelli J.A., Clayton G.C., Mathis J.S., 1989, ApJ 345, 245
- (7) Collier S.J., Horne K., Kaspi S., et al., 1998, ApJ 500, 162
- (8) Done C., Ward M.J., Fabian A.C., et al., 1990, MNRAS 243, 713
- (9) Edelson R., Koratkar A., Nandra K., et al., 2000, ApJ 534, 180
- (10) Edelson R., 2000, New Astr. Rev. 44, Nos. 7-9, 423
- (11) Edelson R. A., Krolik J. H., 1988, ApJ 336, 749
- (12) Giannuzzo M.E., Mignoli M., Stirpe G.M., Comastri A., 1998, A&A 330, 894
- (13) Grupe D., 1996, PhD thesis, Univ. Göttingen
- (14) Guilbert P.W., Rees M.J., 1988, MNRAS 233, 475
- (15) Haardt F., Maraschi L., 1991, Apj 380, L51
- (16) Hasinger G., 1997, in Makino F., Mitsuda K. (eds) X-ray Imaging and Spectroscopy of Cosmic Hot Plasmas, UAP, Tokyo, p.263
- (17) Landolt A., 1992, AJ 104, 340
- (18) Krolik J., Horne K, Kallman T.R., et al., 1991, ApJ 371, 541
- (19) Leighly K.M., 1999a, ApJS 125, 297
- (20) Leighly K.M., 1999b, ApJS 125, 317
- (21) Maoz D., Edelson R., Nandra K., 2000, ApJ 119, 119
- (22) Miller H.R., Ferrara E.C., McFarland J.P., et al., 2000, New Astronomy Reviews, 44, 539
- (23) Molendi S., Maraschi L., Stella L., 1992, MNRAS 255, 27
- (24) Nandra K., George I.M., Mushotzky R.F., Turner T.J., Yaqoob T., 1997, ApJ 477, 602
- (25) Nandra K., Pounds K. A., 1994, MNRAS 268, 405
- (26) Osterbrock D.E., Pogge R.W., 1985, ApJ 297, 166
- (27) Peterson B.M., McHardy I.M., Wilkes B.J., et al., 2000, ApJ (in press)
- (28) Peterson B.M., Wanders I., Horne K., et al., 1998, PASP 110, 660
- (29) Pounds K., Done C., Osborne J., 1995, MNRAS 277, L5
- (30) Pounds K., Vaughan S., 2000, New Astr. Rev. 44, Nos. 7-9, 431
- (31) Shemmer O., Netzer H., 1999, in proceedings of the conference ”Observational and theoretical progress in the study of Narrow-Line Seyfert 1 Galaxies”,
- (32) Timer J., König M., 1995, A&A 300, 707
- (33) Vaughan S., Reeves J., Warwick R., Edelson R., 1999, MNRAS 309, 113
- (34) Walter R., Fink H.H., 1993, A&A 274, 105
- (35) Young A.J., Crawford C.S., Fabian A.C., Brandt W.N., O’Brien P.T., 1999, MNRAS 304, L46