A cloudy model for the Circumnuclear Disk in the Galactic Centre
We present a first attempt to construct an analytic model for a clumped gas and dust disk and apply it to the Galactic Centre. The clumps are described as isothermal spheres partially ionized by the external UV radiation field. The disk structure formed by the clouds is described as a quasi standard continuous accretion disk using adequately averaged parameters of the discrete cloud model. The viscosity in the Circumnuclear Disk is due to partially inelastic cloud–cloud collisions. We find two different solutions for the set of equations corresponding to two stable cloud regimes: (i) the observed molecular clouds and (ii) much lighter and smaller clouds which correspond to the stripped cores of the observed clouds. It is shown that the resulting physical characteristics of the heavy clouds and the disk are in very good agreement with all comparable observations at multiple wavelengths. A mass accretion rate of M⊙ yr-1 for the isolated Circumnuclear Disk is inferred. We propose that the Circumnuclear Disk has a much longer lifetime ( yr) than previously assumed.
Key Words.:
ISM: clouds – ISM: evolution – ISM: HII region – Galaxy: center1 Introduction
The Galactic Centre is surrounded by a large number of gas and dust clouds forming a thick disk (Circumnuclear Disk CND) up to a radius of 7 pc111We assume 8.5 kpc for the distance to the Galactic Centre.. This disk was discovered by Becklin, Gatley, & Werner (1982) interpreting their FIR data as a tilted dust ring. It has its minimum emission towards the central compact radio source SgrA∗. Subsequently, the CND was investigated by several authors observing the emission of dust, molecules and atoms.
-
•
Dust: Mezger et al. (1989), Davidson et al. (1992), Dent et al. (1993), Telesco et al. (1996)
-
•
Molecules: Gatley et al. (1986) (H2), Serabyn et al. (1986) (CO, CS), Güsten et al. (1987) (HCN), DePoy et al. (1989) (H2), Sutton et al. (1990) (CO), Jackson et al. (1993) (HCN), Marr, Wright, & Backer (1993) (HCN)
-
•
Atoms: Lutgen et al. (1986) (Cii), Jackson et al. (1993) (Oi)
They concluded that the CND has a hydrogen mass of a few 104 M⊙. The disk is very clumpy with an estimated area filling factor of and a volume filling factor of . The clumps have densities of several 105 cm-3, radii of 0.1 pc and gas temperatures 100 K. A typical dust clump has A and M30 M⊙. The physical parameters of the clouds in the central 2 pc are listed in Jackson et al. (1993). They are partially ionized by the radiation of the central Hei star cluster (see e.g. Genzel et al. 1996). A low density ionized gas with a density of 103 cm-3 (Erickson et al. 1994) and a temperature of a typical Hii region of T7000-8000 K surrounds the clouds. The vertical thickness of the CND increases from 0.5 pc at a radius of 2 pc to 2 pc at 7 pc. The disk rotates with a velocity of 100 km s-1 which corresponds to a Keplerian velocity around a central object of several 106 M⊙ and has a velocity dispersion of 30 km s-1. It is inclined by an angle relative to the line of sight (LOS). Due to its clumped structure, the CND is usually assumed to be a rather short-lived transient feature ( yr) (Güsten et al. 1987).
At a distance of 1.7 pc from Sgr A∗ it has a sharply defined inner edge (Marr et al. 1993). The dust and molecular line emission drops there by an order of magnitude. This defines the outer limit of the Central Cavity (CC) which contains the Hii region Sgr A West. It was investigated in detail by Lo & Claussen, Lacy et al. (1991), Roberts & Goss (1993), Lacy (1994).
Three dimensional kinematical models were made by Davidson et al. (1992) for the dust emission, Marshall & Lasenby (1994) for the molecular line emission, and Vollmer & Duschl (2000) for the ionized component. They conclude that there is a single plane in which the major parts of the CND is located.
As yet, there are only few attempts to construct a physical model for the CND. Wardle & Königl (1990, 1993) investigated a continuous smooth disk model for the CND including the magnetic field. They succeeded in explaining the dust polarization observed by Hildebrand et al. (1993). On the other hand, Krolik & Begelman (1988) constructed a clumpy disk model for AGNs where cloud-cloud collisions are responsible for the energy and momentum transport and thus for the viscosity. Cloud–cloud collisions dissipate orbital energy resulting a net inward drift of the clouds. If the angular momentum of one cloud is low enough it can be ‘captured by the central object, providing its accretion fuel’ (Krolik & Begelman 1988). They mentioned that the clouds observed by Genzel et al. (1985) have a column density comparable to the Jeans column density. However, they conclude that selfgravity cannot overcome tidal shear.
Shlosman & Begelman (1987) pointed out that a necessary condition for the fragmentation of an externally heated disk is that the cooling time must be shorter than the orbital time. They argued that this is often the case for disks in which the temperature is regulated by dust. Furthermore, Shlosman et al. (1990) discussed the possibility of fueling an AGN by the means of a cloudy disk.
Given the area and volume filling factor of the CND, it is clear that a continuous, smooth molecular disk is ruled out. A model of a clumpy disk is needed. In this paper we present such a model. First we describe the outlines of the model disk physics (section 2). We then give a description of the viscosity in the disk and discuss the energy dissipation mechanism in section 3. We present the model for a partially ionized globule (PIG), give the equations for the disk, and treat the physical conditions in section 4. The results and the verification of the assumptions are shown in section 5. Section 6 treats the influence of the tidal shear on the clouds. We discuss the mass accretion rate in section 7. The conclusions are given in section 8.
2 The outlines of the model
We assume that during a short accretion event ( yr) an amount of gas of several 104 M⊙ is driven into the Galactic Centre region at distances less than 10 pc. The accreted mass is not uniform but has density fluctuations. This clumpy medium is exposed to the ambient UV radiation field due to the population of young O/B stars in the Galactic Centre. Low density regions of the infalling gas are evaporated rapidly while regions of higher density stay molecular and are heated to an equilibrium temperature during less than an orbital period. In this way gas clouds of different masses and different sizes are formed. At a given distance from the Galactic Centre only clouds with a central density high enough to resist tidal shear can survive. In these clouds the thermal pressure is balanced by gravitation. They are assumed to be isothermal. Since the UV radiation comes mainly from the Galactic Centre their radius in this direction is given by the location of the ionization front resulting from the incident radiation. The radius of the opposite side is given by the pressure of the ionized gas which fills the space between the clouds. During the infall the clouds have frequent partially inelastic collisions. These collisions are highly dissipative because the cooling time is much shorter than the duration of the collision (Krolik & Begelman 1988). These collisions can lead to cloud fragmentation, mass exchange, or coalescence depending on the mass ratio and velocity difference of the colliding clouds. If the initial infalling gas has a total angular moment which is not zero these collisions will lead to the formation of a disk structure, corresponding to a clumpy accretion disk, i.e. the CND. Within this disk structure clouds lose orbital energy during dissipative collisions. This results in a net inward drift of the clouds, i.e. angular momentum is transported due to cloud–cloud collisions (Krolik & Begelman 1988, Ozernoy, Fridman, & Biermann 1998).
We adopt two different views to model the CND as a clumpy accretion disk as described above. First, the small-scale aspect where the gas clouds are treated as isothermal selfgravitating spheres. For each distance to the Galactic Centre the cloud structure is calculated with a given central density, temperature, and external pressure due to the ionization front. Second, the large-scale aspect where the cloud distribution is smoothed out over the whole disk resulting in a continuous accretion disk model. Both models share the same temperature distribution and the same UV radiation field with respect to their distance to the Galactic Centre. The connection between the small-scale and the large-scale model lies in the link between the central density of the clouds and that of the accretion disk. In addition, the disk viscosity due to partially inelastic collisions is taken into account in the large-scale model.
2.1 The gas clouds
The gas clouds are exposed to the radiation field of the central Hei star cluster, which ionizes the illuminated surface. The gas in the ionization front flows away from the clump and fills up the whole volume of the disk providing an outer pressure at the cloud surface which is not illuminated. The external radiation field is also responsible for the gas temperature within the cloud, which is assumed to be constant. Consequently, the cloud is modeled as an isothermal sphere whose boundary is given at the illuminated side by the location of the ionization front and at the shadowed side by the pressure of the ionized intercloud gas. For a quantitative estimate we can solve the virial theorem for the surface pressure :
| (1) |
where is the specific heat, the cloud mass, the temperature inside the cloud, its radius, and is a factor of order one. The outer pressure can be translated into an electron density, taking =7000 K for the intercloud medium (Roberts & Goss 1993). We set M⊙ and =100 K. The deduced electron density is plotted in Fig. 1.

The electron density at a radius of 0.1 pc is of the order of 500 cm-3 which compares very well with the observed value (e.g. Erickson et al. 1994) considering the approximate character of the model.
The CND consists of 1000 gas clouds. Each of these clouds has a mass of 30 M⊙ (see e.g. Jackson et al. 1993).
2.2 The accretion disk
The clouds can have partially inelastic collisions, which are responsible for the energy dissipation and the transport of angular momentum, i.e. the viscosity (Ozernoy et al. 1998). The standard viscosity description does not apply in this case, because the turbulence in the CND is supersonic. Therefore, we derive a new viscosity description, which is based on Kolmogorov’s theory. This viscosity depends on the disk height and the energy dissipation rate. At the smallest scales the energy is radiated away by infrared line emission. Thus, the disk is described following the standard equations for a smooth continuous disk (see e.g. Pringle 1981) with the modified viscosity description. In this picture the different components (neutral and ionized) of the discrete cloud model are completely mixed and the disk central density is directly related to the clouds’ central density at a given distance from the Galactic Centre.
3 The turbulent viscosity
In a turbulent medium kinetic energy is transferred from large scale structures to small scale structure practically without losing energy. So there is a constant energy flux from large scales to small scales where the energy is finally dissipated. Since the velocity dispersion ( km s-1) within the disk is more important than the shear, there is no preferred transfer direction. The turbulence can thus be assumed as isotropic. In this case the similarity theory of Kolmogorov applies (see e.g. Landau & Lifschitz 1959). The assumption of a universal Kolmogorov equilibrium implies that the kinetic energy spectrum of the turbulence depends only on the energy dissipation rate per mass unit and the characteristic size of the turbulent eddy , where is the wave number. The kinetic energy is related to the mean kinetic energy in the following way:
| (2) |
where is the velocity of the medium. Kolmogorov’s theory yields
| (3) |
where C is a constant of the order of unity. Considering a schematic energy spectrum given by , for and for and by equation (3) for , we can derive expressions for the dissipative scale length , the large scale turbulence scale , and the large scale velocity :
| (4) |
where is the large scale viscosity due to turbulence;
| (5) |
This leads to a relation between the two length scales and the turbulent Reynolds number
| (6) |
Consequently the turbulent large scale viscosity is given by
| (7) |
The macroscopic pressure due to the turbulence is given by
| (8) |
where is the overall density in the turbulent medium. We recall that, since there is only negligible energy loss during the energy transfer from large scales to small scales, the energy dissipation rate per unit mass for large structures is the same as that for small structures and is determined by the actual physical dissipation process in the smallest structures (heating and radiation). If we can identify this dissipative process in a given observed system, it should be possible to draw conclusions about the large-scale turbulence. In the next section we give a possible radiative dissipation mechanism in order to get an analytic expression for .
3.1 Energy dissipation by radiative cooling
The clouds in the CND are subject to partially inelastic collisions where they lose kinetic energy. During the collision the clouds’ gas is heated, radiating away its excess energy in the infrared lines of Oi, Cii, and excited H2 emerging from the hot outer layer of the cloud. During a collision a shock front is formed heating the gas in the interacting region to 1000 K. In a detailed model one has to account for this enhanced temperature within a small region. In order to treat the energy dissipation in our large-scale model we are not interested in the details of these non-stationary hot layers but in a smooth stationary dissipation rate over the whole disk. We therefore make the assumption that the time and space averaged dissipation rate in these hot layers can be approximated by the continuous infrared line emission of the smoothed large scale disk. This point will be further discussed in section 5.3.
At temperatures of 200 K and densities of several cm-3, which represent the averaged values of our disk model, the Oi and Cii line intensities are comparable (see e.g. Tielens & Hollenbach 1985). Here, we will only take into account the Cii line at 158 m, assuming that it is representative for the radiative dissipation of the turbulent energy in the disk.
The cooling function of the Cii line at 158 m is (Spitzer 1978)
| (9) |
where is the volume of the photodissociation region (PDR), is the disk temperature, the hydrogen density in the disk and is the fraction of atomic carbon abundance in the disk with respect to the solar one (). This is valid because at the given density ( cm-3) and at a temperature beyond 200 K the level populations are simply determined by their statistical weights (i.e. LTE) (Wolfire, Tielens, & Hollenbach 1990).
The radiative cooling takes place in the outer layers of the clouds, i.e. in the PDR, which represent only a small fraction of the whole cloud volume. In the large-scale model the ionized, atomic, and molecular phases are mixed. If the total cloud volume is , the modified cooling function is
| (10) |
where . is the mass of atomic gas located in the PDR, is its total mass, is the column density of atomic gas, and is the total column density of a cloud of diameter .
The column density of the PDR is determined by H2/CO self-shielding or dust absorption. As the C+/C/CO transition region is difficult to determine, we decided to use only a normalized value of the H/H2 transition region. For the self-shielding its value follows from the balance of formation and destruction of H2 (Burton, Hollenbach, & Tielens 1990).
| (11) |
where s-1 is the unshielded photodissociation rate, cm-1 is the selfshielding parameter, cm3 s-1 is the H2 formation rate coefficient, is the hydrogen density at the cloud surface, and is the FUV radiation field in units of the equivalent Habing (1968) flux of erg cm-2 s-1. This gives . The factor is determined by the condition that the self-shielding becomes the dominant process for cm-3 (Burton et al. 1990). For the dust absorption the column density is fixed by the UV optical depth . This corresponds to a constant column density of cm-2, resulting in . The total volume fraction of atomic gas is obtained by .
This leads to an energy dissipation rate per mass unit of
| (12) |
which can be used in the expression for the viscosity and the turbulent pressure derived above.
4 The detailed model
4.1 Partially ionized globules (PIG)
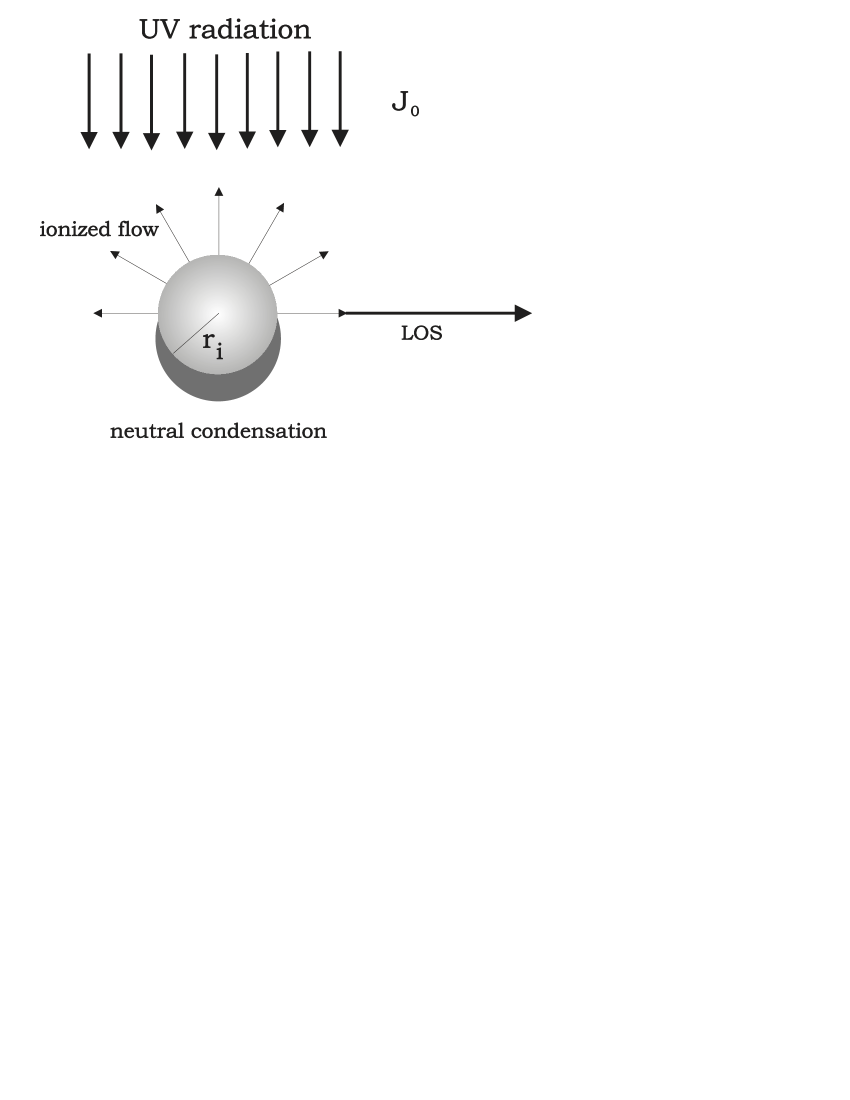
The clouds embedded in the Hii region Sgr A West and illuminated by the ambient radiation field are assumed to be spherically symmetric, isothermal, and selfgravitating. We follow the model of Dyson (1968). The incident UV radiation ionizes the outer rim and produces an ionization front. As only photons above 13.6 eV ionize the hydrogen atoms in the ionization front, the FUV field can penetrate further into the cloud. There, these photons cause the photodissociation of the H2 molecules. Both the ionization front and the dissociation front are governed by dust absorption and self-shielding effects. In addition, the PDR is preceded by a shock front. Thus, the cloud structure has three components, the inner molecular core, the predominantly atomic PDR and the outer ionization front. Here we are only interested in the ionization front, which is assumed to be quasi stationary and D-critical where the velocity of the shock front is approximately the neutral gas sound velocity squared divided by twice the ionized gas sound velocity (see e.g. Spitzer 1978). Due to the much higher temperature in the ionization front, the electrons are torn away from the cloud, giving rise to an effective mass loss. Across the front, the following jump conditions apply:
| (13) |
where is the gas velocity and is the isothermal sound speed. The index stands for the neutral, the index for the ionized gas component which is located directly in front of the ionization front. The outward electron flux is assumed to be isothermal and stationary because the ionization front moves very slowly into the cloud. The justification for all these assumptions is given in section 5.3. The solution for a spherically symmetric, stationary flux is given by
| (14) |
where and are the velocity and the number density at the distance from the cloud centre. The outer limit of the cloud is given by the location of the ionization front at . Fig. 2 illustrates this model.
In the ionization front the equilibrium between ionization and recombination is governed by the following equation:
| (15) |
where is the degree of hydrogen ionization, the hydrogen density, the number of incident UV photons per cm2 and s, the recombination coefficient, and the ionization cross section. The ionization cross section is calculated using the ‘on the spot’ approximation. It is only valid if the recombination time scale is much less than the kinematic timescale. This assumption is justified in section 5.3. is given by
| (16) |
where and are the optical depths of the gas and the dust along a radial line from an outer radius to an inner radius . The optical depth of the gas is:
| (17) |
The optical depth of the dust is:
| (18) |
where is the UV cross section of the dust per hydrogen nucleus. Differentiating equation 17 with respect to and substituting gives
| (19) |
Integrating this equation from to infinity and setting leads to
| (20) |
This is the final equation governing the radiation transfer in the ionization front.
Since the ionization front velocity is assumed to be small compared to the local sound velocity of the neutral gas, the isothermal neutral condensation is in a quasi-equilibrium state. Its structure is described by the Lane-Emden equation for isothermal spheres:
| (21) |
where is the cloud’s central density and is the gravitation constant. The radial density is given by
| (22) |
The jump conditions over the D-critical ionization front lead to the following expression for the gas pressure:
| (23) |
Since the density never drops to zero, an isolated isothermal sphere has no boundary. This changes with an external radiation field. The outer boundary is given by the location of the ionization front at the illuminated side and by the pressure of the surrounding ionized low density gas at the shadowed side. It should be mentioned here that clouds with are gravitationally unstable (Jeans unstable).
4.2 The disk model
The disk is assumed to be continuous and smooth. We follow Pringle (1981) for the disk equations, replacing the -viscosity prescription by the one described in section 3. Furthermore, the pressure due to the turbulent viscosity is added to the thermal pressure:
| (24) |
| (25) |
| (26) |
| (27) |
| (28) |
The disk parameters are the height , the surface density , the mass accretion rate , and the neutral gas temperature ; is the Boltzmann constant. Here is defined by the equation . The second term in equation (28) represents the turbulent pressure of the clouds . The radial mass distribution is given explicitly by , where M⊙ is the central mass component and describes the mass distribution of the stellar content. This is close to the findings of Eckart & Genzel (1996). In addition we assume that the central density of the disk in the continuous picture is linearly coupled to the central density of the clouds in the discrete picture, i.e. .
Finally we take into account that the clouds are illuminated from the centre. Therefore the ionization front exists only on the illuminated side. As described above, there is a flux of electrons away from the clouds. These electrons fill up the space between the clouds and thus build an intercloud medium which is the Sgr A West Hii region. Most of its mass is concentrated within the disk plane. Its pressure is responsible for the cloud boundary at the shadowed side. The electron density of the intercloud medium is calculated using and , where is the angular velocity of the clouds at a distance from the Galactic Centre.
4.3 The physical conditions
The radiation field in the Galactic Centre seems to be made by the central cluster of Hei stars (Genzel et al. 1996). In Fig. 3 we show the identified Hei stars together with the Neii data from Lacy at al. (1991).
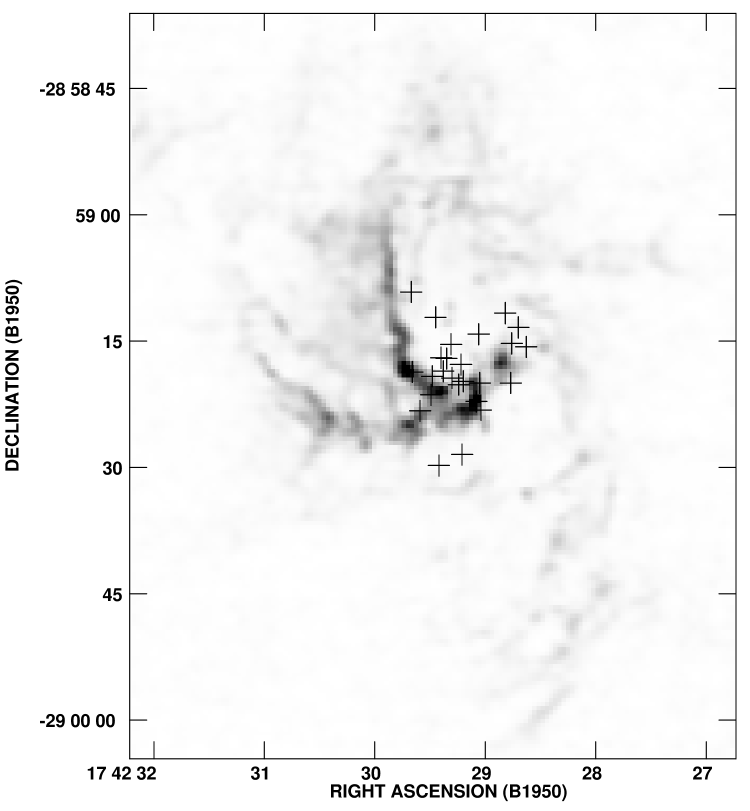
The clustering seen in Fig. 3 leads us to the assumption that the produced radiation field is approximately spherically symmetric and follows a -law. The Lyman continuum (Lyc-)photon production rate within 1 pc is s-1 (Mezger, Duschl, & Zylka 1996). Since it is assumed that this radiation is responsible for the heating of the clouds, the temperature follows a -law (for direct heating see Puget & Boulanger 1985). The absolute values of the temperature are in agreement with molecular excitation models (Sutton et al. 1990, Jackson et al. 1993). The FUV radiation field is (Wolfire et al. 1990) at 1 pc which is in excellent agreement with the Lyc-photon production rate if one assumes a black body temperature of 35 000 K for this radiation. The number of UV photons per cm2 and s and the gas temperature can be seen in Fig. 4.

The ambient Hii region has a constant temperature of =7000 K (Roberts & Goss 1993). The deduced isothermal sound speed in the ionized medium is cm s-1. The recombination coefficient for hydrogen atoms is cm3 s-1, the UV cross section per hydrogen nucleus is cm2. The Reynolds number is , the critical value for the onset of turbulence in laboratory experiments. For the factor between the disk’s central density and the clouds’ central density the observed volume filling factor is used: .
5 Results and verification of the assumptions
The problem which must be solved consists of a system of 6 non-linear equations (equations (20), (24)-(28)) together with the Lane-Emden equation (21). It is solved using a Newton-Raphson iteration. Given the non-linearity of the equations multiple solutions are possible. We solved the equations with the parameters given above starting the Newton-Raphson iteration from different initial values in order to recover all solutions. These solutions represent a stationary clumpy accretion disk which consists of distinct clouds.
It turns out that we can solve the system of equations exactly and that there are two different solutions for the radiation transfer with the clouds’ central density almost unchanged. We refer to the two different solutions as the heavy cloud and the light cloud solutions. Since the only parameter which is not a priori determined is the mass accretion rate, we varied this parameter in the range 10-6 M⊙ yr M⊙ yr-1. Higher values of give higher central densities and larger disk heights . The adopted value of M⊙ yr-1 is a compromise between a high leading to high central densities in order to resist the tidal shear and a low giving the observed small disk height. Both solutions describe stable gas clouds in the sense discussed in section 2.
5.1 The heavy clouds

Plot 5(a) shows the number densities of the neutral gas inside the cloud. The averaged density is plotted with a solid line, the central density with a dashed line, and the density at the cloud surface with a dotted line. It is remarkable that the central density has an almost constant value for distances greater than 3 pc and that there is more than a factor of 6 between the surface density and the central density. At a distance to the Galactic Centre of 2 pc the central density is about cm-3, corresponding very well to the value derived from HCN excitation models (Jackson et al. 1993), whereas the surface density has a value of cm-3. Since the gas in the PDR is hotter and therefore the gas density is expected to be lower than derived in this simple isothermal model, the value stated above corresponds well to the value derived from the [Oi] 63 m/[Cii] 158 m ratio and the H2 1-0/2-1 S(1) ratio (Burton et al. 1990, Wolfire et al. 1990) and from the low-J CO line emission (see e.g. Sutton et al. 1990). Thus, the HCN line emission originates in the dense cloud core, whereas the low-J CO and the H2 S(1) lines are emitted in the atomic/molecular transition region of the PDR.
Plot 5(b) shows the electron density at the cloud surface as a solid line and the electron density of the intercloud medium as a dashed line. The latter is in good agreement with the value derived from 19 and [Siii] 3 m line ratios (Erickson et al. 1994). The electron density at the surface lies exactly in the range given by Lo & Claussen (1983). We conclude that the radio continuum and line emission of high surface brightness at the inner edge of the CND originates in the cloud surfaces and the low brightness overall emission distribution corresponds to the low density intercloud medium. Both features form the Hii region Sgr A West.
Plot 5(c) shows the emission measure . It is in agreement with the value given by Beckert et al. (1996) based on the 15 GHz flux of Brown & Liszt (1984). The ratio between the column density of the atomic gas and the total column density (plot 5d) is determined by the dust absorption for distances smaller than 2 pc and by H2 self-shielding for larger distances. Estimating the atomic hydrogen column density at 2 pc gives a value of cm-2. The observed value (Liszt et al. 1983) is about twice this estimate. We observe a significant difference of the cloud radius 5(e) between the illuminated and the shadowed side. We can interpret them as upper and lower limits for the cloud radius.

The two graphs in plot 6(b) can be interpreted as upper and lower limits for the cloud mass, which lies in a range between 10 and 30 M⊙. The timescale for the mass loss (plot 6c) by the outward electron flux is about 108 yr for a cloud mass of 10 M⊙. The clouds are thus in a quasi stationary state. An important plot is the one showing the Lane-Emden parameter (plot 6d). The dashed line corresponds to the shadowed side, the solid line to the illuminated side. Interpreting these two lines again as upper and lower limits for the actual , we find a tendency that the clouds become gravitationally unstable for distances to the Galactic Centre of less than about 2 pc. In order to compare our findings with observations, we also plot the 30 m optical depth (plot 6e) where the absorption coefficient is taken from Draine (1985). This can be directly compared with the 30m measurements of Telesco et al. (1996), who measured an optical depth at 30m of 10-2 at the outer edge of the minispiral. This compares very well with the outcome of our model (Fig. 6e). The UV optical depth across the ionization front (plot 6f) tells us that the ionization front boundary is determined by atomic hydrogen self-shielding.
We now examine the solution for the averaged parameters of the disk model (Fig. 7).

The parameters shown are the column density (plot 7a), the disk height H (plot 7b), the disk’s central density (plot 7c), the central pressure (plot 7d), the velocity dispersion of the clouds (plot 7e), the disk flaring angle (plot 7f), the radial inward velocity (plot 7g), and the turbulent viscosity (plot 7h). Since these clouds are only found at distances larger than 2 pc, we will only comment on this part of the graphs. It is remarkable that the disk height fits well with the one deduced from observations (Güsten et al. 1987). The central density, which is assumed to be proportional to the central density of a cloud, stays approximately constant, which is a reasonable result. The velocity dispersion of the clouds lies in a range between 10 and 20 km s-1, compared to 30 km s-1 derived by the same authors. The accretion velocity is extremely low, which means that the clouds take a long time to approach the centre.
The viscosity used here is equivalent to an effective as used in the standard prescription . It has a nearly constant value of .
The cloud inflow time is given by Krolik & Begelman (1988) as
| (29) |
where we take the cloud collision rate derived at the end of this section. this leads to a mass accretion rate of . Assuming a total disk mass of M⊙ gives M⊙ yr-1. This value is in good agreement with the mass accretion rate used in our model.
5.2 The light clouds


Here the densities of the cloud centre (plot 8a), at the outer boundary and the mean density have the same value than that of the heavy clouds. The observed increase of the density with increasing distance might not be significant, whereas its increase with decreasing distance smaller than 1 pc is important because only denser clouds can resist tidal shear at smaller distances. The clouds are 100 times smaller (plot 8e) and 1000 times lighter (plot 9b) than the heavy ones. Thus, the light clouds have the appearance of stripped cores of the heavy clouds.
Their distribution shows a maximum of radius and mass at a distance of about 1 pc. The column density of atomic hydrogen (plot 8d) is determined everywhere by H2/CO self-shielding because of the high density at the outer boundary. The electron density at the illuminated boundary is 10 times higher than that of the heavy clouds (plot 8b), whereas the emission measure is comparable to that of the heavy clouds (plot 8c). They evaporate much faster ( yr at 2 pc) (plot 9c) and are gravitationally stable () (plot 9d).
These clouds might account for the high-J CO lines which require a density close to 107 cm-3 in the atomic/molecular transition region (Burton et al. 1990).
5.3 Verification of the assumptions
In this section we show that our model assumptions are valid for the light and heavy clouds. We only discuss the results for the heavy clouds because they contain most of the mass of the CND.
As described above, the outer layer of the cloud has three different regions. The ionization front, caused by UV photons with energies above 13.6 eV, is located outside, followed by the PDR whose origin is the FUV radiation field, followed by a shock front due to the higher temperature and therefore higher pressure in the PDR. The cloud can only be assumed to be stationary if the velocity of the shock front and the velocity of the ionization front are much smaller than the sound velocity within the cloud. In this case they do not affect the clouds’ overall structure. (Dyson 1968). The velocity of the shock front is given by (Bertoldi & Draine 1996)
| (30) |
where is the ‘Strömgren number’, R the distance to the Galactic Centre, and is the UV optical depth. The velocity of the ionization front can be obtained by where is the cloud mass and . Fig. 10 shows these velocities together with the sound velocity in the neutral gas.

The sound velocity is always a factor 10 larger than that of the shock front and the ionization front velocity. Thus, the assumption of a quasi-stationary equilibrium is justified. In addition, it should be noticed that the velocity of the shock front is larger than that of the ionization front.
The assumption of an isothermal ionization front only holds if the characteristic cooling length is small against the depth of the ionized layer. The characteristic cooling time in the Hii region outside the cloud is s. With a typical electron density of cm-3 we obtain a typical cooling length of cm. This is times the cloud radius. If the ionization front has a depth of A (Tielens & Hollenbach 1985), its extent is times the cloud radius.
The assumption of an ionization-recombination equilibrium is only valid if the timescale of the recombination is small against the kinematic timescale. The recombination timescale at 7000 K is given by Spitzer (1978): s. With the same electron density used above one obtains s. The kinematic timescale is approximately given by which gives a value of s.
Furthermore, we must check if the collisional timescale is much smaller than the crossing time for a sound wave (thermal timescale). Only in this case does the cloud have enough time to reach the quasi-equilibrium state. The thermal timescale is given by . For the collisional timescale we choose the expression (Pringle 1981). In this case it is assumed that the collisional timescale is larger than the orbital timescale (Shlosman et al. 1990) and the disk can be treated in analogy to the Saturn’s rings (Goldreich & Tremaine 1978). As the CND has a volume filling factor of 0.01 we think that this assumption is justified. Nevertheless, it has to be proven by dynamical models, which is beyond the scope of this paper. Such a numerical model, which will be discussed in a following paper, seems to agree with this assumption. The different timescales are shown in Fig. 11.

Clearly, the collisional timescale is much larger than the thermal one. It is remarkable how large this timescale is. In this scenario there is only one collision every 104 yr in the whole isolated CND.
We made the assumption that the time and space averaged dissipation rate in the hot, layers during a cloud–cloud collision can be approximated by the Cii line emission of the smoothed large scale disk. In the hot partially ionized layer which is formed during a cloud–cloud collision the gas has a density cm-3 and is heated to a temperature of 1000 K. Under these conditions the Oi, Cii, and H2 lines are mainly responsible for the cooling of the gas. The total cooling rate in this layer is approximately erg cm-3 s-1 (Tielens & Hollenbach 1985). The Cii cooling rate of our smooth model disk is erg cm-3 s-1. We now have to account for the transient character of the hot layer. Its lifetime can be approximated by the thermal timescale of the cloud compared to the timescale between two collisions. The transient and continuous cooling rates are thus connected in the following way:
| (31) |
Fig. 11 shows that . This justifys our assumption.
6 Tidal forces
The clouds in the vicinity of the Galactic Centre are exposed to strong tidal forces which tend to disrupt the clouds, except if self-gravity is effective against tidal shear. The tidal (Roche) limit for the cloud mass is given by (Mathews & Murray 1987)
| (32) |
where , the cloud radius, and is the cloud’s distance to the Galactic Centre. We have calculated the cloud tidal radius analytically. For the heavy clouds it is compared to the cloud radii at the illuminated and the shadowed side (Fig. 12).

The tidal radius is smaller than the radius determined by the UV radiation field at distances less than 2.5 pc and smaller than the radius of the shadowed side at distances less than 3.5 pc.
We have also calculated the cloud tidal radius analytically for the light clouds. It is compared to the cloud radii at the illuminated and the shadowed side in Fig. 13.

These very small clouds are stable against tidal shear for distances from the Galactic Centre greater than 1.5 pc. Comparing the gravitational collapse time to the orbital period at a distance of =1 pc from the Galactic Centre yields:
| (33) |
where is the gas density of the cloud and is the orbital velocity of the cloud. Thus, these self-gravitating light clouds will be stretched out along their orbital path by an amount comparable to their initial radial extent within about one orbital period.
7 The mass accretion rate
Güsten et al. (1987) have derived a mass accretion rate of the clouds in the CND of M⊙ yr-1. They assumed that the total luminosity in the infrared and submm-lines comes entirely from the dissipation of the turbulent motions.
We suggest that if the turbulent energy dissipation is due to the infrared line emission (for which we have used the Cii line as representative), it should not exceed several percent of the whole infrared line emission due to the PDRs. The total luminosity in the infrared and submm-lines (PDR) is L=2L⊙ (Genzel 1989). The emitted luminosity of the Cii-line in our model represents 10% of the total luminosity. This is consistent with the radiative dissipation rate given by Genzel et al. (1985)
| (34) |
where is the fraction of kinetic energy converted into radiation via shocks, is the mass of the CND, and is its velocity dispersion. We stress here that is the mean collision time for all clouds in the CND in order to recover the total luminosity due to radiative energy dissipation.
8 Conclusions
We have constructed an analytic model for the CND. It mainly consists of 500 heavy clouds moving around the Galactic Centre building a disk-like structure. The spatial structure of the cloud ensemble is described by a smooth continuous disk whose viscosity is due to partially inelastic cloud–cloud collisions. This work represents a first attempt to model a clumped disk analytically including a simple UV radiation transfer. The input parameters () are set to observed quantities. At the chosen Reynolds number turbulence sets in laboratory experiments. The real unknown and therefore free parameter is the mass accretion rate of the disk. The independent resulting parameters () are in excellent agreement with observations at multiple wavelengths.
There are two solutions for our set of equations that correspond to two stable clump regimes:
-
1.
the observed heavy molecular clouds with masses of 10 M⊙ and sizes of 0.1 pc,
-
2.
the stripped cores of the heavy clouds with masses between 10-5 to 10-4 M⊙ and sizes of pc.
It will be of importance to find out whether—in our Galactic Center and/or the centers of other galaxies—the light cloud population plays a role.
Within the disk, the number of collisions between clouds is very low ( yr-1 for about 500 clouds). We infer a mass accretion rate for the isolated CND of M⊙ yr-1. We conclude that the CND is much more stable and has a much longer lifetime ( yr) than previously assumed.
In the present discussion we have focussed on the investigation of the two stable regimes of clouds (heavy and light). For a more complete model of the CND, however, several aspects need to be adressed additionally, including:
-
•
The influence of tidal forces and internal rotation of the clouds on their stability. While tidal forces tend to disrupt the clouds, the role of rotation is not so clear, since rotation may easily lead to modifications of the cloud structure and thus to clouds that are more or less stable than the non-rotating ones. The interplay between gravity, tidal forces, rotation, and the presence of a point-like central mass distribution (i.e., the central black hole) may explain why the CND seems to be almost empty of material in its inner pc.
-
•
The connection between the structure and dynamics of the gaseous material in the CND and the stellar component in the immediate vicinity of the central black hole.
Acknowledgements.
This work was supported by the Deutsche Forschungsgemeinschaft (DFG) through Sonderforschungsbereich (SFB) 328 “Evolution of Galaxies” at the University of Heidelberg. The authors thank an anonymous referee for helping to improve the presentation of the results presented in this paper.References
- (1) Beckert T.,Duschl W.J., Mezger P.G., Zylka R., 1996, A&A 307, 450
- (2) Becklin E.E., Gatley I., Werner M.W., 1982, ApJ 258, 135
- (3) Bertoldi F., Draine B.T., 1996, ApJ 458, 222
- (4) Brown R.L., Liszt H.S., 1984, ARA&A 22, 223
- (5) Burton M.G., Hollenbach D.J., Tielens A.G.G.M., 1990, ApJ 365, 620
- (6) Davidson J.A., Werner M.W., Wu X. et al., 1992, ApJ 387, 189
- (7) Dent W.R.F., Matthews H.E., Wade R., Duncan W.D., 1993, ApJ 410, 650
- (8) DePoy D.L., Gatley I., McLean I.S., 1989, IAU-Symp. 136, 361
- (9) Draine B.T., 1985, ApJS 57, 587
- (10) Dyson J.E., 1968, ApSS 1, 388
- (11) Eckart A., Genzel R., 1996, Nature 383, 415
- (12) Erickson E.F., Colgan S.W.J., Simpson J.P., Rubin R.H., Hass M.R., 194, in: Genzel and Harris (1994), 249
- (13) Gatley I., Jones J.J., Hyland A.R. et al., 1986, MNRAS 222, 299
- (14) Genzel R., 1989, IAU-Symp. 136, 393
- (15) Genzel R., Watson D.M., Crawford M.K., Townes C.H., 1985, ApJ 297, 766
- (16) Genzel R., Harris A.I. (eds.), 1994, The nuclei of normal galaxies - Lessons from the Galactic Center; (Dordrecht: Kluwer)
- (17) Genzel R., Thatte N., Krabbe A. et al., 1996, ApJ 472, 153
- (18) Goldreich P., Tremaine S.D., 1978, Icar, 34, 227
- (19) Güsten R., Genzel R., Wright M.C.H. et al., 1987, ApJ 318, 124
- (20) Habing H.J., 1968, Bull. Astr. Inst. Netherlands, 19, 421
- (21) Hildebrand R.H., Davidson J.A., Dotson J. et al., 1993, ApJ 417, 565
- (22) Jackson J.M., Geis N., Genzel R. et al., 1993, ApJ 402, 173
- (23) Krolik J.H., Begelman M.C., 1988, ApJ 329, 702
- (24) Lacy J.H., Achtermann J.M., Serabyn E., 1991, ApJ 380, L71
- (25) Lacy J.H., 1994, in: Genzel and Harris (1994), 165
- (26) Landau L.D., Lifschitz E.M., 1959, Fluid Mechanics
- (27) Liszt H.S., van der Hulst J.M., Burton W.B., Ondrechen M.P., 1983, Astr.Ap. 126, 341
- (28) Lo K.Y., Claussen M.J., 1983, Nature 306, 647
- (29) Lutgen J.B., Genzel R., Crawford M.K., Townes C.H., 1986, ApJ 306, 691
- (30) Marshall J., Lasenby A., 194, in: Genzel and Harris (1994), 175
- (31) Marr J.M., Wright M.C.H., Backer D.C., 1993, ApJ 411, 667
- (32) Mathews W.G., Murray S.D., 1987, ApJ, 312, 66
- (33) Mezger P.G., Zylka R., Salter C.J. et al., 1989, A&A 209, 337
- (34) Mezger P.G., Duschl W.J., Zylka R., 1996, ARA&A 7, 289
- (35) Ozernoy L.M., Fridman A.M., Biermann P.L., 1998, A&A, 337, 105
- (36) Pringle J.E., 1981, ARA&A 19, 137
- (37) Puget J.L., Leger A., Boulanger F., 1985, A&A 246, 551
- (38) Roberts D.A., Goss W.M., 1993, ApJS 86, 133
- (39) Serabyn E., Güsten R., Walmsley C.M. et al., 1986, A&A 169, 85
- (40) Shlosman I., Begelman M.C., 1987, Nature 329, 810
- (41) Shlosman I., Begelman M.C., Frank J., 1990, Nature 345, 679
- (42) Spitzer L., 1978, Physical Processes in the Interstellar Medium
- (43) Sutton E.C., Danchi W.C., Jaminet P.A., Masson C.R., 1990, ApJ 348, 503
- (44) Telesco C.M., Davidson J.A., Werner M.W., 1996, ApJ 456, 541
- (45) Tielens A.G.G.M., Hollenbach D.J., 1985, ApJ 291, 722
- (46) Vollmer B., Duschl W.J., 2000, NA, 4, 581
- (47) Wardle M., Königl A., 1990, ApJ, 362, 120
- (48) Wardle M., Königl A., 1993, ApJ, 410, 218
- (49) Wolfire M.G., Tielens A.G.G.M., Hollenbach D.J., 1990, ApJ 358, 116