Cold H2O and CO ice and gas toward the Galactic Center1
Abstract
We present observations of CO, 13CO and of H2O in the middle and far-infrared taken with the ISO-SWS and ISO-LWS spectrometers toward two positions in the Galactic Center region (Sgr A∗ and GCS-3). Both ice and gas phase molecules are detected. The ISO data have been complemented with observations of the J=3-2 and J=7-6 lines of CO carried out at the Caltech Submillimeter Observatory. The ISO and CSO data indicate that the absorbing gas is extremely cold, T K, suggesting that it is located in the dark clouds of the different spiral arms that intersect the line of sight towards the Galactic Center. From the analysis of the CO absorption we derive 13CO gas phase column densities of 1.1 and towards Sgr A∗ and GCS-3 respectively. The H2O gas column density in the direction of Sgr A∗ is . The derived CO/ and gas/solid abundance ratios corresponding to these cold clouds are remarkably similar along the two lines of sight. We find that nearly all the CO is in the gas phase, while the is almost entirely frozen onto the surfaces of cold dust grains. Finally, the Ngas+ice(CO)/Ngas+ice(H2O) abundance ratio is implying that H2O formation processes are highly efficient.
CSIC, IEM, Dpto. Física Molecular, Serrano 121, E-28006
Madrid, Spain.
e-mail: amoneti@astro.iem.csic.es
CSIC, IEM, Dpto. Física Molecular, Serrano 121, E-28006
Madrid, Spain.
Division of Physics, Mathematics and Astronomy, California Institute
of Technology,
MS 320-47, Pasadena, CA 91125, USA
e-mail: cerni@astro.iem.csic.es
Division of Physics, Mathematics and Astronomy, California Institute
of Technology,
MS 320-47, Pasadena, CA 91125, USA
e-mail: pardo@submm.caltech.edu
Subject headings: ISM: molecules, abundances, individual (Sgr A∗, GSC-3) — Infrared : ISM lines and bands
1 Introduction
The water molecule plays an important role in the chemistry of interstellar and circumstellar clouds. However, due to its high abundance in the terrestrial atmosphere, its rotational, vibrational, and electronic transitions of the main isotopic species are mostly hidden from view from ground-based telescopes (except for some weak rotational lines, see Cernicharo et al. 1990, 1994). It was only with the advent of the Infrared Space Observatory (ISO, Kessler et al., 1999) that extensive observations of the far-infrared thermal lines of water vapor could be used to obtain reliable estimates of the water vapor abundance in molecular clouds. Mapping of the Sgr B2 molecular cloud with ISO by Cernicharo et al. (1997a) has definitely shown that H2O is a ubiquitous molecule in the cores of warm molecular clouds with an abundance of . In addition, maps of the emission of several H2O lines in Orion IRc2 have been obtained by Cernicharo et al. (1997b, 1999) showing that the abundance of H2O is close to 10-4 in the shocked gas. H2O observations of the central position of Orion have been also obtained by van Dishoeck et al. (1998), González-Alfonso et al. (1998) and Harwit et al. (1998). All these new data refer to the warm regions of molecular clouds. While there is also strong evidence for a high water depletion onto the ice mantles of dust grains in the coldest regions, no water vapor has been detected in the direction of dark clouds, probably due to the low temperature and density prevailing in these objects.
In order to study the coldest and least disturbed regions of molecular clouds, we have examined the ISO archive spectra of two positions in the Galactic Center, where absorption from the intervening medium is known to occur (Geballe, Baas, and Wade 1989, Lutz et al. 1996, Okuda et al. 1990). In the case of Sgr A∗, this cold gas is also seen in the form of sharp and deep absorption features at 0, , and in various millimeter transitions of and CO against the broad background produced by the warm clouds in Sgr A West (Serabyn and Güsten 1986, Sutton et al. 1990). These data, together with submillimeter observations of the J=3-2 and J=7-6 lines of CO, have been modeled to place constraints on the abundances of these molecules in both the gas and the solid phase.
2 Observations
All data were obtained with the ISO Short and Long Wavelength Spectrometers (SWS, de Graauw et al. 1999; LWS, Clegg et al., 1999) using the full resolution grating mode of the SWS (–2000) and the grating and Fabry Perot (FP) modes of the LWS ( and 9000 respectively). The effective SWS aperture in the 4– range is about , while the LWS aperture is circular and in diameter. In the case of GCS-3, the aperture was centered on GCS-3 I, though the brightest source in the aperture at is GCS-3 II (Moneti et al. 1999). The aperture centered on Sgr A∗ also includes several point-like and diffuse sources. OLP 7.1 archive data were further processed with the ISAP package111ISAP is a joint development of the LWS and SWS instrument teams and data cent-res. Contributing institutes are CNRS, IAS, IPAC, MPE, RAL, and SRON.. The results are shown in Figures 1, 2 and 3. In order to resolve the velocity structure of the absorbing/emitting gas in the direction of Sgr A∗ we have made observations of the J=3-2 and J=7-6 lines of CO in the direction of this source with the CSO telescope. These observations were made in position switching, with the off position 4 degrees outside the galactic plane. A region of 10x6 arcminutes was mapped in the J=3-2 line of CO and a few positions were observed in the J=7-6 line of the same species. The system temperatures at the frequencies of the J=3-2 and J=7-6 lines of CO were 760 and 6000 K respectively and the spectral resolution was 0.5 MHz. The results for the central position of our maps, Sgr A∗, are shown in Figure 3.
3 Results and Discussion
In order to determine the physical conditions of the foreground cold gas from the ISO H2O and CO data, we have used an ETL model with line parameters from the HITRAN molecular database (Rothman et al., 1993) to find the best fit to the line absorption. We note, however, that the energies of all ortho levels of H2O are referred in HITRAN to the ground state of para-H2O, i.e., the energy of the ground state of ortho-H2O is not set equal to zero. For very low rotational temperatures the derived physical parameters will have a large error if the HITRAN values of the energies and line intensities (which include a Boltzmann factor) are not corrected.
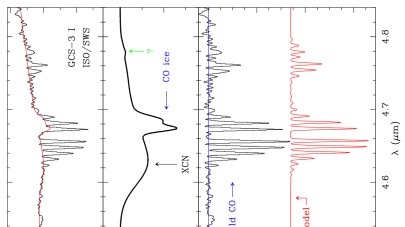
The J=7-6 line of CO shows emission over a broad velocity range (see Figure 3). The shape of this broad emission changes smoothly with position. This gas is certainly warm and emits in high-J lines of CO as shown in the LWS grating data of Sgr A∗ (see inset panel in Figure 3b). The J=3-2 line shows several narrow features in absorption against the broad component arising in the vicinity of Sgr A∗. These narrow absorptions (see Figure 3), at velocities of 0, -30 and -50 km-1 have been also seen in many other molecular and atomic species, and do correspond to cold gas in the line of sight which produces the series of R and P lines up to J=7 in the ro-vibrational band of CO (see Figure 1). Mapping with the CSO of both CO lines indicates that the absorption features are present in all positions where the broad emission is seen. These absorptions appear in all observed positions (10x6 arcminutes). Hence, both broad emission and narrow lines fill the ISO LWS and SWS beams. Consequently, prior to the analysis of the ro-vibrational absorption, the broad components due to the ices and, in the case of Sgr A∗ to the warm CO gas in the Sgr A West region (Sutton et al. 1990), had to be analyzed and removed. In the following discussion we will assume and 12CO (Langer and Wilson 1990).
3.1 Modeling the Warm CO Gas in Sgr A West
This warm component is clearly visible in Figure 1 and 3 (high-J CO lines; inset panel in Figure 3b). The CO ro-vibrational data (SWS) have been modeled by a single component with K, , and . The assumed linewidth is suggested by our J=7-6 line data and by the LWS Fabry Perot (LWS-FP) observations of some CO lines (not shown here). The LWS-grating data toward Sgr A∗ show CO pure rotational line emission from the –13 up to the –20 transitions (some of them are shown in the inset panel of Figure 3b). Assuming that the emission fills the beam, and using a large velocity gradient code and the collisional rates of Schinke et al. (1985), the observed intensities are reproduced, within 20–30%, for , TK, with the assumed linewidth. The corresponding excitation temperatures vary between 160 to 180 K from the –13 to the –20 rotational lines of CO, i.e., similar to the rotation temperature derived from the SWS ro-vibrational absorption of CO. Note that the region is rather complex and that the column density we derive represents a beam averaged value. Column densities for individual clouds could be larger and have to be derived using the corresponding filling factor and the correct linewidths. The values for n(H2) and TK are in excellent agreement with those derived by Sutton et al. (1990) for the individual warm clouds. The region of GCS-3 is free of molecular emission (Serabyn and Güsten 1991), and thus no such warm gas was used in the GCS-3 model.
3.2 The CO and H2O ices
The CO, XCN, and ices shown in our spectra are among those that are commonly found in the direction of young sources deeply embedded in molecular clouds. The CO and XCN ice absorption bands were modeled as simple Gaussians; two Gaussians of different widths and central wavelengths were used for the polar and non-polar CO ices (Chiar et al. 1998). The main goal of this fitting was to remove the CO-ice contribution from the continuum, nevertheless we could derive CO-ice and for Sgr A∗ and GCS-3, respectively, with apolar in Sgr A∗, and apolar in GCS-3. Our value of (CO-ice) in Sgr A∗ is twice that derived by McFadzean et al. (1989) from lower resolution spectroscopy. As for the ice, Chiar et al. (2000) used the same SWS data discussed here, but considered both the and the water ice features to determine (H2O-ice and for Sgr A∗ and GCS-3, respectively.
The high fraction of apolar CO-ice and the high (CO)/() ratios, together with the deep absorption of CO2 ice (Whittet et al. 1997), are typical of cold, quiescent environments (Chiar et al. 1998), indicating that these ices cannot be located in the warm clouds in Sgr A West.
3.3 The cold CO gas
Due to the heavy saturation of the ro-vibrational lines (opacities of about 20–30), the physical parameters of the cold CO gas were determined from the and the adopted isotopic abundance ratio. Three components at the velocities indicated by the J=3-2 absorption features in Figure 3 were used in the model, with linewidths as measured in our data. These linewidths agree well with the results shown in Figure 1 of Sutton et al. (1990). The derived model parameters (column density and rotation temperature) are the same for the three components. Model results can be found in Table 1. A single velocity component was introduced in order to fit the weak line of this isotope. We also find that in both lines of sight the cold gas alone is not sufficient to reproduce completely the absorption, and a component of higher kinetic temperature, K, and of the total, is necessary to account for the highest observed lines. This component cannot arise from an incomplete removal of the warm gas in Sgr A West, since it is present in both spectra, and should correspond to dense cloud material () of low CO column density. We estimate uncertainties of about a factor of 2 in the column densities. The volume density needed to pump the observed rotational levels of the CO ground state is around in the case of K (Sgr A∗), decreasing to at K (GSC-3). Adopting , the cold CO column densities imply visual extinction of 33 and 21 mag towards Sgr A∗ and GCS-3, respectively, generally consistent with values in the literature.
: Model results (T in K, N in )
| Quantity | Sgr A∗ | GCS-3 |
|---|---|---|
| warm gas | ||
| TK(CO & ) | 250 | |
| Trot(CO) | 150 | |
| N(12CO) | ||
| N(H2O) | ||
| cold gas | ||
| Trot(CO) | 6–12 | 5–10 |
| Trot() | 8 | |
| N(12CO) | ||
| N(13CO) | ||
| N(C18O) | ||
| N(H2O) | ||
3.4 The cold/warm H2O gas
In contrast to CO, the absorption at 6 m is weak: 3% () in Sgr A∗, and 2% () in GCS-3 (not shown). The three features detected are the 000—111 (para), and the 101—110 and 101—212 (ortho) lines of the vibrational transition of water vapor (see Figure 1f). In the Sgr A∗ data, the para transition is blended with the H2 (0,0) S(6) line, which was removed by assuming an intensity of the average of the S(5) and S(7) lines. The para line of H2O is present before the subtraction of the S(6) line of H2, however, its intensity is poorly determined. Features B & C in Figure 1f are ortho-H2O while A corresponds to para-H2O. Figure 1g shows the H2O levels involved in these transitions. All three absorption features arise from the ground para and ortho states to the first excited rotational levels of the bending mode of water vapor. The lack of other H2O absorption features indicates that all the water molecules are in the ground state (ortho and para). An ortho/para abundance ratio of 3 has been assumed.
The best fit to the H2O absorption, assuming also the three velocity components of CO, is obtained for K, similar to the temperatures deduced from CO. While these lines are not very sensitive to temperature in the 3–12 K range, an upper limit K is obtained from the lack of absorption from the 110 ortho level which is 26.7 K above the ortho ground state (absorption from other levels of para water is more difficult as the first excited level, the 111, is 53.4 K above the para ground state). The ro-vibrational line opacities are 1 and for the ortho and para species, respectively. The column density of H2O is with little dependence on the assumed . This is due to the fact that line opacity and spectral dilution effects have inverse dependency on v for optically thin ( below 1) lines.
The fact that the rotation temperature is low does not mean that the kinetic temperature is also low. While in the case of CO the inferred densities are high enough to make , the same is not true for . In order to determine what fraction of the absorbing H2O belongs to which temperature component, we used the LWS-FP spectrum of the 101—212 pure rotational line of o-H2O (in the level) towards Sgr A∗ (see Figure 3b). It indicates that the absorption arises from three different unresolved velocity components at –20, 5 and . The 110—221 line, on the other hand, only shows significant absorption at . This cloud is probably the one associated to Sgr A itself and as for Sgr B2 (Cernicharo et al., 1997) the analysis of the water vapor data is much more difficult due to the role of dust emission/absorption in the excitation of this molecule. Taking into account the absolute velocity accuracy of the LWS-FP, the –20 and features could correspond to the cold NH3 (Serabyn and Güsten 1986) and CO J=3-2 (see Figure 3a). The CO absorption at -50 kms-1 is marginal in the LWS-FP data of H2O. For the physical conditions of the cold gas, a minimum opacity of with is needed to produce the observed absorption. It corresponds to . However, with this column density the contribution of the cold H2O to the ro-vibrational absorption (SWS) will be negligible. Can we derive more precisely this column density? An answer can come from the different opacities of the pure rotational and ro-vibrational lines of H2O.
The line profiles of the water transitions differ remarkably from those of the CO lines observed with the CSO telescope (see Figure 3a) and also with the LWS-FP instrument (data not presented here). The warm gas in Sgr A West could also produce a broad H2O absorption, and such absorption would appear as a baseline effect in the reduced velocity coverage of the LWS-FP spectra. Such a baseline has been removed from our data but it is not possible to infer the possible contribution of the warm gas from these data. The grating data (see inset in Figure 3b), however, show an absorption feature 13% deep at the wavelength of the — line (and very weak absorption is also found for the — line), which would require the absorption produced by the narrow lines of Figure 3b. Therefore, most of the absorption found in the grating spectrum must correspond to a broad velocity component badly detected with the LWS/FP. This broad absorption is also found in the 20 positions observed with the LWS grating spectrometer around Sgr A∗.
The grating data suggest a line opacity for a linewidth of . From the physical conditions we have derived for the warm gas, the — line opacity will be if . Hence, the H2O abundance in the warm gas is , similar to that found in the warm foreground gas of Sgr B2 (Cernicharo et al. 1997a, Neufeld et al. 2000). However, this column density that explains well the absorption excess in the LWS grating data is insufficient to explain the SWS absorption. Hence, we have to assume that the cold gas must have a larger column density to account for the SWS data.
Removing the contribution from the warm gas, the total column density of cold H2O must be (three velocity components). The opacity and excitation temperature of the 101—212 rotational line will be and 7 K, respectively, for each one of the three velocity components assumed in our models. For GSC-3 we obtain a cold H2O column density of . These results suggest that the lines of sight intersect dense dark clouds where most of the absorption is produced. The /H2O abundance ratio would be in both cases, i.e, . Hence, and the water vapor gas/solid ratio is in the quiescent regions of dark clouds along the line of sight to the Galactic Center.
The water vapor abundance in the dark clouds intersecting the line of sight of Sgr A∗ is much lower than that in the core of Sgr B2 and the shocked regions of Orion (see introduction). However, the total gas+ice CO/H2O abundance ratio is . This result means that a large fraction of the molecules is condensed on grains in these cold, quiescent regions but also that the chemical mechanisms leading to its formation (either in gas phase or in the grain surface) are very efficient and make H2O the most abundant molecular species after CO.
The ISO data corresponding to the pure rotational lines of H2O towards Sgr A∗ alone provide a lower limit for the water abundance of . However, when combining these data with the ro-vibrational H2O lines also observed by ISO a larger abundance, 10-7, is found. With this abundance, the pure 212—101 and 110—101 rotational lines of H2O in the ground vibrational state will be extremely optically thick (see above), but the expected emission from these lines will remain very low. The upper limit to the water abundance derived through emission measurements by SWAS in the direction of TMC1 (, Snell et al. 2000) is only of factor of 4 lower than the value we derive in the dark clouds towards Sgr A∗. If we consider that in dark clouds important scattering effects have to be taken into account in the radiative transfer of optically thick lines (see Cernicharo and Guélin, 1987), the upper limit derived by SWAS could be slightly underestimated. Therefore, our results for Galactic dark clouds towards Sgr A∗ and SWAS results for TMC1 would be in a relatively good agreement. Finally, absorption measurements towards continuum background sources at 556.9 GHz (101—110), and at 179.526 and (—212 and —111) with future satellite missions such as FIRST, will provide a very efficient way to derive the water vapor abundance in dark clouds and in the diffuse interstellar medium.
We thank Spanish DGES for this research under grants PB96-0883 and ESP98-1351E. We thank E. González-Alfonso for useful comments. The CSO is supported by American NSF grant number AST-9980846.
REFERENCES
Clegg P.E., et al., 1996, A&A, 315, L38
Cernicharo J., Guélin M., 1987, A.&A., 176, 299
Cernicharo J., Thum C., Hein H., et al., 1990, A.&A., 231, L15
Cernicharo J., González-Alfonso E., Alcolea J., et al., 1994, ApJ, 432, L59
Cernicharo, J., Lim, T., Cox, et al., 1997a, A&A, 323, L25
Cernicharo, J., González-Alfonso, E., Lefloch, B., 1997b, in “First Workshop on Analytical Spectroscopy”, 6-8 October 1997a. ESA SP-419, page 23
Cernicharo, J. et al. 1999, in the ESA Symposium on “The Universe as seen by ISO”, P. Cox and M. Kessler, eds., ESA-SP 427, p. 565
Chiar, J.E., Geriakines, P.A., Whittet, D.C.B., Pendelton, Y.J., Tielens, A.G.G.M., Adamson, A.J, and Boogert, A.C.A., 2000, ApJ, 498, 716
Chiar, J.E., Tielens, A.G.G.M., Whittet, D.C.B., Shutte, W.A., Boogert, A.C.A., Lutz, D., van Dishoeck, E.F., Bernstein, M.P., 2000, ApJ, 537, 749
de Graauw, T., 1999, in “The Universe as seen by ISO”, P. Cox and M. Kessler, eds., ESA-SP427, p. 31
Geballe, T.R., Baas, F., and Wade, R., 1989, A&A, 208, 255
González-Alfonso, E., Cernicharo, J., van Dishoeck, E.F., et al., 1998, ApJ, 502, L169
Harwit, M., Neufeld, D.A., Melnick, G.J., Kaufman, M.J. 1998, ApJ, 497, L105
Kessler, M.F., 1999, in “The Universe as seen by ISO”, P. Cox and M. Kessler, eds., ESA-SP427, p. 23
Langer, W.D., and Wilson, A.A., 1990, ApJ, 357, 277
Lutz, D., Feuchtgruber, H., Genzel, R., et al., 1996, A&A, 315, L269
McFadzean, A.D., Whittet, D.C.B., Longmore, A.J., Bode, M.F., and Adamson, A.J. 1989, MNRAS, 241, 873
Moneti, A., Blommaert, J.A.D.L., Najarro, F., et al., 1999, in “The Universe as seen by ISO”, P. Cox and M. Kessler, eds., ESA-SP427, p. 723
Neufeld et al., 2000, ApJ, 539/2, L111-113.
Okuda, H., Shibai, H., Nagakawa, T., Matsuhara, H., Kobayashi, Y., Nagata, T., Gatley, I., and Geballe, T.R. 1990, ApJ, 351, 89.
Rothman, L.S., Gamache, R.R., Tipping, R.H., et al., 1993, J. Quant. Spectrosc. Radiat. Transfer, 48, 469.
Schinke, R., Engel V., Buck U., et al., ApJ, 299, 939
Serabyn, E., and Güsten, R., 1986, A&A, 161, 334
Serabyn, E., and Güsten, R., 1991, A&A, 242, 376
Snell, R. L., Howe, J. E., Ashby, M. L. N., et al. 2000, ApJ, 539/2, L101-105.
Sutton, E.C., Danchi, W.C., Jaminet, P.A., and Masson, C.R., 1990, ApJ, 348, 503
van Dishoeck, E.F., Wright, C.M., Cernicharo, J., et al., 1998, ApJ, 502, L173
Whittet, D.C.B., Boogert, A.C.A., Geriakines, P.A., Schutte, W.A., Tielens, A.G.G.M., de Graauw, T., Prusti, T., van Dishoeck, E.F., Wasselius, P.R., and Wright, C.M., 1997, ApJ, 490, 729