A census with ROSAT of low-luminosity X-ray sources in globular clusters
Abstract
I analyze 101 observations from the ROSAT archive to search for X-ray sources in or near 55 globular clusters. New sources are found in the cores of NGC 362 (a double source), NGC 6121 (marginally significant), NGC 6139, and NGC 6266; and outside the cores of NGC 6205, NGC 6352 and NGC 6388. More accurate positions are determined for the X-ray sources in some ten clusters. The improved position for the source in NGC 6341 excludes the suggested ultraviolet counterpart. It is shown that one of the two sources reported near the core NGC 6626 is spurious, as is the detection of a pulsar period in the PSPC data of this cluster; the central source is resolved in three sources. One source reported previously in NGC 6304 is demoted to an upper limit. For 20 cluster cores better upper limits to the X-ray luminosity are obtained.
From a statistical analysis I argue that several sources outside the cluster cores may well belong to the clusters. All spectral energy distributions observed so far are relatively soft, with bremsstrahlung temperatures keV; there is evidence however that bremsstrahlung spectra do not correctly describe the spectra. The X-ray luminosity per unit mass for the cluster as a whole does not depend on the concentration; the luminosity per unit mass for the core may increase with the cluster concentration.
Key Words.:
globular clusters: – X-rays: stars1 Introduction
There are a few hundred bright X-ray sources in the whole sky, with countrates in excess of 0.1 cts s-1in early satellites as UHURU, and in excess of 10 cts s-1in ROSAT; there are dozens of sources per square degree at the lowest countrates (about 0.5 cts ks-1) detectable by ROSAT in a long observation. Whenever an X-ray source is detected in the direction of an extended object like a globular cluster, the question must be faced whether the source actually belongs to the cluster or is a fore- or background object. The answer to the question depends on the flux of the source and on the extent of the search area. Thus, a bright source projected against the small core of a globular cluster may be safely asserted to be associated with the cluster, but a faint source projected against the outskirts of the cluster is more likely to be a foreground star or background active galaxy. At very low flux levels even a source in the cluster core may be a chance projection.
Whereas the twelve bright sources detected in the direction of as many globular clusters are clearly members of these clusters (for a list see e.g. Hut et al. 1992), the situation is more complicated for the fainter sources. For example, Hertz & Grindlay (1983) detected five sources in the direction of Cen, one projected on the core, and four outside it. Three of the sources detected outside the core have been identified with foreground stars, certainly not cluster members (Margon & Bolte 1987, Cool et al. 1995); the fourth one may well be a fore- or background object as well (Verbunt et al. 1995). With ROSAT three sources are detected in projection against the large core of Cen, the brighter two probably belonging to the cluster, but the faintest one possibly a fore- or background object (Verbunt & Johnston 2000). It would be rash, however, to conclude that all faint sources outside the cluster core are not related to the cluster. Rappaport et al. (1994) detect three sources in the field of view of a ROSAT HRI observation of the globular cluster Pal 2, one of which has a distance of 32′′ to the cluster centre; even though this source is well outside the core radius of this cluster, and even taking into account the higher sensitivity near the center of the field of view, the probability that a single serendipitous source is this close to the cluster is small, and Rappaport et al. argue that the source is a cluster member. The dwarf nova V 101 is well outside the core radius, and even outside the half-mass radius, of the globular cluster NGC 5904, but is detected in X-rays and most probably is a member of the cluster (Hakala et al. 1997).
A census of X-ray sources outside the cores of but belonging to globular clusters is interesting for two main reasons. Such sources may belong to the population of primordial binaries in globular clusters that may show up as an X-ray source. The cataclysmic variable V 101 in NGC 5904 may well be an example. The population of X-ray sources in the cores of globular clusters must be studied in comparison with this primordial population: in a relatively open globular cluster most binaries in the core are primordial (see e.g. Verbunt & Meylan 1988, Davies 1997). On the other hand, some of the sources outside the cores may originate in the cores, being catapulted out of them in three-body interactions; at the moment no examples of such X-ray sources can be identified, but that such ejection does occur is shown by the radio pulsar binary C in M 15 (Sigurdsson & Phinney 1993). These ejected sources probably are a minor fraction, but they are interesting as providing information of the nature and frequency of close encounters between binaries and single stars or between binaries and binaries in the cluster cores, processes that are instrumental in the evolution of the cluster.
The first goal of this paper is to provide a census of low-luminosity X-ray sources in globular clusters, both in their cores and outside them, on the basis of the observations made with ROSAT. For many sources only optical identification will decide whether they are members of the cluster or not, and a secondary goal of this paper is to obtain accurate positions for the X-ray sources where possible. To obtain a homogeneous data base – for example with respect to the assumed size of the ROSAT HRI pixels, see Sect. 2 – , I do not only analyze previously unpublished data, but also re-analyse some previously published data. Because low-luminosity sources cannot be detected in clusters with bright X-ray sources, this paper is limited to those clusters in which no bright source is detected, but includes clusters with X-ray transients in their low state. The data analysis and selection is described in Sect. 2, the results are give in Sect 3, and a first analysis and discussion of the results is given in Sect. 4.
2 Data analysis
| no. | observed (JD2440000) | (s) | offset | no. | observed (JD2440000) | (s) | offset | ||||
|---|---|---|---|---|---|---|---|---|---|---|---|
| 104 | P | 91/03 | 8343.741–352.676 | 20148 | 6341 | P | 92/08 | 8861.995–865.548 | 45541 | ||
| 104 | P | 92/04 | 8730.616–751.255 | 34028 | 6352 | P | 93/09 | 9254.788–256.390 | 9465 | 0 | |
| 362 | H | 95/05 | 9851.086–854.962 | 20060 | 6366 | P | 93/08 | 9229.414–229.965 | 9807 | ||
| 1261 | P | 93/01 | 8983.709–024.779 | 45766 | HP 1 | H | 93/03 | 9065.584–065.604 | 1747 | ||
| 1261 | H | 95/02 | 9750.835–751.850 | 5478 | , | 6380 | H | 92/03 | 8696.302–698.182 | 4858 | |
| 1261 | H | 95/11 | 10049.573–050.576 | 3145 | 6388 | P | 91/09 | 8526.894–527.832 | 20937 | 33′ () | |
| Pal 2 | H | 92/03 | 8694.469–697.019 | 6194 | 6388 | P | 92/09 | 8894.048–894.065 | 1510 | 26′ () | |
| 1904 | H | 91/12 | 8303.045–303.079 | 2557 | Djo 1 | H | 94/09 | 9624.686–624.719 | 2428 | 20′ | |
| 3201 | P | 91/12 | 8602.544–603.804 | 1787 | Ter 6 | H | 92/03 | 8697.825–699.179 | 4997 | ||
| 4372 | P | 93/09 | 9234.920–237.030 | 8572 | 6453 | H | 92/03 | 8696.966–702.298 | 2755 | ||
| 4590 | H | 93/09 | 9729.609–731.504 | 6999 | 6453 | P | 93/03 | 9069.165–072.306 | 28760 | 33′ | |
| 5053 | H | 95/06 | 9890.716–894.914 | 6299 | 6496 | P | 93/03 | 9077.465–077.643 | 11569 | ||
| 5272 | H | 92/01 | 8633.160–633.182 | 1881 | 6522 | P | 93/03 | 9076.031–076.947 | 29578 | ||
| 5272 | H | 95/07 | 9913.062–913.162 | 4756 | 6528 | P | 93/03 | 9076.031–076.947 | 29578 | 19′ | |
| 5286 | H | 92/07 | 8835.408–836.422 | 5824 | 6540 | P | 93/03 | 9078.463–078.704 | 10033 | 32′ | |
| 5466 | P | 91/07 | 8450.203–451.079 | 25728 | 20′ | 6541 | H | 91/03 | 8336.428–338.630 | 3837 | |
| 5466 | H | 94/07 | 9550.408–552.548 | 8079 | 6544 | P | 91/03 | 8322.782–327.047 | 1686 | ||
| 5466 | H | 95/01 | 9736.148–740.275 | 4041 | +3,5 | 6553 | P | 93/09 | 9241.314–241.338 | 2014 | 32′ |
| 5466 | H | 96/01 | 10090.270–098.387 | 4906 | +2,2 | Ter 11 | P | 93/09 | 9241.036–243.457 | 4616 | 24′ |
| 5824 | H | 91/02 | 8298.149–298.177 | 2432 | 6626 | P | 91/03 | 8327.308–331.797 | 3334 | ||
| 5824 | H | 94/08 | 9593.025–595.291 | 2122 | 6626 | H | 95/03 | 9795.030–812.234 | 41764 | ||
| 5904 | P | 93/07 | 9194.477–195.282 | 2017 | 6626 | H | 96/03 | 10162.353–169.600 | 4573 | ||
| 5904 | H | 94/02 | 9387.101–387.192 | 3574 | 6626 | H | 96/09 | 10349.326–354.069 | 25541 | ||
| 5904 | H | 94/08 | 9577.302–580.912 | 17969 | +14,6 | 6626 | H | 96/09 | 10355.244–355.799 | 8736 | |
| 5904 | H | 96/02 | 10132.222–134.227 | 3185 | 6638 | P | 92/04 | 8716.730–721.395 | 16193 | 35′ | |
| 5904 | H | 96/07 | 10288.351–320.863 | 28045 | + | 6638 | P | 93/09 | 9244.767–245.319 | 5981 | 41′ |
| 5986 | H | 95/09 | 9963.730–964.553 | 1613 | 19′ | 6642 | P | 92/04 | 8714.671–718.869 | 7428 | |
| 6093 | P | 92/03 | 8691.506–691.733 | 9201 | 6642 | P | 92/10 | 8904.672–908.262 | 20519 | 38′ | |
| 6121 | P | 91/03 | 8317.311–317.390 | 2343 | 6656 | P | 91/03 | 8329.713–330.329 | 8295 | ||
| 6121 | P | 91/09 | 8510.101–510.229 | 2348 | 6656 | H | 92/09 | 8881.759–882.975 | 9475 | ||
| 6121 | H | 93/02 | 9036.617–038.955 | 1584 | 6656 | H | 93/03 | 9064.711–067.866 | 31709 | ||
| 6121 | H | 94/09 | 9595.829–612.044 | 12986 | +3,+2 | 6715 | P | 91/03 | 8346.641–347.324 | 7871 | 41′ |
| 6121 | H | 95/08 | 9946.323–947.279 | 17484 | + | 6723 | P | 91/04 | 8348.571–349.412 | 7761 | 23′ |
| 6139 | H | 92/09 | 8881.472–881.487 | 1261 | 6723 | H | 94/09 | 9626.344–627.839 | 6994 | ||
| 6139 | H | 94/08 | 9588.787–615.527 | 9300 | 6723 | H | 94/10 | 9633.244–633.285 | 3500 | ||
| 6139 | P | 92/02 | 8679.257–679.278 | 1857 | 53′ | 6760 | P | 92/03 | 8705.738–705.879 | 1548 | |
| 6139 | P | 93/03 | 9052.507–052.522 | 1316 | 53′ | 6760 | P | 92/10 | 8911.056–912.727 | 14355 | |
| 6205 | P | 92/09 | 8869.968–872.916 | 45872 | 6760 | P | 93/03 | 9070.700–072.923 | 12544 | 27′ | |
| 6205 | H | 94/09 | 9600.051–600.999 | 21634 | 6779 | H | 98/03 | 10895.906–926.498 | 21169 | ||
| 6254 | P | 93/09 | 9232.327–232.749 | 9420 | 6809 | P | 93/03 | 9074.440–093.176 | 19952 | ||
| 6266 | P | 91/03 | 8329.239–333.260 | 13868 | 15′ | 6809 | H | 96/10 | 10378.463–385.441 | 5747 | |
| 6266 | P | 92/02 | 8680.558–681.031 | 12516 | 0,+11 | 6809 | H | 97/09 | 10721.429–734.849 | 45561 | |
| 6273 | H | 92/03 | 8694.633–695.192 | 5971 | 6838 | P | 91/04 | 8351.853–352.608 | 7492 | ||
| 6293 | P | 92/09 | 8887.279–887.290 | 963 | 6838 | H | 94/04 | 9452.860–466.812 | 31993 | ||
| 6293 | P | 92/09 | 8888.275–888.287 | 923 | 6838 | H | 94/10 | 9635.799–637.477 | 27966 | ||
| 6304 | H | 92/03 | 8695.631–696.255 | 5060 | 7089 | H | 94/11 | 9685.045–688.126 | 8729 | ||
| 6316 | H | 92/03 | 8695.697–696.840 | 6475 | 7099 | P | 91/05 | 8386.592–386.607 | 1291 | ||
| 6341 | H | 94/04 | 9447.410–450.952 | 18117 | 7099 | P | 91/11 | 8576.471–577.554 | 3000 | ||
| 6341 | H | 94/08 | 9593.840–599.074 | 20254 | 7099 | P | 93/11 | 9299.339–299.759 | 10463 | 29′ | |
| 6341 | H | 95/04 | 9817.436–817.468 | 2718 | 7492 | P | 93/11 | 9320.934–321.151 | 4529 | 12′ | |
| 6341 | P | 92/04 | 8709.449–709.730 | 6646 | |||||||
Starting from the list of globular clusters belonging to our Galaxy with their positions as given by Djorgovski & Meylan (1993), I use a ROSAT database utility to identify all ROSAT PSPC and HRI observations that have a globular cluster in the field of view. All observations thus found are listed in Table 1 and are analysed for this paper; with the exception of the HRI observations of NGC 104, NGC 5139, NGC 6397, NGC 6440, NGC 6752 and Liller 1, which have been reported elsewhere (Verbunt & Hasinger 1998, Verbunt & Johnston 2000, Verbunt et al. 2000), as well as some data on NGC 5272, published by Dotani et al. (1999). The analysis of the X-ray data for each cluster is done in a number of steps.
The first of these steps uses the standard reduction with EXSAS (Zimmermann et al. 1998) to find all detected sources in each separate observation. The standard analysis for HRI observations is done as described in Verbunt & Johnston (2000). The same method is used for PSPC observations, except that for these no pixel size correction is needed; to reduce background, the analysis – unless otherwise indicated – discussed in this paper is limited to the energy channels 50-240, i.e. energy range 0.5-2.5 keV. The standard reduction produces for each source a maximum-likelihood value ML such that the probability that the source is due to chance at one trial position is . I retain for further discussion all sources that have ML.
If more than one observation with the same detector was made, the offset between these observations is determined, and the observations are added, with the method described in Verbunt & Hasinger (1998). The determined offsets are rounded off to the nearest integer number of pixels (1 pixel corresponding to ), and are given in Table 1. The co-added image is analysed with the standard procedure.
When no source is found in the cluster core, an upper limit to the countrate is determined. For the PSPC I use the EXSAS procedure. This uses a fit made to the spatial distribution of counts that remains after removal of the detected sources. This fit predicts the number of background counts at the required position, and sets the upper limit to the source counts at the - excess above the map. I use 2. Dividing this number of counts by the effective exposure time gives the upper limit to the countrate. For the HRI the number of counts predicted at the source position from the background map is usually too small for this method to be reliable, and thus I use the method described in Verbunt & Johnston (2000) for HRI upper limits. When no source is detected in or near the globular cluster, the determination of the upper limit ends my analysis of that cluster.
When the cluster core contains a source which the standard analysis labels as an extended source, a further analysis is used to separate it into individual point sources. The method of this further analysis is as described in Sect. 2.3 of Verbunt et al. (2000). This method produces for each source a which may be compared with a distribution for three degrees of freedom. Thus, a source with has a significance of more than 3-. This statistical measure is correct only if the point spread function is entirely accurate; to allow for uncertainty in the point spread function, especially in longer exposures where observations of many separate orbits are added, I use 20 as the lower limit for at which a source is accepted.
A cluster source for which more than about 250 counts are detected with the PSPC is subjected to spectral analysis. I extract source plus background counts from a circle around the source position; and background from a ring around that. The source counts are found for each of the channels 11-240 by subtracting the background in the circle, as estimated from the ring. The circle size is adjusted so that the net source counts for all channels together agrees with the number found from the source detection algorithm. I then bin the source counts, demanding that each bin has a minimum width equal to the spectral resolution and contains at least 20 photons. This allows fitting. For this purpose the resolution in number of channels as a function of the channel number is sufficiently well approximated with , rounded off to nearest integer. First, I try fits with a fixed absorption column , derived from the visual absorption according to the empirical relation determined by Predehl & Schmitt (1995), cm-2. If no satisfactory fit is found, the absorption is also allowed to vary, increasing by one of the number of fitted parameters. I approximate a bremsstrahlung spectrum with energy flux .
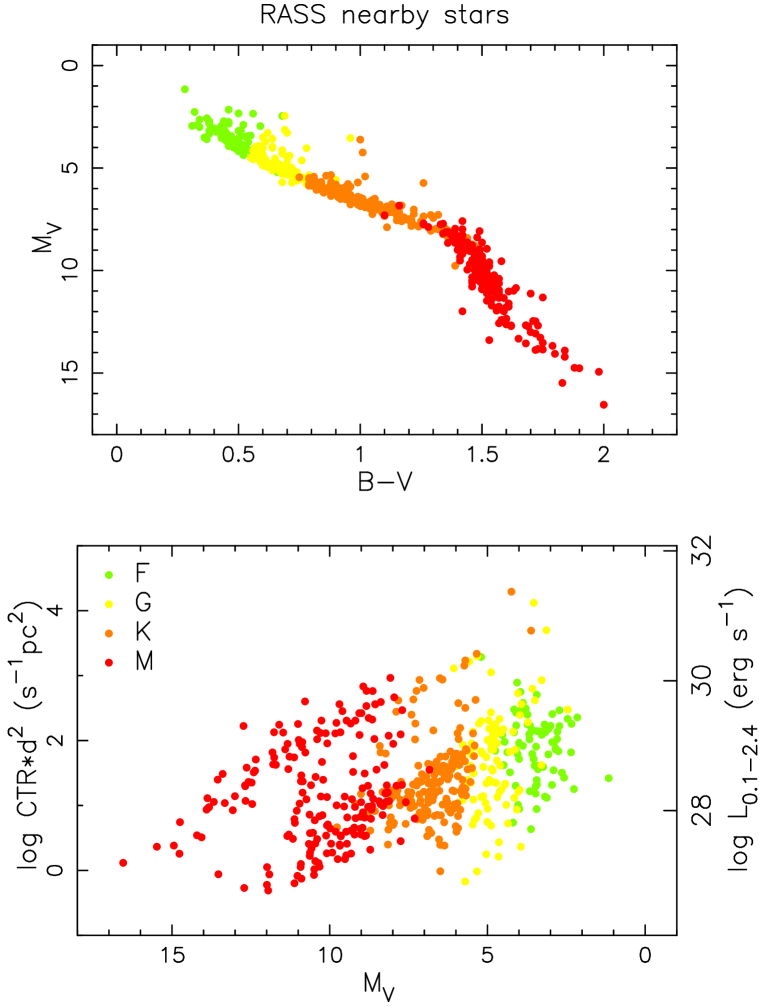
The main goal of the identification of X-ray sources not related to the globular cluster is an accurate determination of the offset between the X-ray and optical coordinate systems i.e. the bore sight correction. For this reason I limit the search for optical identifications to X-ray sources with positional accuracy (in the X-ray coordinate frame) better than 10′′. I use SIMBAD to list objects within 1′ of each X-ray position; possible identifications are well within this limit, always within 10′′ of the X-ray position, and most often rather better than that. Each suggested identification with a star is subjected to a further check whether the observed countrate is within the range expected for that star; the results are listed in the Appendix, Table 5. (I define this expected range on the basis of detections of nearby stars in the ROSAT All Sky Survey, as explained in the Appendix.) The offset between the X-ray and optical coordinate frames is determined from these identified X-ray sources, and used to bring the X-ray positions to the J2000 system. These offsets are also given in Table 1.
The probability of cluster membership as opposed to chance positional coincidence, is discussed after collation of the results for all analyzed observations, in Sect. 4.2.
3 Individual clusters
In this section I describe the detected sources for the individual clusters, which are listed in Table 2. To limit the length of this Table, I tabulate sources only for those clusters in or near which a (possibly) associated source is detected; and only those non-cluster sources with positional accuracy better than 10′′. The luminosities of the cluster sources are listed in Table 3, which includes upper limits, for sources in the core and in Table 4 for sources outside the cores.
3.1 NGC 104/47 Tuc
The ROSAT HRI observations of 47 Tuc are described by Verbunt & Hasinger (1998), who detect five sources in the cluster core, and four outside the core but within the half-mass radius; all probably related to 47 Tuc. Reanalysis of the sources in the core with the multi-source fits described in Verbunt et al. (2000) gives the same positions and countrates as given in Table 2 of Verbunt & Hasinger, within the errors. The source listed in Tab. 3 is the conglomerate of X 5, X 7, X 9, X 10 and X 19 of Verbunt & Hasinger.
The PSPC observations of 47 Tuc have a total exposure of 59.8 ksec; as they do not resolve the core, I have limited my analysis to the determination in the two longer observations (listed in Table 1) of the countrate and of a fit to the spectrum of the conglomerate source in the cluster center. The data given in Table 3 and in Fig. 3 are from the 1992 observation; the data from 1991 are compatible with these, i.e. no indication of variability is found. A bremsstrahlung spectrum absorbed by a column about twice that expected on the basis of the visual absorption gives the best fit, which however is still not acceptable (see Fig. 3). This may simply reflect that the observed spectrum is the sum of several, non-identical spectra; alternatively, bremsstrahlung may not correctly describe the spectra. Blackbody or powerlaw spectra give even worse fits. From the summed spectrum it is clear, however, that the flux from the core is soft, peaking at an energy of about 0.6 keV.
| X | (2000) | (2000) | ML | cts/ksec | ||||||
| NGC 362 | ||||||||||
| x1 | 01 | 03 | 14.95 | 70 | 50 | 57.9 | 1.2 | 44 | 0.4 | 2.80.4 |
| 2 | 01 | 03 | 26.24 | 70 | 53 | 39.6 | 0.7 | 81 | 15.4 | 2.50.4 |
| NGC 362 multi-source analysis | ||||||||||
| 1a | 01 | 03 | 15.22 | 70 | 51 | 00.3 | 1.1 | 83 | 0.7 | 1.70.3 |
| 1b | 01 | 03 | 14.74 | 70 | 50 | 51.4 | 1.2 | 32 | 0.3 | 1.00.3 |
| Pal 2 | ML | |||||||||
| 1 | 04 | 46 | 03.85 | 31 | 22 | 38.1 | 1.4 | 16 | 2.0 | 1.50.5 |
| NGC 1904 | ||||||||||
| 1 | 05 | 24 | 15.67 | 24 | 31 | 12.1 | 1.3 | 24 | 7.4 | 4.11.3 |
| NGC 5272/M 3 | ||||||||||
| B | 13 | 42 | 10.86 | 28 | 28 | 47.8 | 0.8 | 99 | 11.4 | 11.71.6 |
| C | 13 | 42 | 54.47 | 28 | 28 | 04.3 | 1.8 | 99 | 20.0 | 15.12.0 |
| A | 13 | 42 | 09.76 | 28 | 22 | 47.2 | 1.1 | 55 | 0.7 | 5.81.2 |
| E | 13 | 41 | 15.43 | 28 | 16 | 04.9 | 3.7 | 40 | 25.2 | 10.41.8 |
| G | 13 | 42 | 28.44 | 28 | 14 | 29.5 | 2.4 | 19 | 16.2 | 3.40.9 |
| O | (2000) | (2000) | ||||||||
| B | 13 | 42 | 10.89 | 28 | 28 | 47.1 | QSO Q 1339+2843a,b | |||
| C | 13 | 42 | 54.41 | 28 | 28 | 06.5 | QSO B2 1340+28a,c | |||
| E | 13 | 41 | 15.31 | 28 | 16 | 04.4 | QSO 1338+2831a | |||
| a Harris et al. 1992, b Carney 1976, c Geffert 1998 | ||||||||||
| NGC 5904 | ||||||||||
| 1 | 15 | 17 | 57.87 | 02 | 15 | 39.4 | 2.4 | 47 | 33.2 | 2.40.3 |
| 2 | 15 | 18 | 24.14 | 02 | 13 | 46.6 | 1.2 | 67 | 21.7 | 1.80.2 |
| 3 | 15 | 18 | 58.59 | 02 | 07 | 57.3 | 1.3 | 34 | 16.4 | 0.90.2 |
| 4 | 15 | 18 | 14.47 | 02 | 05 | 35.3 | 1.4 | 14 | 11.6 | 0.40.1 |
| 6 | 15 | 19 | 26.76 | 02 | 03 | 59.7 | 3.0 | 35 | 31.6 | 2.10.3 |
| 7 | 15 | 18 | 13.81 | 02 | 02 | 40.8 | 1.3 | 17 | 13.1 | 0.40.1 |
| 5 | 15 | 18 | 31.93 | 01 | 58 | 49.4 | 2.3 | 13 | 14.7 | 0.70.2 |
| 8 | 15 | 18 | 51.79 | 01 | 57 | 57.0 | 2.1 | 14 | 19.8 | 0.60.2 |
| 9 | 15 | 18 | 4.61 | 01 | 57 | 49.0 | 1.6 | 55 | 24.3 | 1.80.2 |
| 10 | 15 | 18 | 46.66 | 01 | 56 | 56.5 | 1.3 | 49 | 20.6 | 1.40.2 |
| O | (2000) | (2000) | ||||||||
| 4 | 15 | 18 | 14.46 | 02 | 05 | 35.2 | V 101a | |||
| 6 | 15 | 19 | 26.8 | 02 | 04 | 00.0 | QSO Q 1516+0214b | |||
| a Evstigneeva et al. 1995, b Harris et al. 1992 | ||||||||||
| X | (2000) | (2000) | ML | cts/ksec | ||||||
| NGC 6093/M 80 | ||||||||||
| 1 | 16 | 15 | 34.54 | 22 | 42 | 41.4 | 1.9 | 99 | 171.2 | 178.75.1 |
| 2 | 16 | 16 | 12.34 | 22 | 44 | 24.8 | 7.7 | 47 | 121.4 | 7.11.1 |
| 3 | 16 | 17 | 14.13 | 22 | 51 | 56.6 | 4.6 | 27 | 47.2 | 2.30.6 |
| 4 | 16 | 16 | 37.53 | 22 | 52 | 03.6 | 5.2 | 18 | 57.5 | 1.70.5 |
| 5 | 16 | 17 | 31.07 | 22 | 52 | 14.1 | 1.9 | 99 | 60.6 | 37.42.1 |
| 6 | 16 | 17 | 12.38 | 22 | 53 | 08.8 | 4.9 | 20 | 38.8 | 1.70.5 |
| 7 | 16 | 17 | 14.67 | 22 | 55 | 19.8 | 1.5 | 99 | 28.2 | 13.91.3 |
| 8 | 16 | 17 | 09.24 | 22 | 55 | 22.0 | 6.3 | 16 | 23.3 | 1.80.5 |
| 9 | 16 | 16 | 46.96 | 22 | 57 | 34.5 | 5.2 | 14 | 24.6 | 1.40.5 |
| 10 | 16 | 17 | 02.27 | 22 | 58 | 30.0 | 3.7 | 45 | 0.4 | 3.30.7 |
| 11 | 16 | 16 | 35.09 | 23 | 02 | 21.3 | 5.3 | 17 | 49.3 | 1.90.5 |
| 12 | 16 | 17 | 53.16 | 23 | 02 | 29.1 | 3.5 | 68 | 82.2 | 5.10.8 |
| 13 | 16 | 17 | 11.59 | 23 | 03 | 03.0 | 5.2 | 21 | 33.4 | 1.90.5 |
| 14 | 16 | 17 | 31.20 | 23 | 03 | 32.8 | 0.2 | 99 | 55.4 | 550.77.9 |
| 15 | 16 | 14 | 12.12 | 23 | 04 | 56.7 | 8.6 | 99 | 264.9 | 163.56.1 |
| 16 | 16 | 16 | 39.31 | 23 | 10 | 02.8 | 7.9 | 15 | 84.8 | 2.1 0.6 |
| 17 | 16 | 16 | 40.79 | 23 | 14 | 35.4 | 4.5 | 99 | 112.3 | 9.6 1.2 |
| 18 | 16 | 16 | 00.21 | 23 | 25 | 10.2 | 6.6 | 99 | 201.9 | 42.1 2.9 |
| O | (2000) | (2000) | ||||||||
| 1 | 16 | 15 | 34.72 | 22 | 42 | 38.0 | VV Sco | |||
| 7 | 16 | 17 | 14.67 | 22 | 55 | 19.8 | HD 146457 | |||
| 14 | 16 | 17 | 31.41 | 23 | 03 | 36.1 | HD 146516 | |||
| NGC 6121/M 4 | ||||||||||
| 7 | 16 | 23 | 57.30 | 26 | 20 | 27.2 | 3.2 | 43 | 14.6 | 3.4 0.5 |
| 3 | 16 | 23 | 22.93 | 26 | 22 | 16.4 | 0.2 | 99 | 11.6 | 58.5 1.4 |
| 8 | 16 | 24 | 14.93 | 26 | 27 | 52.7 | 2.6 | 15 | 11.5 | 1.0 0.3 |
| 9 | 16 | 23 | 34.24 | 26 | 31 | 41.8 | 1.7 | 11 | 0.4 | 0.5 0.2 |
| 10 | 16 | 24 | 26.97 | 26 | 35 | 33.3 | 4.4 | 14 | 14.7 | 1.5 0.4 |
| O | (2000) | (2000) | ||||||||
| 3 | 16 | 23 | 22.93 | 26 | 22 | 16.4 | HIP 80290a | |||
| a Perryman et al. 1997 | ||||||||||
| NGC 6139 | ||||||||||
| 1 | 16 | 27 | 40.58 | 38 | 50 | 56.2 | 1.6 | 20 | 0.3 | 1.4 0.4 |
| 2 | 16 | 27 | 41.84 | 38 | 53 | 22.4 | 1.3 | 29 | 17.5 | 2.1 0.5 |
| NGC 6205/M 13 46.8 1.9 | ||||||||||
| N | 16 | 41 | 53.13 | 36 | 40 | 21.7 | 5.0 | 14 | 16.6 | 2.4 0.5 |
| R | 16 | 40 | 47.17 | 36 | 37 | 51.8 | 4.5 | 15 | 19.2 | 2.5 0.6 |
| H | 16 | 41 | 56.79 | 36 | 35 | 12.9 | 2.5 | 17 | 10.5 | 1.4 0.3 |
| B | 16 | 40 | 56.42 | 36 | 34 | 05.3 | 0.8 | 99 | 14.3 | 8.7 0.7 |
| D | 16 | 41 | 11.17 | 36 | 32 | 30.8 | 0.7 | 99 | 10.0 | 5.2 0.5 |
| J | 16 | 42 | 19.87 | 36 | 31 | 50.4 | 1.6 | 34 | 11.3 | 2.0 0.4 |
| xG | 16 | 41 | 44.02 | 36 | 27 | 58.0 | 1.0 | 51 | 0.8 | 2.0 0.3 |
| E | 16 | 41 | 18.65 | 36 | 26 | 47.2 | 1.2 | 20 | 6.0 | 0.9 0.2 |
| F | 16 | 41 | 38.47 | 36 | 26 | 28.7 | 3.6 | 99 | 1.6 | 2.40.2a |
| C | 16 | 40 | 58.77 | 36 | 24 | 27.6 | 1.7 | 31 | 11.7 | 1.9 0.4 |
| I | 16 | 42 | 03.62 | 36 | 24 | 14.1 | 1.3 | 21 | 7.2 | 1.0 0.3 |
| A | 16 | 40 | 32.13 | 36 | 23 | 19.7 | 4.6 | 16 | 18.7 | 2.6 0.6 |
| Q | 16 | 42 | 35.66 | 36 | 18 | 10.8 | 5.8 | 10 | 18.5 | 2.20.6 |
| S | 16 | 40 | 55.85 | 36 | 16 | 01.4 | 6.1 | 11 | 18.9 | 2.30.6 |
| T | 16 | 41 | 18.08 | 35 | 59 | 32.7 | 4.4 | 99 | 36.5 | 19.40.8a |
| NGC 6205 multi-source analysis | ||||||||||
| Ga | 16 | 41 | 44.02 | 36 | 27 | 57.7 | 0.9 | 70 | 0.8 | 1.80.3 |
| Gb | 16 | 41 | 45.10 | 36 | 27 | 35.5 | 2.7 | 21 | 0.9 | 0.70.2 |
| O | (2000) | (2000) | ||||||||
| R | 16 | 40 | 46.83 | 36 | 37 | 53.51 | USNO-A2 1200-07982833 | |||
| T | 16 | 41 | 17.53 | 35 | 59 | 31.26 | USNO-A2 1200-07987402 | |||
| a countrate for PSPC channels 50-240 | ||||||||||
| X | (2000) | (2000) | ML | cts/ksec | ||||||
| NGC 6266/M 62 | ||||||||||
| 1 | 17 | 02 | 04.90 | 29 | 42 | 59.9 | 6.5 | 29 | 146.1 | 2.6 0.5 |
| 2 | 17 | 03 | 24.32 | 29 | 48 | 42.8 | 6.9 | 46 | 187.3 | 4.8 0.6 |
| 3 | 17 | 02 | 04.66 | 29 | 48 | 58.0 | 4.9 | 14 | 116.9 | 1.0 0.3 |
| 4 | 17 | 00 | 27.79 | 29 | 49 | 49.6 | 8.2 | 29 | 108.3 | 3.7 0.6 |
| 5 | 17 | 02 | 44.82 | 29 | 50 | 14.7 | 4.2 | 32 | 143.8 | 2.0 0.4 |
| 6 | 17 | 03 | 07.29 | 29 | 50 | 27.1 | 1.1 | 99 | 164.8 | 38.7 1.3 |
| 7 | 17 | 01 | 59.17 | 29 | 50 | 28.6 | 4.9 | 17 | 106.2 | 1.2 0.3 |
| 8 | 17 | 01 | 10.02 | 29 | 54 | 41.1 | 1.9 | 99 | 67.0 | 6.9 0.6 |
| 9 | 17 | 01 | 28.82 | 29 | 57 | 46.4 | 4.2 | 26 | 53.5 | 1.6 0.3 |
| 10 | 17 | 00 | 50.64 | 29 | 58 | 41.0 | 3.0 | 99 | 51.9 | 7.4 0.7 |
| 11 | 17 | 02 | 08.51 | 30 | 03 | 6.7 | 3.9 | 25 | 70.1 | 1.5 0.3 |
| 12 | 17 | 00 | 16.54 | 30 | 03 | 32.3 | 1.3 | 99 | 69.7 | 132.7 2.6 |
| 13 | 17 | 03 | 06.41 | 30 | 06 | 17.8 | 7.3 | 17 | 136.8 | 1.8 0.4 |
| x14 | 17 | 01 | 13.08 | 30 | 06 | 44.3 | 1.9 | 99 | 0.6 | 22.1 1.1 |
| 15 | 17 | 02 | 10.57 | 30 | 14 | 8.9 | 8.2 | 18 | 80.9 | 1.9 0.4 |
| O | (2000) | (2000) | ||||||||
| – | 16 | 58 | 55.4 | 29 | 52 | 28 | MXB 1658298a | |||
| 8 | 17 | 01 | 09.81 | 29 | 54 | 42.0 | PKS 165728b | |||
| 12 | 17 | 00 | 16.59 | 30 | 03 | 32.1 | TYC 7360 394 1c | |||
| a Cominsky & Wood 1989, b Wright et al. 1991 | ||||||||||
| c Høg et al. 1997 | ||||||||||
| NGC 6341/M 92 | ||||||||||
| 2 | 17 | 17 | 30.28 | 43 | 19 | 43.8 | 3.1 | 18 | 53.4 | 1.5 0.3 |
| E | 17 | 16 | 38.17 | 43 | 12 | 15.7 | 1.8 | 15 | 29.1 | 0.6 0.2 |
| 6 | 17 | 17 | 01.26 | 43 | 10 | 43.6 | 0.9 | 55 | 12.1 | 1.3 0.2 |
| 7 | 17 | 18 | 10.61 | 43 | 08 | 56.8 | 2.8 | 22 | 50.3 | 1.5 0.3 |
| 8 | 17 | 17 | 07.19 | 43 | 08 | 14.0 | 1.2 | 46 | 0.2 | 1.4 0.2 |
| 10 | 17 | 16 | 32.72 | 43 | 02 | 29.1 | 0.2 | 99 | 37.0 | 29.3 0.9 |
| 12 | 17 | 16 | 49.29 | 42 | 54 | 55.3 | 3.1 | 24 | 59.4 | 2.0 0.4 |
| O | (2000) | (2000) | ||||||||
| E | 17 | 16 | 38.27 | 43 | 12 | 14.4 | V798 Hera | |||
| 6 | 17 | 16 | 32.70 | 43 | 02 | 29.4 | TYC 3081 510 1b | |||
| a Tucholke et al. 1996, b Høg et al. 1997 | ||||||||||
| NGC 6352 | ||||||||||
| 2 | 17 | 24 | 32.14 | 48 | 16 | 18.4 | 5.1 | 36 | 15.8 | 3.8 0.8 |
| 3 | 17 | 24 | 42.70 | 48 | 17 | 45.9 | 6.8 | 21 | 13.0 | 2.8 0.7 |
| 17 | 17 | 25 | 17.72 | 48 | 21 | 12.2 | 6.0 | 14 | 5.5 | 1.5 0.5 |
| 4 | 17 | 25 | 21.43 | 48 | 26 | 09.7 | 5.4 | 19 | 1.8 | 1.9 0.5 |
| 5 | 17 | 25 | 20.76 | 48 | 29 | 41.2 | 4.0 | 53 | 5.5 | 4.7 0.8 |
| 6 | 17 | 26 | 34.40 | 48 | 30 | 44.6 | 5.2 | 26 | 14.6 | 2.7 0.6 |
| 7 | 17 | 27 | 13.16 | 48 | 32 | 46.4 | 5.7 | 46 | 22.6 | 5.5 0.9 |
| 8 | 17 | 27 | 50.90 | 48 | 32 | 49.4 | 7.2 | 98 | 29.7 | 15.6 1.7 |
| 9 | 17 | 26 | 13.17 | 48 | 35 | 24.3 | 1.7 | 99 | 15.0 | 20.2 1.6 |
| 10 | 17 | 26 | 22.51 | 48 | 36 | 54.9 | 3.0 | 99 | 17.5 | 9.6 1.1 |
| 11 | 17 | 25 | 10.24 | 48 | 39 | 53.8 | 5.5 | 40 | 17.9 | 4.3 0.8 |
| 12 | 17 | 24 | 40.66 | 48 | 40 | 07.2 | 5.2 | 71 | 20.3 | 7.9 1.1 |
| 14 | 17 | 25 | 37.80 | 48 | 46 | 15.7 | 8.6 | 29 | 25.2 | 4.8 1.0 |
| 16 | 17 | 24 | 34.44 | 48 | 59 | 50.4 | 9.4 | 99 | 43.0 | 37.9 2.9 |
| O | (2000) | (2000) | ||||||||
| 9 | 17 | 26 | 13.22 | 48 | 35 | 25.4 | HIP 85326a | |||
| 10 | 17 | 26 | 22.46 | 48 | 36 | 53.6 | HIP 85342a | |||
| a Perryman et al. 1997 | ||||||||||
| X | (2000) | (2000) | ML | cts/ksec | ||||||
| NGC 6366 | ||||||||||
| 7 | 17 | 27 | 45.95 | 04 | 50 | 00.7 | 8.5 | 15 | 8.0 | 1.8 0.5 |
| 8 | 17 | 27 | 44.25 | 04 | 54 | 18.6 | 5.3 | 25 | 5.6 | 2.0 0.5 |
| 2 | 17 | 28 | 32.80 | 05 | 03 | 25.1 | 6.6 | 18 | 6.6 | 1.6 0.5 |
| 3 | 17 | 26 | 52.40 | 05 | 03 | 57.5 | 8.8 | 15 | 7.1 | 1.9 0.5 |
| 4 | 17 | 27 | 42.36 | 05 | 05 | 05.5 | 5.4 | 27 | 0.4 | 2.4 0.6 |
| 5 | 17 | 26 | 37.88 | 05 | 05 | 11.7 | 1.7 | 99 | 9.1 | 54.1 2.5 |
| 6 | 17 | 27 | 53.44 | 05 | 14 | 56.5 | 7.1 | 15 | 5.8 | 1.5 0.5 |
| O | (2000) | (2000) | ||||||||
| 5 | 17 | 26 | 37.88 | 05 | 05 | 11.7 | HIP 85365a | |||
| a Perryman et al. 1997 | ||||||||||
| NGC 6388 | ||||||||||
| 1991 | ||||||||||
| 1 | 17 | 38 | 06.02 | 44 | 03 | 32.5 | 1.5 | 99 | 374.5 | 136.6 3.0 |
| 2 | 17 | 38 | 46.39 | 44 | 06 | 00.2 | 1.6 | 99 | 386.9 | 68.9 2.1 |
| 3 | 17 | 37 | 18.26 | 44 | 25 | 54.4 | 9.9 | 25 | 176.7 | 10.4 1.2 |
| 4 | 17 | 37 | 18.26 | 44 | 29 | 21.1 | 9.8 | 19 | 152.7 | 10.9 1.2 |
| 5 | 17 | 36 | 20.44 | 44 | 44 | 39.9 | 9.3 | 92 | 6.9 | 16.7 1.6 |
| 1992 | ||||||||||
| 1 | 17 | 38 | 06.08 | 44 | 03 | 33.8 | 4.2 | 99 | 374.4 | 95.5 9.1 |
| 6 | 17 | 38 | 40.34 | 44 | 17 | 40.5 | 3.5 | 99 | 305.8 | 122.710.6 |
| 7 | 17 | 36 | 51.74 | 44 | 20 | 07.3 | 4.0 | 49 | 206.3 | 19.1 3.8 |
| 5 | 17 | 36 | 17.30 | 44 | 44 | 52.7 | 26.7 | 15 | 6.5 | 29.7 6.8 |
| O | (2000) | (2000) | ||||||||
| 1 | 17 | 38 | 06.10 | 44 | 03 | 31.6 | TYC 7896 3885 1a | |||
| 2 | 17 | 38 | 46.31 | 44 | 06 | 01.1 | HIP 86356b | |||
| 6 | 17 | 38 | 40.37 | 44 | 17 | 42.8 | TYC 7896 3812 1a | |||
| 7 | 17 | 36 | 51.68 | 44 | 20 | 06.8 | TYC 7896 2299 1a | |||
| a Høg et al. 1997, b Perryman et al. 1997 | ||||||||||
| NGC 6541 | ||||||||||
| 1 | 18 | 08 | 41.41 | 43 | 36 | 26.4 | 1.2 | 99 | a | 18.1 2.3 |
| 2 | 18 | 08 | 01.74 | 43 | 42 | 57.0 | 1.2 | 54 | a | 6.6 1.4 |
| O | (2000) | (2000) | ||||||||
| 1 | 18 | 8 | 41.41 | 43 | 36 | 26.4 | TYC 7911 112 1b | |||
| acenter of cluster unknown, b Høg et al. 1997 | ||||||||||
| NGC 6626 | ||||||||||
| 5 | 18 | 24 | 07.27 | 24 | 47 | 19.1 | 1.5 | 18 | 31.6 | 0.5 0.1 |
| 6 | 18 | 24 | 22.68 | 24 | 51 | 02.5 | 1.3 | 15 | 10.8 | 0.3 0.1 |
| 2 | 18 | 24 | 32.73 | 24 | 52 | 08.8 | 0.3 | 99 | 0.3 | 9.4 0.4 |
| 7 | 18 | 24 | 31.01 | 24 | 52 | 46.3 | 1.0 | 34 | 3.0 | 0.6 0.1 |
| 8 | 18 | 23 | 57.88 | 24 | 54 | 10.7 | 1.9 | 26 | 34.1 | 0.7 0.1 |
| 9 | 18 | 24 | 24.27 | 24 | 58 | 07.6 | 2.0 | 19 | 26.0 | 0.6 0.1 |
| 10 | 18 | 25 | 27.23 | 24 | 59 | 06.4 | 3.8 | 16 | 58.9 | 1.1 0.2 |
| 11 | 18 | 24 | 27.61 | 24 | 59 | 10.4 | 1.7 | 15 | 29.5 | 0.4 0.1 |
| 12 | 18 | 24 | 38.45 | 25 | 01 | 35.8 | 1.6 | 36 | 39.5 | 1.0 0.2 |
| X-ray sources near center; 3-source fit | ||||||||||
| 2a | 18 | 24 | 32.99 | 24 | 52 | 10.1 | 0.7 | 0.2 | 3.70.7 | |
| 2b | 18 | 24 | 32.66 | 24 | 52 | 07.0 | 0.7 | 0.4 | 4.00.7 | |
| 2c | 18 | 24 | 32.15 | 24 | 52 | 11.1 | 0.7 | 0.7 | 1.50.2 | |
| O | (2000) | (2000) | ||||||||
| 9 | 18 | 24 | 24.27 | 24 | 58 | 07.6 | TYC 6848 3536 1a | |||
| 2c | 18 | 24 | 32.01 | 24 | 52 | 10.7 | PSR B1821-24b | |||
| a Høg et al. 1997, b Taylor et al. 1993 | ||||||||||
| X | (2000) | (2000) | ML | cts/ksec | ||||||
| NGC 6656 | ||||||||||
| 3 | 18 | 35 | 50.90 | 23 | 46 | 49.9 | 2.8 | 48 | 7.5 | 3.8 0.5 |
| 9 | 18 | 36 | 48.70 | 23 | 48 | 08.7 | 2.0 | 17 | 5.8 | 0.9 0.2 |
| 4 | 18 | 36 | 24.79 | 23 | 54 | 35.6 | 0.8 | 36 | 0.3 | 0.8 0.2 |
| NGC 6809 | ||||||||||
| 8 | 19 | 40 | 42.45 | 30 | 56 | 28.6 | 1.3 | 57 | 3.3 | 1.6 0.2 |
| 9 | 19 | 40 | 08.21 | 30 | 58 | 53.2 | 1.5 | 15 | 0.8 | 0.5 0.1 |
| 11 | 19 | 40 | 43.70 | 30 | 59 | 03.3 | 2.1 | 21 | 3.4 | 0.9 0.2 |
| 13 | 19 | 39 | 55.52 | 31 | 02 | 04.9 | 0.9 | 38 | 1.6 | 0.7 0.1 |
| NGC 7099 36 19.2 | ||||||||||
| 1 | 21 | 41 | 4.71 | 22 | 50 | 27.7 | 4.2 | 99 | 375.6 | 58.3 4.3 |
| 3 | 21 | 39 | 23.47 | 22 | 55 | 53.3 | 8.1 | 39 | 334.1 | 8.8 1.7 |
| 8 | 21 | 40 | 22.39 | 23 | 10 | 41.9 | 2.9 | 90 | 1.7 | 8.0 1.4 |
| 13 | 21 | 39 | 58.37 | 23 | 21 | 1.6 | 6.5 | 17 | 193.7 | 2.7 0.9 |
| 9 | 21 | 40 | 8.90 | 23 | 23 | 43.5 | 6.4 | 32 | 222.0 | 5.7 1.3 |
| 2 | 21 | 40 | 15.62 | 23 | 39 | 31.8 | 3.8 | 99 | 480.3 | 168.5 7.5 |
3.2 NGC 288
The ROSAT HRI observation of this cluster was obtained on 1998 Jan 8-9, and has been published by Sarazin et al. (1999), who discover a source with a countrate of 1.60.4 cts ksec-1 in the core, at a distance of 12′′ from the cluster center. (With the exposure of about 20 ks, this means that about 30 counts were detected.) At the time of writing, the data are not public, so I have not reanalyzed them.
3.3 NGC 362
One HRI observation was made of NGC 362, in which two sources are detected. One of these, in the core of the cluster, is extended. Further analysis of this source with the multi-source detection code described in Sect. 2 shows that the central source consists of two components.
3.4 NGC 1261
NGC 1261 lies in the field of view of the two PSPC observations of the Marano Field, albeit outside the area analyzed by Zamorani et al. (1999). In the longer of the PSPC observations no source at the cluster position is found.
Two HRI observations of the cluster have been made. One source is detected in the shorter observation; a source is detected at this position in the longer observation with small significance. I have used this source to determine the offset between the two observations, and analyzed the combined image. Two sources, not related to the cluster, were detected.
3.5 Pal 2
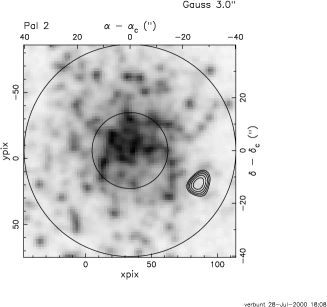
The ROSAT HRI observation of Pal 2 has been published by Rappaport et al. (1994), who detect a source at 6.5 core radii from the cluster center. I find no other significant sources in the observation, due to more stringent detection criteria than applied by Rappaport et al. (1994). The core radius of Pal 2, as listed in Harris (1996), is larger than the value used by Rappaport et al. (1994); the distance of the source to the cluster center thus becomes 2 core radii. As shown in Fig. 1, the distance of the source to the cluster center puts it well inside the half-mass radius of the cluster. I agree with the argument made by Rappaport et al. (1994) that the source is probably associated with the cluster (see Sect. 4.2).
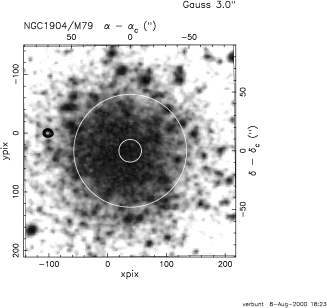
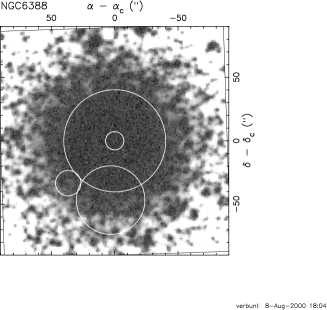
3.6 NGC 1904/M 79
One source is detected in the HRI observation of NGC 1904, well outside the half-mass radius (Fig. 1). I consider it likely that the source is associated with the cluster (see Sect. 4.2). The source was already detected, with positional accuracy of 60′′, by Hertz & Grindlay (1983) with the Einstein satellite.
3.7 NGC 3201
Only one PSPC observation is available, which has been published by Johnston et al. (1996). Due to my more stringent significance limits, I detect only three of the sources listed by Johnston et al., i.e. X 5, X 6 and X 7, and one new one. No source is detected in the cluster.
3.8 NGC 4372
Only one PSPC observation is available, which has been published by Johnston et al. (1996). Due to my more stringent significance limits, I detect fifteen of the sources listed by Johnston et al.; due to use of the newer (improved) version of EXSAS, seven new sources are detected. None of the sources is in the cluster.
3.9 NGC 4590/M 68
No source is detected in the one available HRI observation.
3.10 NGC 5053
Four sources are detected in the one available HRI observation; none in the cluster core.
3.11 NGC 5139/ Cen
The HRI observations of this cluster are described in Verbunt & Johnston (2000), who detect three sources in the core, the faintest of which may be a fore- or background source. The fluxes listed in Table 3 are those of source 9; for the HRI countrate I add the fluxes of sources 9a and 9b.
3.12 NGC 5272/M 3
Two ROSAT HRI observations of this cluster were discussed by Hertz et al. (1993), who detected a relatively bright, very soft X-ray source in the first observation of Janunary 1992, which had faded below the detection limit by July 1992. The source was also detected in the ROSAT All Sky Survey (Verbunt et al. 1995), and previously with the Einstein satellite (Hertz & Grindlay 1983). A complete overview of the ROSAT and ASCA observations of this remarkable source is given by Dotani et al. (1999), who discovered that the source has a 5 keV bremsstrahlung spectrum in its normal, low-luminosity state, and switches to a very soft (20 eV for a blackbody fit) spectrum only when in the high-luminosity state. I analyzed two HRI observations, viz. the longest one and the one in which the source was brightest. Three sources are detected in addition to the cluster source in both observations, and all of these may be identified with quasars, as already noted by Hertz et al. (1993) and Geffert (1998), who used their positions to determine the projection of the X-ray frame onto the optical sky. I repeat this determination, do it for the HRI images only, and separately for the January 1992 and July 1995 observations. In the 1992 observation, the bore sight correction has an uncertainty , and the position of the X-ray source on the frame has an uncertainty , leading to an overall uncertainty in the position of the cluster source . In the longer 1995 observation in which the cluster source is much fainter, and , so that . Thanks to the use of more accurate HRI positions, these accuracies are better than those achieved before by Hertz et al. (1993) and Geffert (1998). The positions listed in Table 2 are those of the 1995 observation, and take into account the shift which best brings the positions of B, C and E into accordance with their optical identifications. The positions of the 1992 observation are compatible with these. The source numbering is as in Hertz et al. (1993), except for Source G, which is a new source, not identical to source D listed by Hertz et al. (1993).
3.13 NGC 5286
As reported by Rappaport et al. (1994), the one HRI observation for this cluster detects no source in the cluster.
3.14 NGC 5466
Three HRI observations of this cluster were obtained. No source is detected in the core of the globular cluster in the individual observations, or in the added image. An offset PSPC observation also doesn’t detect a cluster source; the PSPC upper limit listed in Table 3 is the countate of a non-significant source detected at a distance of 1′ from the cluster center.
3.15 NGC 5824
No source is detected in either of the two HRI observations taken of this cluster; the upper limit given in Table 3 is from the 1994 observation. This is slightly below the Einstein detection at a level of erg s-1in the 0.5-4.5 keV range (Hertz & Grindlay 1983).
3.16 NGC 5904/M 5
In two short HRI observations of this cluster, no source is detected. I therefore combine only the two longer HRI observations; ten sources are detected in the resulting image, five (numbers 1-5 in Table 2) already given by Hakala et al. (1997), and five new ones (6-10). One source may be identified with a quasar, and one – as noted before on the basis of the Aug 1994 observation by Hakala et al. (1997) – with the dwarf nova V 101. (The position for V 101 listed in Table 2 is that given by Evstigneeva et al. 1995; Hakala et al. 1997 and SIMBAD each give slightly different coordinates.) The offset between the X-ray coordinates and the optical coordinates is determined from the two identified sources, and the result has been applied to give the coordinates listed in Table 2. Sources X 1 and X 2 are also detected in the rather short PSPC observation, which doesn’t provide additional information. The upper limits given in Table 3 are for a position in the core.
3.17 NGC 5986
The cluster is in the field of view of an HRI observation of the G6V star HIP 77358. The star, but not the cluster, is detected.
3.18 NGC 6093/M 80
The ROSAT PSPC observation of this cluster shows one source in the center, which may or not be the nova 1860 T Sco (Hakala et al. 1997). The ROSAT image contains many sources, from which I retain in Table 2 only those with nominal positional accuracy better than 10′′. Three sources with good X-ray positions can be identified with stars. Two of these X-ray sources, those identified with the T Tau star VV Sco (an M1 star with , X 1) and with HD 146516 (a G1 V star with , X 14) are listed as extended by the EXSAS software. I therefore determine the offset between X-ray and optical coordinates from X 7 only, identified with HD 146457 (an A5III/IV star with ). The offset is applied to the X-ray positions, and the resulting positions are listed in Table 2. The uncertainties in the source positions as listed in the Table are the nominal uncertainties for the detector position only; to these must be added in quadrature the random uncertainty in positions for PSPC sources of 3′′, which remains even after a bore sight correction has been applied (Hasinger et al. 1998). The uncertainty in the bore sight correction thus is (assuming a 1′′ error in the optical position). The offset between the central source X 10 and T Sco is , and the identification is possible. The core radius of NGC 6093 is about 9′′, and the uncertainty of the position of X 10 is such that it could be identified with any source located in the cluster core. I consider the identification of X 10 with T Sco to be unproven.


3.19 NGC 6121/M 4
Two ROSAT PSPC observations have been obtained of this cluster, one of which was published by Johnston et al. (1996). Six sources were detected. No source is detected in the cluster core in either PSPC observation. Johnston et al. list 6 X-ray sources, one of which they identify with the variable V972 Sco HD 147491 HIP 80290, a G0 V star with . The Hipparcos catalogue lists the star as a suspected binary. This source is also detected in each of the three ROSAT HRI observations obtained of NGC 6121. No source is detected in the cluster core in individual HRI observations; I have combined the two longer observations, and detect a marginally significant source in the core. The position of the X-ray frame is fixed with help of X 3/HD 147491, and the uncertainty of the core source is dominated by the uncertainty in its position on the detector. To avoid confusion with the sources in Johnston et al. (1996) I number the new sources as X 7-10.
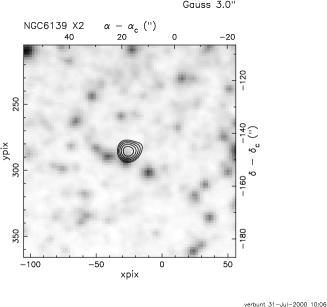
3.20 NGC 6139
The short ROSAT HRI observation of this cluster has been published by Rappaport et al. (1994); no source is detected in it. No source is detected at the cluster position in two ROSAT PSPC observations pointed at white dwarf WD 1620391; due to the large offset, the upper limit obtained from these PSPC observations is not as good as that from the ROSAT All Sky Survey. I find two sources in the longer, hitherto unpublished HRI observation; one of these is in the cluster core. The other one has no bright () counterpart, but the Digitized Sky Survey provides several candidate counterparts, as shown in Fig 1. Spectroscopic confirmation of any of these would provide improved accuracy in the position of the cluster source, by determining the bore sight correction.
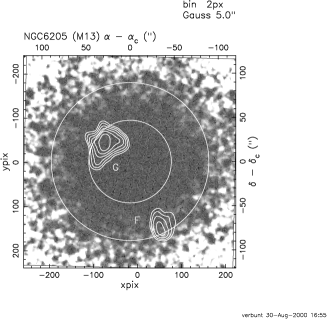
3.21 NGC 6205/M 13
A ROSAT HRI observation and two PSPC observations of this cluster were analyzed by Fox et al. (1996). The new analysis of the HRI observation gives essentially the same sources, at slightly different positions due to the new value for the pixel scale. One new source, R, is detected. Sources F, Q and S are not significant in the HRI according to the ML13 criterium, but are listed because they are significantly detected in the PSPC. F, within the half-mass radius, and S are new sources. A comparison between the sources detected with the two detectors is shown in Fig. 2. Outside the area analyzed by Fox et al. (1996), one source, listed as T in Table 2, has a relatively accurate position.
None of the sources listed in Table 2 has an optical counterpart in SIMBAD; inspection of the Digitized Sky Survey images gives several candidate identifications, including a star of 13.1 with X R and an extended source (galaxy?) of with X T. All other X-ray sources have counterparts with . Since X T is outside the HRI field of view, I determine the bore sight corrections as follows. Comparison of the positions of the sources common to PSPC and HRI shows that a correction of added to the PSPC positions brings them in line with the HRI positions. If the identifications for X R and X T are correct, a correction of added to the PSPC coordinates brings them to the optical coordinates. Thus a correction of must be added to the HRI coordinates listed in Table 2 to bring them to J 2000. This correction, with its error circle of radius , is indicated in Figure 2. The positions given in Table 2 are uncorrected HRI positions, because I consider the suggested optical identifications too uncertain; the positions of X F and X T, found in the PSPC only, have been corrected to the HRI frame.
The multiple-source algorithm detects two significant sources in the cluster core, labelled as Ga and Gb in Table 2. Gb is the 3.5- source noted by Fox et al. (1996), labelled G-SE by Ferraro et al. (1997). Given the uncercainty of the bore sight correction, the position of star 23081 is compatible with Ga, and the position of star 21429 with Gb. However, the distance between the positions of stars 23081 and 21429 is not compatible with the distance between Ga and Gb. Thus, if we accept the identification of star 21429 with Gb, star 23081 cannot be identified with Gb, and vice versa. The optical identifications of X R and X T result in the bore sight correction indicated with an arrow in Fig. 2, which would exclude the identifications of star 23081 with Ga and of star 21429 with Gb.
The PSPC spectrum of source G, which includes counts of both Ga and Gb, is adequately fitted by a bremsstrahlung spectrum, as shown in Fig. 3. The background spectrum was determined from a circle located north-west of the source, to avoid source F.
3.22 NGC 6254/M 10
The ROSAT PSPC observation of this cluster has been published by Johnston et al. (1996), and doesn’t show a source in the cluster core. I detect two sources in addition to those found by Johnston et al. (1996).
![[Uncaptioned image]](/html/astro-ph/0012261/assets/x9.png)
![[Uncaptioned image]](/html/astro-ph/0012261/assets/x10.png)
![[Uncaptioned image]](/html/astro-ph/0012261/assets/x11.png)
![[Uncaptioned image]](/html/astro-ph/0012261/assets/x12.png)
![[Uncaptioned image]](/html/astro-ph/0012261/assets/x13.png) Figure 3: ROSAT PSPC spectra of the central sources in globular clusters
(, indicating width of the energy bin and 1- error in countrate),
with background (), and the best bremsstrahlung fit
(smooth line). For NGC 104 and NGC 6341 the absorption is higher than
expected on the basis of the visual absorption towards the
cluster. The fit for the NGC 104 data is not acceptable, possibly because
the data combine spectra of several sources, possibly because bremsstrahlung is
not a good description of the cluster source spectra.
Figure 3: ROSAT PSPC spectra of the central sources in globular clusters
(, indicating width of the energy bin and 1- error in countrate),
with background (), and the best bremsstrahlung fit
(smooth line). For NGC 104 and NGC 6341 the absorption is higher than
expected on the basis of the visual absorption towards the
cluster. The fit for the NGC 104 data is not acceptable, possibly because
the data combine spectra of several sources, possibly because bremsstrahlung is
not a good description of the cluster source spectra.
3.23 NGC 6266/M 62
Two PSPC observations of the low-mass X-ray binary, burster and transient, MXB 165929 contain this globular cluster in the field of view. The transient is not detected in either observation, but the globular cluster is in both! (The upper limit to the countrate of MXB 165929 in channels 50-240 is 0.6 cts ksec-1 in 1991, 0.9 cts ksec-1 in 1992; for cm-2– as determined from the X-ray spectrum during the active stage by Wachter et al. 2000 – and an assumed 0.3 keV blackbody spectrum – typical for a quiescent transient – the 1991 limit corresponds to an upper limit to the luminosity in the 0.5-2.5 keV band of about erg s-1at 10 kpc.) The countrate and spectrum of the cluster source is not significantly different between the 1991 and 1992 observations. I therefore analyse the spectrum of the combined image. As shown in Fig. 3, the spectrum is soft, and affected by strong absorption. Fixing the absorption column at cm-2, as indicated by the visual absorption of the cluster, I find that a bremsstrahlung spectrum of 0.950.17 keV describes the spectrum; the observed countrate corresponds to a luminosity in the 0.5-2.5 keV range of erg s-1at the distance of 5 kpc of the cluster. Thus spectrum and luminosity of the source are similar to what is observed in soft X-ray transients with a neutron star in quiescence (e.g. Aql X-1, Verbunt et al. 1994).
Two sources in the field of view and with well determined positions of the ROSAT PSPC have an counterpart at other wavelengths: X 8 with the radio source PKS 1657298 and X 12 with the star TYC 7360 394 1 (CD-29 13096), a binary with . The positions of the X-ray sources coincide within 3′′ and 1′′ with the Parkes radio source and Tycho Catalogue object, respectively. Since both X 12 and the cluster source X 14 are indicated to be extended sources by the EXSAS software in the individual 1991 and 1992 images, the actual accuracy of the position may be worse than the positional coincidences suggest; and I have not applied a bore sight correction based on these identifications. Confirmation that both sources are extended would be interesting, both for the binary and for the cluster source.
3.24 NGC 6273/M 19
The ROSAT HRI observation of this cluster has been published by Rappaport et al. (1994); no source is detected in it.
3.25 NGC 6293
Two PSPC observations of the cataclysmic variable V 2051 Oph have this cluster near the edge of the detector; a bright source about 10′ from the cluster prevents the determination of a useful upper limit. This bright source has a countrate of about 2.5 cts s-1, and probably is identical to 1RXS 170930.2263927. The pointed observations, as well as the Survey, indicate that the source is extended. Its spectrum is absorbed, all its counts detected in channels 50-240, i.e. at energies keV. SIMBAD gives IW Oph, also known as (Harvard Variable) HV 4409 as a possible counterpart, whose nominal position – with 1′ uncertainty – is compatible with the X-ray source; however, inspection of the finding chart in Swope (1932) shows that HV 4409 is too far from the X-ray position to be an acceptable counterpart for the X-ray source.
3.26 NGC 6304
I confirm the number of counts detected in this cluster by Rappaport et al. (1994); but consider them as representing an upper limit rather than a detected source, since no significant source is detected in the cluster by EXSAS, or by my own multi-source software. The upper limit is given in Table 3.
3.27 NGC 6316
No source is detected in the ROSAT HRI observation of this cluster, as pointed out by Rappaport et al. (1994).
3.28 NGC 6341/M 92
A short PSPC observation of this cluster has been published by Johnston et al. (1994), and longer HRI and PSPC observations by Fox et al. (1996). I analyze the two HRI observations separately, determine the offset between them, and then analyze the co-added image, to find positions which differ markedly from those listed in the earlier papers.
In agreement with Geffert (1998) I identify two X-ray sources in the HRI field of view with optical objects, viz. X E with the W UMa variable V798 Her (V 14 of Hachenberg 1939), whose accurate position is given by Tucholke et al. (1996), and X 10 with TYC 3081 510 1 from the Tycho Catalogue which also has an accurate position. The binary period of V798 Her is 0.346 d, and from this I estimate ; with the observed magnitude a distance of order 1 kpc follows, and the observed countrate then corresponds to a luminosity between 0.1-2.4 keV erg s-1, quite reasonable for a contact binary (see, e.g. McGale et al. 1996). X E is detected only in the longest PSPC and in the longest HRI observation; compatible with a constant flux. Geffert (1998) suggests on the basis of its colour that TYC 3081 510 1 is a G star; it would then have an X-ray luminosity high but not unreasonable for a G main sequence star (see Table 5). Its X-ray flux increases by about 40% between April 1994 (HRI countrate 25.61.3 cts ksec-1) and April 1995 (HRI countrate 43.24.1 cts ksec-1); its countrates in the long PSPC observation of 1992 are 54.8 1.1 and 106.71.6 cts ksec-1 in channels 50-240 and 11-240, respectively; the large countrate in the lower channels indicates that interstellar absorption is low, as expected for a stellar X-ray spectrum at the small distance of the optical counterpart. Thus, the X-ray countrates are compatible with the suggested identifications for X E and for X 10.
From these two objects I determine the offset – given in Table 1 – between the X-ray coordinates and the optical coordinates, and apply this to the X-ray coordinates to obtain the positions given in Table 2. The source numbering in the Table is after Johnston et al. (1994) and Fox et al. (1996). The offset determination is dominated by X 10, because of its accurate position on the X-ray detector (error in Table 2). The estimated errors in the offset are in right ascension and in declination; combining these with the error in the position on the detector of source X 8, I estimate that the position of X 8 is accurate to , comparable to the accuracy obtained by Geffert (1998). Note, however, that for non-identified sources the HRI positions given in Table 2 are more accurate than those given by Geffert (1998), which were based on PSPC positions.
The PSPC countrate of X 8 is 3.00.7 cts ksec-1 (channels 50-240) in the short PSPC observation, compatible with expectation on the basis of its HRI countrate; during the long PSPC observation it is substantially higher, at 6.50.4. The source also has an appreciable countrate in the softer channels, and a bremsstrahlung fit is shown in Fig. 3. If we set cm-2, as estimated from the visual absorption of the cluster, we cannot obtain a good fit; the absorption to X 8 requires cm-2. The spectrum is soft, with a bremsstrahlung temperature keV.
It should be noted that the identification of X 8 (called source C in Fox et al. 1996) with an ultraviolet object UV 8203 by Ferraro et al. (2000) is based on the old, inaccurate positions of Fox et al. (1996), which are incompatible both with the improved positions of the PSPC sources by Geffert (1998) and of the HRI sources in this paper. These positions indicate that the proposed identification is not acceptable.
3.29 NGC 6352
In re-analyzing the PSPC observation of this cluster I confirm the absence of a source in the cluster core, and note that source X 4 of Johnston et al. (1996) is within the half-mass radius of the cluster. I also confirm (with X-ray positions improved by the new analysis software) the identity of X 9 with HD 157522 (HIP 85326) and X 10 with HD 157555 (HIP 85342). HD 157522 is a K1 V star at 47 pc. HD 157555 is a F6-7V star at 46.5 pc. The X-ray luminosities of both stars are erg s-1, as expected for such stars (see Table 5 and Fig. 8).
These two identifications are used to determine the bore sight correction, as listed in Table 1, leading to the positions given in Table 2. I only list sources with positional accuracy better than 10′′; numbers up to 17 are those of Johnston et al. (1996), source X 17 is new. The accuracy of the bore sight correction is . At its low countrate and large () distance from the cluster center, X 4 may well be a fore- or background object (Sect. 4.2); its positional accuracy is dominated by its , as given in Table 2.
3.30 NGC 6366
The one PSPC observation of this cluster was published by Johnston et al. (1996), who detect 6 sources in channels 11-240; I confirm their results, and detect two new sources by limiting the analysis to channels 50-140. These sources are listed as no.s 7,8 in Table 2. A faint source is detected in the core of the cluster, with a rather uncertain position.
The brightest source in the field of view is the F3V star HD 157950 (HIP 85365), already detected as an Einstein source and in the ROSAT All Sky Survey. Its distance is 30 pc, and it is a binary with a period of 26.2765 d, eccentricity , and radial velocity semi-amplitude km/s (orbit by Parker 1915, listed as good but not definitive by Batten et al. 1989). This source was used to determine the bore sight correction given in Table 1. The uncertainty in the bore sight correction is about 3′′.
3.31 HP 1/ESO 455-11
A short HRI observation of this highly reddened, collapsed cluster shows only one source, not related to the cluster.
3.32 NGC 6380
A short HRI observation, reported by Rappaport et al. (1994), shows no source in the cluster core.
3.33 NGC 6388
This cluster is in the field of view of two PSPC observations, one pointed at the bright low-mass X-ray binary 4U173544, and a rather shorter one pointed at Gliese 682. A source near the globular cluster is detected in both observations. I have analysed part of the field-of-view of the 1991 observation, and determine the bore-sight correction on the basis of identifications of X 1 with TYC 7896 3885 1 and of X 2 with HIP 86356. Applying this correction I obtain the positions listed in Table 2. The resulting position of X 5 is just outside the half-mass radius of NGC 6388 (see Fig. 1), and has a positional uncertainty of 10′′. Thus the source may or may not be related to the cluster.
The 1992 observation contains three sources with accurate detector positions: X 1 and two sources that may be identified with TYC 7896 3812 1 and TYC 7896 2299 1 respectively. With the bore sight determined from these three sources I obtain a position for X 5 which is compatible with that from the 1991 observation, but with a much larger error of about 30′′ (Table 2).
If X 5 belongs to NGC 6388, its soft photons should be absorbed. The countrate over the full PSPC range of channels 11-140 indeed is not higher than that in the hard range channels 50-240 only (listed in Table 2), as expected for a cluster member. X 5 is variable, being about 50% brighter in 1992 than in 1991. When fitted with a brems strahlung spectrum, and fixing at the value suggested by of the cluster, i.e. cm-2, the temperature is found to be keV, and the source luminosity between 0.5-2.5 keV is erg s-1in 1991.
In contrast, X 1 and X 2 have countrates in channels 11-240 higher than their countrates in channels 50-240, as expected for foreground stars. TYC 7896 3812 1 may be a G5 V star at about 100 pc, with an X-ray luminosity at the highest end of the distribution among nearby G5 V stars (Table 5). HD 159808 (HIP 86356) is a binary with spectral type F5 V, which with 8.12 puts its at about 100 pc (spectroscopic parallax), compatible with the astrometric parallax which converts to a distance of 15040 pc. Its X-ray luminosity is at the high end of the distribution of X-ray luminosities for nearby F5 V stars (Table 5). TYC 7896 3812 1 could be a K1 V star at 75 pc, with an X-ray luminosity of erg s-1. The X-ray counterpart of TYC 7896 2299 1 has no photons at soft energies, indicating that some interstellar absorption is present. Its colour indicates spectral type earlier than K5 V at a distance larger than 36 pc (Table 5). The X-ray luminosities derived for all proposed optical counterparts are as expected for such stars. Foreground stars X 1 and X 2 are both fainter in 1992 than in 1991, by 30% and 40%, respectively.
3.34 Djorg 1
This cluster is in the field of view of an HRI observation of RX J1748.93254, but is not detected.
3.35 Terzan 6
The transient in this cluster was detected in outburst during the ROSAT All Sky Survey (Predehl et al. 1991, Verbunt et al. 1995); but not detected in an HRI pointing obtained in March 1992 (Rappaport et al. 1994). The latter observation thus provides an upper limit for dim sources in this cluster.
3.36 NGC 6453
The HRI observation made of this cluster shows no source near the cluster, as already reported by Rappaport et al. (1994). I have analysed a PSPC observation of the open cluster NGC 6475/M 7 (published by James & Jeffries 1997) and from it find an upper limit at the position of the cluster center, which is equal to the detected rate for a source located 2′ away from it.
3.37 NGC 6496
I confirm the absence of a cluster source in the PSPC observation reported by Johnston et al. (1996). Note that the upper limit in the hard band, as given in Table 3, is lower than that for the total band given by Johnston et al. (1996).
3.38 NGC 6522 and NGC 6528
A marginally significant (ML12.5) source near NGC 6522 is detected at , in a PSPC observation of Baade’s window, well outside the core radius, but inside the half-mass radius. The uncertainty in the source position is about 10′′. The source is not detected in an analysis of all energy channels (11-240), showing up only in the hard band (channels 50-240). The upper limit given in Table 3 for a source in the core is the countrate of this source. NGC 6528 is in the field of view of the same PSPC observation, but it is not detected. Its much improved upper limit is listed in Table 3.
3.39 NGC 6540/Djorg 3
This cluster is in the field of view of a PSPC observation. A source is detected at , , 45′′ from the cluster center, but it has a significant countrate in the soft channels, and thus must be a foreground object, because the cluster is highly absorbed. The upper limit given in Table 3 is the countrate of this source.
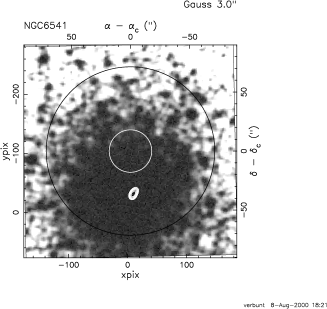
3.40 NGC 6541
Two sources are detected in the HRI observation of this cluster, one near the cluster center. The latter source is probably identical to the source detected near NGC 6541 with the Einstein satellite (Hertz & Grindlay 1983). X 1 may be identified with TYC 7911 112 1, possibly a K2 V star at a distance of about 65 pc (Table 5). The position of this source is used to determine the bore sight correction. The coordinates of the cluster center as given by Djorgovski & Meylan (1993) suggest that X 2 is outside the cluster core, but overlaying the X-ray image on the Digitized Sky Survey shows that it is, in fact, near the cluster center, as illustrated in Fig. 1.
3.41 NGC 6544
No source near the cluster is detected in the PSPC observation of this cluster, as already reported by Johnston et al. (1994).
3.42 NGC 6553
The PSPC observation of RXJ 1806.826.06 which has this cluster in the field of view shows no source at the position of the cluster.
3.43 Ter 11
The cluster is in the field of view of a PSPC observation of G8.31.7, from which the upper limit given in Table 3 is found.
3.44 NGC 6626/M 28


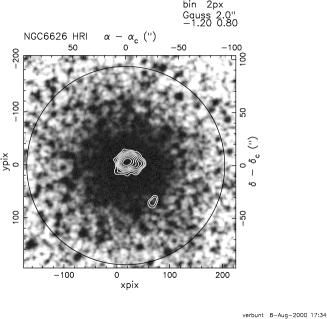

The PSPC observation of this cluster has been published by Johnston et al. (1994), who detect four sources, two – X 1 and X 2 – near the cluster core. I will show that X 1 and X 3 are spurious. Danner et al. (1994) claimed to detect the pulse period of PSR B182124 in X 2. I will show that this pulse detection is spurious. The actual detection of pulsed emission from NGC 6626 must be credited to Saito et al. (1997), who used ASCA data. A long ROSAT HRI observation was obtained by Danner et al. (1997), who show that X 2 is a multiple source, and that the pulsed source is off center. Their preliminary analysis assigns one third of the flux of X 2 to the pulsar; a detailed analysis below shows that the actual pulsar flux is lower.
3.44.1 NGC 6626 PSPC observations
The PSPC data were obtained on March 11 (effective exposure of 1911 s) and on March 16 (1423 s). Analyzing the data of these two days separately, I find that X 1 is present on March 11 but not on March 16; and that X 2 is present on March 16 but not on March 11, as illustrated in Fig. 4. I conclude from this that the two halves of the total exposure are offset with respect to one another, and that X 1 and X 2 are in fact the same source. This is supported by the fact that their countrates are the same: 21.13.6 cts ksec-1 for X 1 on March 11 and 18.43.8 cts ksec-1 for X 2 on March 16. (There is no other source in the field of view with which the shift can be confirmed independently.) The 13 counts analysed by Danner et al. (1994) for March 11 are background photons, not related to X 2. This statement is further supported by the facts, illustrated in Fig. 4, that a) the distribution of the photons of X 2 on March 11 doesn’t follow the point spread function, and b) the background map for March 11 predicts 9 background photons in an extraction circle with a radius of 45′′, as used by Danner et al. (1994). Even if we assume with Danner et al. (1994) that there were no offset, and with less than a third of the counts of X 2 being due to the pulsar, it follows that only 1 or 2 of the 13 photons would belong to the pulsar. Clearly the pulse detection in these data by Danner et al. (1994) is spurious. Fig. 4 shows the 13 background photons folded on the pulsar epheremis and confirms the result by Danner et al. (1994) that one of five bins used contains 8 photons. (The figure in fact shows 14 photons from a slightly larger extraction radius; this doesn’t affect the discussion below.) With 13 photons distributed randomly over five bins, the binomial probability of finding a bin with 8 or more photons is 0.006, a factor 20 higher than the probability obtained by Danner et al. (1994) ’through a Monte Carlo simulation’.
I conclude that source X 1 from Johnston et al. (1994) is an image of X 2, and does not exist as a separate source. Source X 3 is not detected in the separate observations of March 11 and March 16, and I consider it spurious as well. The correct countrate for X 2 is found from the sum of the counts of X 1 and X 2 as given by the standard analysis. This corrected rate is given in Table 3.
3.44.2 NGC 6626 HRI observations
Four HRI observations of this cluster have been obtained. The 1995 observation has been published by Danner et al. (1997), who show that the central source X 2 is multiple. In analyzing this observation I detect 3 sources in addition to the central source, but these sources are not detected in the remaining three, shorter HRI observations. To add the images, I therefore used the position of the central, extended source; this implies the assumption that the X-ray center of this source doesn’t vary. The shifts applied to align the three shorter images with the longer one are given in Table 1. The co-added image contains 9 significant sources, including the central source X 2 and the three additional sources already detected in the first HRI observation, i.e. X 5, X 9 and X 12. These three sources have higher significance in the co-added image than in the first observation only, and improved positional accuracy, which indicates that the addition of the images is correct.
X 9 can be identified with HD 315622 (TYC 6848 3536 1) and this star is used to correct the X-ray coordinates, giving the positions listed in Table 2. The right ascension and declination of X 9 determined for only 1995 data and for the total image differ by and , respectively, from which I conclude that the coordinate frame of the total image is accurate to about 2′′. No significant variability of the flux of X 9 is indicated by the non-detection of this source in the three shorter HRI observations, which may be explained with the shorter exposure times.
The central source X 2 is significantly variable between the first HRI observation, in which the countrate is 11.8 0.6 cts ksec-1 and the remaining three observations, in which the countrates are 7.71.4, 6.50.5 and 7.71.0 cts ksec-1, respectively. X 7 is a source outside the core but within the half-mass radius; it is variable, with a countrate of 0.30.1cts ksec-1 in 1995 and 0.80.2cts ksec-1 in 1996 Sep. X 2 and X 7 are shown superposed on the optical image in Fig. 4.
The multiple-source fit to the central 5050′′ gives a total of three significant sources, with positions and countrates as listed in Table 2. An image is given in Fig. 4. Multiple-source fits to only the 1995 data and to only the 1996 Sep data give source positions compatible with those for the fit to the co-added total data. X 2a is significantly variable, with countrate 6.20.6 cts ksec-1 in 1995 and 1.60.5 cts ksec-1 in 1996 Sep, respectively, in agreement with the observed variation in the total countrate of X 2. The added countrates of sources X 2a-c are compatible with the single-source countrates determined for X 2 by the standard analysis.
The position of X 2c coincides within the error with PSR B1821-24, taking into account the overall uncertainty of 2′′ in the bore sight correction. The multiple-source fits indicate that the pulsar has a countrate of 1.50.2 cts ksec-1, contributing about 17% of the photons of X 2.
3.45 NGC 6638
Two PSPC observations have this cluster in the field of view; the best upper limit, given in Table 3, is from the longer observation.
3.46 NGC 6642
Two PSPC observations have this cluster in the field of view. No source is detected in the cluster. The upper limit from the observation pointed at the cluster, reported by Johnston et al. (1994), is not improved by the longer observation pointed at an offset.
3.47 NGC 6656
A source in the core of this cluster has been found with the PSPC, as reported by Johnston et al. (1994). Three sources are detected in the longer HRI exposure. Two of these are X 3 and X 4 of Johnston et al., identical to the Einstein sources A and B detected near this cluster by Hertz & Grindlay (1983). X 4/B is in the cluster core. The HRI observations indicate that X 3/A is extended, as already found from the Einstein data (Hertz & Grindlay 1983). The positions of these sources as provided by the HRI are more accurate than the PSPC positions, but the absence of an optical identification leaves the overall uncertainty rather large, at 5′′ (1-).
If X 4/B is associated with the cluster its X-ray spectrum should be absorbed. Indeed, the PSPC countrate in channels 10-240 is 6.61.1 cts ksec-1, compatible with the countrate given in Table 2 for the hard band only (channels 50-240). The HRI countrate is rather lower than one would expect on the basis of the PSPC countrate, by about a factor three. The upper limit of the shorter HRI observation is compatible with the detected countrate in the longer HRI observation, which indicates that the source dropped in luminosity between the PSPC observation in March 1991 and the first HRI observation of September 1992.
3.48 NGC 6715
The cluster is in the field of view of a PSPC observation of the cataclysmic variable V1223 Sgr, but it is not detected. Due to the large offset, the upper limit from the ROSAT All Sky Survey is but little improved upon.
3.49 NGC 6723
The cluster has been observed twice with the HRI and is in the field of view of several PSPC observations, of which I have analysed only the longest one, which has the smallest offset. The cluster is detected in none of these images. The HRI upper limit given in Table 3 is based on the co-added image.
3.50 NGC 6760
The globular cluster is the target of one PSPC observation, and in the field of view of two pointings at the transient X-ray source Aql X-1 (Johnston et al. 1996). The upper limit in Table 3 is from the co-added image of the two offset PSPC observations.
3.51 NGC 6779
The cluster is not detected in the single HRI observation made of it.
3.52 NGC 6809/M 55
The PSPC observation has been published by Johnston et al. (1996); four sources detected with the PSPC are also found with the longer HRI oservation. One of these, X 9, is within the (large) cluster core, and may belong to the cluster. The HRI positions are more accurate than the previously published positions based on the PSPC, but in the absence of an optical identification the bore sight cannot be determined accurately.
3.53 NGC 6838/M 71
Two HRI observations have been made, pointed at the globular cluster. Ten sources are detected, none within the half-mass radius of the cluster in the separate observations, nor in the added image. A PSPC observation pointed at 9 Sge has NGC 6838 in its field of view. No source is detected at the position of the cluster.
3.54 NGC 7089/M 2
The cluster is not detected in the single HRI observation made of it.
3.55 NGC 7099/M 30
This cluster is the target of two PSPC observations, and in the field of view of a much longer observation of the galaxy cluster MS 2137.32353. A source in the globular cluster is detected in all three observations, at countrates consistent with a constant value. The numbers given in Table 2 are from the combined image of the shorter observations directed at the cluster. One new source, X 13 not related to the cluster, is detected with respect to the analysis by Johnston et al. (1994). The cluster source has a countrate in channels 11-240 of 11.01.8cts ksec-1, higher than in the hard channels only (Table 2); this indicates a soft spectrum. With cm-2, as estimated from the visual reddening of the cluster, a bremsstrahlung spectrum of keV gives the observed ratio of countrates.
3.56 NGC 7492
The cluster is in the field of view of a PSPC observation of Gliese 890, but is not detected.
4 Discussion
The results of the analysis of the ROSAT data of globular clusters that do not contain a bright X-ray source, i.e. that only contain dim sources if any, are summarized in Tables 3 and 4. I have added to these Tables the results for NGC 5139 ( Cen), NGC 6397, NGC 6752, and Liller 1 from Johnston & Verbunt (2000) and for NGC 6440 from Verbunt et al. (2000). The PSPC countrates of the central sources in NGC 6397 and NGC 6752 are obtained from a reanalysis of the observations discussed in Johnston et al. (1994). In this final section of the paper I compare the ROSAT results with the Einstein observations, and then discuss the probability of spurious identifications, the spectra, and the luminosity distribution of the dim sources.
4.1 Comparison with Einstein observations

All eight clusters near which a low-luminosity source was discovered with the Einstein satellite have been observed with the ROSAT HRI; three have been observed with the ROSAT PSPC. The more accurate positions obtained with ROSAT shows that all sources are within the cluster core, with the exception of the source near NGC 1904, which is well outside the core. Figure 5 shows the comparison between the Einstein IPC countrates (from Table 4 of Hertz & Grindlay 1983) and the ROSAT countrates as given in Table 3 (Table 2 for NGC 1904). The three PSPC observations all resulted in a detection, at a countrate (in channels 50-240) similar to the Einstein countrate. This is remarkable, given that at least two of these clusters show variable X-ray luminosities: NGC 104 (Verbunt & Hasinger 1998) and NGC 6656 (Sect. 3.47 above). Seven of the HRI observations detect the Einstein source. Of these five detect the source at an HRI countrate roughly half that of the Einstein IPC countrate, as expected for a constant source, or slighly below it. Two exceptions are the variable sources in NGC 5272 and NGC 6656 (see Sects. 3.12 and 3.47 above). The source in NGC 5824 is not detected with the HRI, and apparently was at a lower luminosity when ROSAT observed it in 1991 and 1994 than during the Einstein observation.
| cluster | PSPC | HRI | RASS | PSPC | HRI | |
|---|---|---|---|---|---|---|
| NGC 104 | 120.7 | 49.4 | 33.59 | 33.56 | 33.47 | 6’ |
| NGC 288 | 1.6 | 32.91 | 32.49 | 0’ | ||
| NGC 362 | 2.8 | 32.95 | 32.81 | 2’ | ||
| NGC 1261 | 2.3 | 0.9 | 33.48 | 32.94 | 32.72 | 2’ |
| Pal 2 | 0.8 | 34.80 | 34.06 | 1’ | ||
| NGC 1904 | 2.7 | 33.22 | 33.00 | 1’ | ||
| NGC 3201 | 2.8 | 32.52 | 32.19 | 3 | ||
| NGC 4372 | 0.2 | 32.84 | 31.24 | 12 | ||
| NGC 4590 | 1.0 | 33.28 | 32.52 | 0’ | ||
| NGC 5053 | 1.3 | 33.38 | 33.02 | 4’ | ||
| NGC 5139 | 5.5 | 2.0 | 32.58 | 32.42 | 32.36 | 12’ |
| NGC 5272 | 146.3 | 33.47 | 34.54 | 5’ | ||
| NGC 5286 | 1.4 | 33.82 | 32.96 | 2’ | ||
| NGC 5466 | 1.6 | 0.7 | 33.38 | 32.81 | 32.57 | 4’ |
| NGC 5824 | 2.1 | 34.49 | 33.97 | 0’ | ||
| NGC 5904 | 3.4 | 0.4 | 32.87 | 32.45 | 31.79 | 9’ |
| NGC 5986 | 3.1 | 33.23 | 33.29 | 0’ | ||
| NGC 6093 | 3.3 | 33.49 | 32.80 | 16 | ||
| NGC 6121 | 2.1 | 0.5a | 32.13 | 31.41 | 31.20a | 4’ |
| NGC 6139 | 18.1 | 1.4 | 33.67 | 33.88 | 33.19 | 2’ |
| NGC 6205 | 2.4 | 2.0 | 32.83 | 32.31 | 32.47 | 12’ |
| NGC 6254 | 1.6 | 32.54 | 31.84 | 9 | ||
| NGC 6266 | 22.1 | 33.48 | 33.48 | 9 | ||
| NGC 6273 | 1.7 | 33.46 | 32.93 | 0’ | ||
| NGC 6304 | 2.2 | 33.34 | 32.82 | 1’ | ||
| NGC 6316 | 1.2 | 33.68 | 33.06 | 1’ | ||
| NGC 6341 | 6.5 | 1.4 | 32.69 | 32.81 | 32.38 | 7’ |
| NGC 6352 | 1.2 | 33.02 | 31.90 | 10 | ||
| NGC 6366 | 2.5 | 32.40 | 32.10 | 8 | ||
| HP 1 | 2.9 | 33.59 | 33.44 | 1’ | ||
| Liller 1 | 0.6 | 34.47 | 33.55 | 1’ | ||
| NGC 6380 | 1.4 | 33.91 | 33.44 | 3’ | ||
| NGC 6388 | 18.0 | 33.62 | 33.80 | b | ||
| NGC 6397 | 26.8 | 7.8 | 32.47 | 32.43 | 32.29 | 14’ |
| Djorg 1 | 2.9 | 33.79 | 33.79 | 1’ | ||
| NGC 6440 | 2.9 | 33.46 | 33.51 | 2’ | ||
| Terzan 6 | 1.6 | 36.06 | 33.72 | 1’ | ||
| NGC 6453 | 4.7 | 2.9 | 33.54 | 33.31 | 33.52 | 2’ |
| NGC 6496 | 0.7 | 33.80 | 32.23 | 5 | ||
| NGC 6522 | 1.3 | 33.53 | 32.36 | 15 | ||
| NGC 6528 | 1.0 | 33.73 | 32.43 | 15 | ||
| NGC 6540 | 11.5 | 32.81 | 32.72 | b | ||
| NGC 6541 | 6.7 | 33.66 | 33.16 | 2’ | ||
| NGC 6544 | 2.2 | 32.66 | 31.77 | 1 | ||
| NGC 6553 | 9.9 | 33.34 | 33.10 | b | ||
| Terzan 11 | 1.3 | 33.35 | 32.56 | b | ||
| NGC 6626 | 19.5 | 11.8 | 33.32 | 33.25 | 33.44 | 9’ |
| NGC 6638 | 1.9 | 33.52 | 32.55 | b | ||
| NGC 6642 | 2.5 | 33.20 | 32.60 | b | ||
| NGC 6656 | 5.9 | 0.8 | 32.31 | 32.18 | 31.72 | 3’ |
| NGC 6715 | 10.0 | 34.30 | 34.13 | b | ||
| NGC 6723 | 2.6 | 1.0 | 33.07 | 32.49 | 32.40 | 3’ |
| NGC 6752 | 14.7 | 3.6 | 32.74 | 32.55 | 32.24 | 13’ |
| NGC 6760 | 0.6 | 33.32 | 32.14 | b | ||
| NGC 6779 | 0.5 | 33.31 | 32.41 | 1’ | ||
| NGC 6809 | 1.2 | 0.5 | 32.44 | 31.74 | 31.71 | 4’ |
| NGC 6838 | 2.5 | 0.3 | 32.37 | 31.92 | 31.41 | 10’ |
| NGC 7089 | 1.1 | 33.01 | 32.69 | 2’ | ||
| NGC 7099 | 8.0 | 32.94 | 32.88 | 4 | ||
| NGC 7492 | 0.6 | 33.87 | 32.75 | 12 | ||
| amarginal detection, boffset | ||||||
4.2 Probability of spurious identifications with clusters
As noted in the introduction, the number of faint X-ray sources detectable with ROSAT is large, and we must consider the possibility of chance coincidence between a fore- or background X-ray source and a globular cluster.
Let us start by considering the source near Pal 2. I approximate the area covered by the HRI detector with a circle with a radius . As can be seen in Fig. 2 . The probability that one serendipitous source in the HRI observation is at a distance to the cluster center thus is . However, as noted by Rappaport et al. (1994), one must take into account the fact that many images are analyzed, in one of which the coincidence is found. From Table 3 it is seen that 147 sources are found in 34 HRI observations, not counting the observations with zero detections. (For each cluster only one observation is considered, viz. the one with the highest sensitivity. The numbers or given in Table 3 are from that observation, which may be a co-added observation.) Taking and , I find that the probability for one trial to detect a source at is ; and the probability of finding no such source after 147 trials is %. From this it is likely that all sources detected in the listed HRI observations within 30′′ of the cluster center are indeed cluster members; including the source near Pal 2.
Two more sources detected in HRI observations and indicated in Table 2 (see also Table 4) as possibly related to a globular cluster are those near NGC 1904 and NGC 6626, located 71′′ and from the cluster centers, respectively; the probabilities of finding no source within and after 147 trials are 60% and 83%.
The inner area of the PSPC has a radius , and from Table 3 it is seen that 104 sources are found in 12 PSPC observations of clusters in which no source was found with the HRI. (I count here only those PSPC observations pointed at a direction within 20′ from the globular cluster; and note that NGC 6522 and NGC 6528 are in the same observation.) Two sources detected in these PSPC observations and indicated in Table 2 as possibly related to a globular cluster are those near NGC 6388 and NGC 6352, located 44′′ and 90′′ from the cluster centers, respectively. The probabilities that no source source is detected after 104 trials within these three distances are 87% and 56%, respectively. None of the globular cluster sources observed with the PSPC at an offset of more than 20′ is detected; these observations do serve to improve on the upper limits from the the ROSAT All Sky Survey.
Because the probability in most individual observations of detecting no source near the center by chance is rather close to unity, the overall probabilities for detecting no source near a cluster center by chance in the whole data set do not change much if we remove some clusters from the sample, or e.g. switch NGC 104 from the HRI set of observations to the PSPC set. In this respect, the probabilities just given are fairly stable. For the same reason, if we argue that the number of trials is actually less than 147 for the HRI, or less than 104 for the PSPC because some sources certainly belong to the clusters, the probabilities just given do not increase significantly. A more important uncertainty is the effective size of the detectors, considering that sources are more easily detected near the center of the detectors, where the point spread function is sharper. For bright sources this makes no difference, for faint sources it does. With somewhat smaller effective radii, the probabilities given above all increase, but not so dramatically as to change the conclusions. Thus, for the probability of finding no source by chance at from the cluster centers in any HRI observation is 85%; and the probability of finding no source by chance at from the cluster center in the PSPC observations is 39%.
In addition to the probabilities discussed so far, it is interesting to consider the probability that all sources found within a cluster core are actually related to the cluster; because the apparent size of the core is different for each cluster, this means that the probability of chance coincidence varies between clusters. Writing the core radius in observation as and the number of sources detected in that observation as , we may write the probability of getting no chance coincidence in observation as
and the probability of getting no chance coincidence in a set of observations as
The probability of getting a single chance coincidence in a set of obserations may be written
With these equations, taking , and using the core radii from the June 22, 1999 revision of the catalogue described by Harris (1996), I find that the probability of getting zero or one chance coincidence in the observations for which is given in Table 3 are 65% and 30%, respectively, for the 34 HRI observations, and 78% and 20% for the 13 PSPC observations. (Here the PSPC observation containing NGC 6522 and NGC 6528 is counted twice.) Using the half-mass radii rather than the core radii, I find that the probabilities of getting zero or one chance coincidence is 15% and 32% for the HRI observations and 35% and 42% for the PSPC observations. These numbers too are uncertain mainly because of the use of a fixed effective detector radius, independent of source brightness.
| NGC | X | d(′′) | NGC | X | d(′′) | ||
|---|---|---|---|---|---|---|---|
| 104 | 4 | 79 | 31.68 | 6205 | F | 75 | 32.21 |
| 104 | 6 | 53 | 31.78 | 6352 | 4 | 90 | 32.10 |
| 104 | 11 | 58 | 31.55 | 6388 | 4 | 44 | 33.77 |
| 104 | 13 | 53 | 31.38 | 6397 | 12 | 45 | 31.00 |
| Pal 2 | 1 | 29 | 34.33 | 6626 | 7 | 43 | 32.15 |
| 1904 | 1 | 71 | 33.18 | 6752 | 4 | 48 | 32.17 |
| 5139 | 7 | 264 | 32.21 | 6752 | 6 | 92 | 31.68 |
| 5139 | 21 | 170 | 31.76 | 7099 | 8 | 6 | 32.88 |
| 5904 | 4 | 290 | 31.79 |
Notwithstanding the uncertainties in the statistical arguments given above, it appears that most of the sources detected with the HRI and PSPC in cluster cores are actually associated with a globular cluster. On the basis of their distances to the cluster center, the sources listed in the cores of NGC 5139, NGC 6809 and NGC 6366 have non-negligible probabilities of being fore- or background objects, as do most out-of-the-core sources listed in Table 4. However, it is worth of note that the source in Table 4 with the largest distance to a cluster center, the one near NGC 5904, is considered to be a secure member of that cluster, which indicates that sources outside the cluster core should not be discarded too easily as possible members. The statistical arguments above indicate that some of the sources listed in Tables 3 and 4 may not be related to the clusters, but that it is very unlikely that many of them are chance projections. Optical identifications are required to settle the question of membership for the individual sources.
4.3 Spectral energy distributions
The five cluster spectra with enough PSPC counts to allow a spectral fit are shown in Fig. 3. The most remarkable property of these spectra is that all peak at low energies, indicating that they are fairly soft. This is true also for the spectrum of NGC 104, which is the sum of the spectra of several sources. (For example, an 0.4 to 2 keV blackbody spectrum in NGC 104 would show a count distribution peaking at channel 100 to 130, respectively; the observed spectrum peaks around channel 75.) The X-ray luminosities of these sources, as well as their soft spectra, are similar to the luminosities and spectra of soft X-ray transients in quiescence (see e.g. Verbunt et al. 1994; Asai et al. 1998). Spectra of cataclysmic variables, on the other hand, tend to be harder, with temperatures for thermal bremsstrahlung fits of 2.4 keV on average, but with a large spread (e.g. Richman 1996, Van Teeseling et al. 1996).

A problem with the fits for NGC 104 and NGC 6341 appears to be that they underestimate the countrates at the lowest energies, even when for NGC 6341 the absorption is set at a rather low value. The proximity of these sources to the cluster centers (see Table 2) ensures that the sources do belong to the cluster; and thus I conclude that the spectra of these sources are softer than can be described by a single blackbody or bremsstrahlung spectrum.
Johnston et al. (1994) note that not all low-luminosity X-ray sources in globular clusters can have the same spectrum. The hardest sources are those in NGC 5139 ( Cen) and in NGC 6752, but even for these, Johnston et al. obtain low blackbody temperatures: 0.60.2 and 0.350.05 keV, respectively. Note that in both clusters the PSPC spectrum is the sum of spectra of at least two sources (Verbunt & Johnston 2000). Thus a range of spectral energy distributions is indeed observed, but no hard spectra have been found amongst the dim sources so far. As shown by Dotani et al. (1999) the highly variable source in NGC 5272 is unique in changing its spectrum from extremely soft to fairly hard as its luminosity increases (Sect. 3.12).
Observations with Chandra will be needed both to separate the spectra of sources located close to one another in cluster cores, and to reduce the problem of accurate background determination, which is difficult for possibly extended, faint sources. The better spectral resolution will also allow comparison with more realistic model spectra.
4.4 Luminosity distribution
![[Uncaptioned image]](/html/astro-ph/0012261/assets/x22.png) Figure 7: 0.5-2.5 keV luminosity-to-mass ratio of globular clusters
as a function of the ratio of the tidal and core radii of the cluster.
Collapsed clusters are located at .
Left: the ratio for the total mass of the cluster,
right: the ratio for the core mass only.
To convert ROSAT countrate to 0.5-2.5 keV luminosity an 0.9 keV
bremsstrahlung spectrum has been assumed. For comparison,
the horizontal dashed line gives the luminosity to mass ratio for the old
galactic cluster M 67.
Figure 7: 0.5-2.5 keV luminosity-to-mass ratio of globular clusters
as a function of the ratio of the tidal and core radii of the cluster.
Collapsed clusters are located at .
Left: the ratio for the total mass of the cluster,
right: the ratio for the core mass only.
To convert ROSAT countrate to 0.5-2.5 keV luminosity an 0.9 keV
bremsstrahlung spectrum has been assumed. For comparison,
the horizontal dashed line gives the luminosity to mass ratio for the old
galactic cluster M 67.
For the study of the X-ray luminosity distribution of the dim sources I start with Table 3. I retain for Terzan 6 only the upper limit, i.e. ignore the detection of the transient in outburst. For systems not listed in Table 3 I use the upper limits derived from the ROSAT All Sky Survey (Verbunt et al. 1995). All these luminosities refer to the ROSAT range of 0.5-2.5 keV, to minimize the effect of the X-ray spectral energy distribution on the conversion of the observed countrate to the X-ray luminosity.
For systems listed in Table 3 I select the PSPC detection when available; or else the HRI detection; or else the deepest from the upper limits derived from the All Sky Survey or pointed PSPC and HRI observations. All count rates are converted to luminosities assuming an 0.9 keV bremsstrahlung spectrum, and using distances and absorption to the cluster from Harris (1996; revision of June 22, 1999). The resulting distributions of upper limits and detections are shown in Fig. 6, as is the maximum-likelihood intrinsic luminosity distribution derived from these according to the method described by Avni et al. (1980). In this method the lowest bin (in this case for ) contains all systems in that and lower bins. From Fig. 6 we thus see that about 60% of all cluster cores have an X-ray luminosity above erg s-1. This implies that the luminosity function cannot rise further towards lower luminosities, and on the contrary must drop rapidly below erg s-1.
The distributions of upper limits and detections are indicated separately in Fig. 6 for the cores which according to Harris (1996) are collapsed or possibly collapsed. It is seen that these distributions do not differ significantly from those of the total distribution.
I plot the integrated core luminosity as derived from detected sources, because in crowded cores and/or in small cores ROSAT cannot separate multiple sources. In the largest cores the luminosity given in Table 3 and shown in Fig. 6 doesn’t include the sources below the ROSAT detection limit, and thus is a lower limit to the actual core luminosity. However, the argument given by Johnston & Verbunt (1996) that the total core luminosity is dominated by the brighter sources still holds, and thus the estimates for the total luminosity are expected to be correct within a factor 2.
Fig. 6 also shows the luminosity distribution of the sources outside the cores; this distribution is shifted by a about a factor 3 with respect to the distribution of the core luminosities. As the sources outside the cores are most likely single, the shift may be due simply to the fact that the core luminosities are often those of several sources.
Fig. 7 shows the ratio of X-ray luminosity to mass of the globular cluster as a whole, and to its core mass, as a function of the ratio of the tidal radius to the core radius of the cluster. The masses of the clusters and their cores are computed using the central luminosity densities and core radii tabulated by Harris (1996), and a mass-to-light ratio of 3. For comparison the ratio of the old open cluster M 67 is also shown. For the X-ray luminosity of M 67 I add the 0.1-2.4 keV luminosities given in Table 3 of Belloni et al. (1998), and multiply the sum by 0.4 to convert to the 0.5-2.5 keV bandpass; for the mass of M 67 I use 723 (Montgomery et al. 1993). It should be noted that the core masses of globular clusters generally are not accurately determined; mainly because low-mass stars can add mass without adding luminosity.
Remarkably, most clusters or cluster cores do not emit more X-rays per unit mass than the open cluster M 67. The X-ray luminosity-to-mass ratio for the cluster as a whole is not a function of its concentration, but there is a hint in Fig. 7 that concentrated clusters (with large values) emit more X-rays per unit mass. Whether this is because the sources in them are more luminous or because they contain more sources cannot be determined on the basis of the ROSAT data. It is true that two of the three collapsed clusters (shown at in Fig. 7), viz. NGC 6397 and NGC 6752, are known to harbour at least four sources each in their cores (Verbunt & Johnston 2000); whereas the PSPC observations obtained of the third one, NGC 7099, cannot resolve its small core. On the other hand, in cluster cores that are large enough to be completely resolved by ROSAT, as is the case in Cen, faint sources are not detected individually, and for these clusters the total core luminosity is underestimated.
Acknowledgements.
I thank Lucien Kuiper for help in making Fig. 4d. This research is based on X-ray data from the ROSAT Data Archive of the Max Planck Institute für extraterrestrische Physik at Garching, and made extensive use of the SIMBAD database operated at Centre de Données astronomiques in Strasbourg. Indeed, without these data bases the research described in this paper would have been impossible.References
- Asai et al. (1998) Asai, K., Dotani, T., Hoshi, R., and et al., 1998, Publ. Astr. Soc. Japan 50, 611
- Avni et al. (1980) Avni, Y., Soltan, A., Tananbaum, H., and Zamorani, G., 1980, ApJ 238, 800
- Batten et al. (1989) Batten, A., Flechter, J., and MacCarthy, D., 1989, Publ. Dom. Astroph. Obs. 17, 1
- Belloni et al. (1998) Belloni, T., Verbunt, F., and Mathieu, R., 1998, A&A 339, 431 (erratum: 351, 398)
- Carney (1976) Carney, B., 1976, PASP 88, 334
- Cominsky and Wood (1989) Cominsky, L. and Wood, K., 1989, ApJ 337, 485
- Cool et al. (1995) Cool, A., Grindlay, J., Bailyn, C., Callanan, P., and Hertz, P., 1995, ApJ 438, 719
- Danner et al. (1997) Danner, R., Kulkarni, S., Saito, Y., and Kawai, N., 1997, Nat 388, 751
- Danner et al. (1994) Danner, R., Kulkarni, S., and Thorsett, S., 1994, ApJ (Letters) 436, L153
- Davies (1997) Davies, M., 1997, MNRAS 288, 117
- Djorgovski and Meylan (1993) Djorgovski, S. and Meylan, G., 1993, in S. Djorgovski and G. Meylan (eds.), Structure and Dynamics of Globular Clusters, Vol. 50 of ASP Conference Series, pp 325–336, ASP
- Dotani et al. (1999) Dotani, T., Asai, K., and Greiner, J., 1999, Publ. Astr. Soc. Japan 51, 519
- Evstigneeva et al. (1995) Evstigneeva, N., Shokin, Y., Samus, N., and Tsvetkova, T., 1995, Astr. Lett. 21, 451
- Ferraro et al. (1997) Ferraro, F., Paltinieri, B., Fusi Pecci, F., Rood, R., and Dorman, B., 1997, MNRAS 292, L45
- Ferraro et al. (2000) Ferraro, F., Paltinieri, B., Rood, R., Fusi Pecci, F., and Buonanno, R., 2000, ApJ 537, 312
- Fox et al. (1996) Fox, D., Lewin, W., Margon, B., van Paradijs, J., and Verbunt, F., 1996, MNRAS 282, 1027
- Geffert (1998) Geffert, M., 1998, A&A 340, 305
- Hachenberg (1939) Hachenberg, O., 1939, Z.f.Ap. 18, 49
- Hakala et al. (1997) Hakala, P., Charles, P., Johnston, H., and Verbunt, F., 1997, MNRAS 285, 693
- Harris et al. (1992) Harris, H., Guetter, H., Pier, J., and et al., 1992, AJ 104, 53
- Harris (1996) Harris, W., 1996, AJ 112, 1487
- Hasinger et al. (1998) Hasinger, G., Burg, R., Giacconi, R., Schmidt, M., Trümper, J., and Zamorani, G., 1998, A&A 329, 482
- Hempelmann et al. (1995) Hempelmann, A., Schmitt, J., Schultz, M., Rüdiger, G., and Stepien, K., 1995, A&A 294, 515
- Hertz and Grindlay (1983) Hertz, P. and Grindlay, J., 1983, ApJ 275, 105
- Hertz et al. (1993) Hertz, P., Grindlay, J., and Bailyn, C., 1993, ApJ 410, L87
- Høg et al. (1997) Høg, E., Bässgen, G., Bastian, U., and et al., 1997, A&A 323, L57
- Hünsch et al. (1998) Hünsch, M., Schmitt, J., and Voges, W., 1998, A&AS 132, 155
- Hut et al. (1992) Hut, P., McMillan, S., Goodman, J., Mateo, M., Phinney, S., Pryor, C., Richer, H., Verbunt, F., and Weinberg, M., 1992, PASP 104, 981
- James and Jeffries (1997) James, D. and Jeffries, R., 1997, MNRAS 291, 252
- Johnston and Verbunt (1996) Johnston, H. and Verbunt, F., 1996, A&A 312, 80
- Johnston et al. (1994) Johnston, H., Verbunt, F., and Hasinger, G., 1994, A&A 289, 763
- Johnston et al. (1996) Johnston, H., Verbunt, F., and Hasinger, G., 1996, A&A 309, 116
- Margon and Bolte (1987) Margon, B. and Bolte, M., 1987, ApJ 321, L61
- McGale et al. (1996) McGale, P., Pye, J., and Hodgkin, S., 1996, MNRAS 280, 627
- Mihalas and Binney (1981) Mihalas, D. and Binney, J., 1981, Galactic Astronomy, Structure and kinematics, Freeman, San Francisco, 2nd edition
- Montgomery et al. (1993) Montgomery, K., Marschall, L., and Janes, K., 1993, AJ 106, 181
- Parker (1915) Parker, T., 1915, P. Dom. O. 2, 331
- Perryman et al. (1997) Perryman, M., Lindegren, L., Kovalevsky, J., and et al., 1997, A&A 323, L49
- Predehl et al. (1991) Predehl, P., Hasinger, G., and Verbunt, F., 1991, A&A 246, L21
- Predehl and Schmitt (1995) Predehl, P. and Schmitt, J., 1995, A&A 293, 889
- Rappaport et al. (1994) Rappaport, S., Dewey, D., Levine, A., and Macri, L., 1994, ApJ 423, 633
- Richman (1996) Richman, H., 1996, ApJ 462, 404
- Saito et al. (1997) Saito, Y., Kawai, N., Kamae, T., and et al., 1997, ApJ (Letters) 477, L37
- Sarazin et al. (1999) Sarazin, C., Irwin, J., Rood, R., and et al., 1999, ApJ 524, 220
- Sigurdsson and Phinney (1993) Sigurdsson, S. and Phinney, E., 1993, ApJ 415, 631
- Swope (1932) Swope, H., 1932, Astronomical Observatory Harvard College Bulletin no., 887
- Taylor et al. (1993) Taylor, J., Manchester, R., and Lyne, A., 1993, ApJS 88, 529
- Tucholke et al. (1996) Tucholke, H.-J., Scholz, R.-D., and Brosche, P., 1996, A&A 312, 74
- van Teeseling et al. (1996) van Teeseling, A., Beuermann, K., and Verbunt, F., 1996, A&A 315, 467
- Verbunt et al. (1994) Verbunt, F., Belloni, T., Johnston, H., van der Klis, M., and Lewin, W., 1994, A&A 285, 903
- Verbunt et al. (1995) Verbunt, F., Bunk, W., Hasinger, G., and Johnston, H., 1995, A&A 300, 732
- Verbunt and Hasinger (1998) Verbunt, F. and Hasinger, G., 1998, A&A 336, 895
- Verbunt and Johnston (2000) Verbunt, F. and Johnston, H., 2000, A&A 358, 910
- Verbunt and Meylan (1988) Verbunt, F. and Meylan, G., 1988, A&A 203, 297
- Verbunt et al. (2000) Verbunt, F., van Kerkwijk, M., in ’t Zand, J., and Heise, J., 2000, A&A 359, 960
- Wachter et al. (2000) Wachter, S., Smale, A., and Bailyn, C., 2000, ApJ 534, 367
- Wright et al. (1991) Wright, A., Wark, R., Troup, E., and et al., 1991, MNRAS 251, 330
- Zamorani et al. (1999) Zamorani, G., Mignoli, M., Hasinger, G., and et al., 1999, A&A 346, 731
- Zimmermann et al. (1998) Zimmermann, H., Boese, W., Becker, W., Belloni, T., Döbereiner, S., Izzo, C., Kahabka, P., and Schwentker, O., 1998, EXSAS User’s Guide: Extended scientific analysis system to evaluate data from the astronomical X-ray satellite ROSAT, Technical report, MPE
Appendix A Expected X-ray flux for main-sequence stars, and field stars detected in ROSAT observations of globular cluster.
To get an impression of the X-ray fluxes that can be expected for main-sequence stars, I use data from the ROSAT All Sky Survey for nearby stars, as published by Hünsch et al. (1999). In many cases (in particular for visual binaries) the X-ray flux cannot be assigned uniquely to an optical counterpart, and Hünsch et al. (1999) list several possibilities. From their Table I select only unique identifications, which have a measured value for colour and distance, and remove those with spectral luminosity classes III or IV, or with absolute magnitude . This leaves mainly nearby main-sequence stars. From the observed visual magnitude , the ROSAT PSPC countrate CTR (cts s-1), and the distance (pc) I compute the absolute magnitude and an absolute ROSAT countrate CTR , neglecting interstellar absorption. The Hertzprung Russell diagram of the stars thus selected, and a graph showing the absolute ROSAT countrate as a function of absolute visual magnitude are shown in Figure 8. An approximate X-ray luminosity scale is also indicated, based on a conversion of 1 cts s-1 to erg cm-2s-1. (Note that Hünsch et al. use a countrate to flux conversion factor which depends on the ratio of PSPC counts above and below 1 keV, which implies that the X-ray luminosities derived by these authors may differ somewhat from those according to Fig. 8.) The Hertzprung Russell diagram shows that only a few stars not on the main sequence passed the selection procedure; and the lower graph that the range of X-ray luminosity (in the ROSAT band) for each spectral type spans several orders of magnitude. Closer inspection of the Table in Hünsch et al. (1999) shows that most of the stars in the ridge that forms the higher envelope of the distribution, i.e. near the locus , are emission line objects, as indicated by an ’e’ in the spectral type. Fig. 8 may be compared with Figures in which the ratio of optical to X-ray flux for main-sequence stars is given (e.g. Hempelmann et al. 1995), but contains more information thanks to its use of the known distances.
| NGC | star | SpT | CTR | ||||
| 6093 | VV Scoa | ||||||
| HD 146457 | 8.46 | 0.32 | A5III | 0.3:b | 2*P | 3.1 | |
| HD 146516 | 10.14 | 0.82 | G1V | 4.6:b | 2*P | 3.9 | |
| 6121 | HIP 80290 | 9.72 | 0.63 | G0V | 5.2 | 2*H | 2.9 |
| 6266 | TY 7360 394 | 10.1 | 1.0 | K0V: | 5.9: | 0.235 | 3.1 |
| 6341 | V798 Herc | ||||||
| TY 3081 510 | 11.0 | 0.69 | G5V: | 5.2: | 0.107 | 3.3 | |
| 6352 | HIP 85326 | 8.86 | 0.78 | K1V | 5.5 | 0.049 | 2.0 |
| HIP 85342 | 7.05 | 0.44 | F6V | 3.7 | 0.056 | 2.1 | |
| 6366 | HIP 85365 | 4.53 | 0.39 | F3V | 2.1 | 0.124 | 2.0 |
| 6388 | TY 7896 3885 | 10.2 | 0.7 | G5V: | 5.2: | 0.270 | 3.4 |
| HIP 86356 | 8.12 | 0.42 | F5V | 2.2 | 0.120 | 3.4 | |
| TY 7896 3812 | 10.5 | 0.9 | K1V: | 6.1: | 0.252 | 3.2 | |
| TY 7896 2299 | 10.1 | 1.1 | K5V | 7.3 | 2*P | 1.7 | |
| 6541 | TY 7911 112 | 10.36 | 0.94 | K2V: | 6.3: | 2*H | 2.2 |
| 6626 | TY 6848 3536 | 11.1 | 0.3 | F0 | 2.5: | 2*H | 2.5 |
| a T Tau star; b ; c W UMa star | |||||||
For a suggested stellar counterpart to a ROSAT source in one of the images discussed in this paper, I use spectral type and distance whenever known, as derived from information available in SIMBAD. When these quantities are not known, I derive an estimated spectral type from the observed by assuming that reddening may be neglected, and that the star is on the main sequence; and then estimate a distance by comparing the absolute magnitude for a star of that spectral type with the observed magnitude. For this I use colours and absolute magnitudes of main sequence stars from Tables 3-2 and 3-3 of Mihalas & Binney (1981). The countrates used in this paper are HRI countrates or PSPC countrates in channels 50-240, and must be converted to a total PSPC countrate (channels 11-240) for comparison with the ROSAT All Sky Survey data. I thus multiply the HRI or PSPC (ch. 50-240) countrates as listed in Table 2 with a factor 2 to estimate the CTR value; for PSPC observations this value can be checked directly from the analysis, provided that the absorption is negligible, so that a sufficient number of counts is detected in channels 11-50. The factor 2 is approximate, but the uncertainty introduced is negligible with respect to the range of X-ray luminosities at each absolute visual magnitude. Finally, I compare the values of CTR and of the proposed counterpart with Fig. 8. In all cases the proposed counterpart was found to have an acceptable X-ray luminosity in the ROSAT band.
Two stars are not main sequence stars, viz. the T Tau star VV Sco, and the contact binary V798 Her. More information on the field stars can be found in the sections on the individual clusters.