THE SUNYAEV-ZEL’DOVICH EFFECT WITH THE COSMIC BACKGROUND IMAGER
We are engaged in a program with the Cosmic Background Imager (CBI), a 13-element interferometer recently installed at 5000 m in the Chilean Andes, to measure with 10% accuracy through observations of the Sunyaev-Zel’dovich effect in a sample of nearby clusters. We discuss the capabilities of this new instrument and present our cluster sample and selection criteria, along with results from detailed simulations. We also present preliminary observations of Abell 478.
1 The Cosmic Background Imager
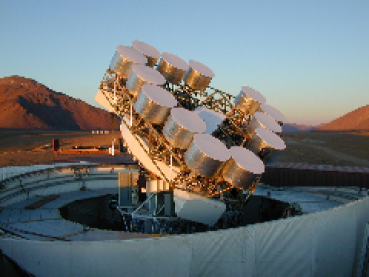
The Cosmic Background Imager (CBI), shown in Fig. 1, is a radio interferometer array whose design makes it particularly suitable for observations of the SZE in low- clusters (). It can therefore be used to determine the value of with high accuracy and provide us with insight into the physical state of the cluster gas.
1.1 Instrument Specifications
The CBI is a 13-element interferometer mounted on a 6 meter platform operating in ten 1-GHz frequency bands from 26 GHz to 36 GHz. Dishes 90 cm in diameter accommodate a range of baselines from 100 cm to 550 cm. The instantaneous field of view of the instrument is and its resolution ranges from to , depending on configuration. HEMT amplifiers cooled to 6 K and low atmospheric noise at the high, dry site, allow a system temperature of 30 K. In 5 hours, the CBI can produce images with an rms noise per beam of 1.4 mJy, which corresponds to 30 K for a synthesized beam of FWHM. Typical SZ decrements at 31 GHz are of order several hundred K.
1.2 SZ with the CBI
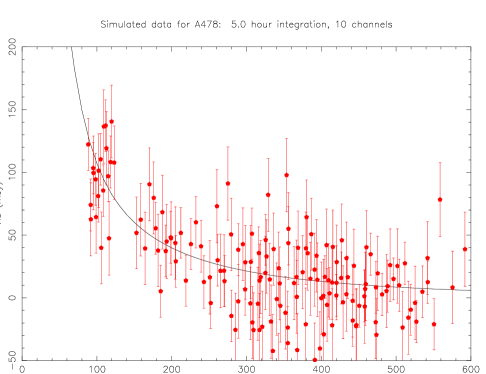
The CBI’s angular resolution makes it well-suited for observations of low-redshift clusters. Fig. 2 shows a simulated CBI visibility data set for A478, a cluster at . The model profile was calculated using an isothermal -model with cluster parameters =0.638, core radius =, and central gas density , derived from ROSAT X-ray data by Mason and Myers . We assumed spherical symmetry and used a gas temperature = 8.4 keV . The visibility profile demonstrates the CBI’s special suitability for imaging the SZE in low-redshift clusters. For a large extended source, the interferometer’s response drops rapidly for baselines between 100 and 200 wavelengths, which at 30 GHz corresponds to a baseline length of 1 to 2 meters. Much larger interferometers observing at the same frequencies aren’t sensitive to this region of u-v space and must observe more distant clusters () which have smaller angular sizes and are therefore better matched to the response of their longer baselines. The CBI’s exceptional sensitivity allows us to observe a large sample of nearby clusters. Each cluster only requires about 2-3 nights of observing time.
We combine these advantages in our program to observe the SZE in a complete sample of 19 low- galaxy clusters. In doing so we hope to address three key issues that can lead to inaccurate determinations of : cluster asphericity, clumpy gas distribution, and non-isothermal gas. Observation of a large, complete sample should eliminate any bias in due to elongation effects, while the focus on nearby clusters will allow us better to understand the effects of a clumpy gas distribution. When combined with the spectral imaging capabilities of XMM-Newton and Chandra this reveals the temperature structure of galaxy clusters, which are important factors in modeling the expected SZE.
2 The Distance Scale and SZ
Accurate knowledge of the Hubble Constant allows us to calculate fundamental cosmological parameters such as the age and size scale of the universe, as well as important astrophysical quantities such as luminosities and physical sizes. While groups such as the HST Key Project are measuring to high precision , it is important to obtain a measurement of comparable accuracy via completely independent methods.
The Sunyaev-Zel’dovich effect is caused by the inverse Compton scattering of Cosmic Microwave Background (CMB) photons off electrons in a hot ionized gas. The scattering boosts the low energy photons to higher energies, so we see a distortion in the CMB spectrum, a decrement in intensity at low frequencies and an increment at high frequencies . Coupled with X-ray observations, the SZE provides a direct measurement of , independent of the astronomical distance ladder. The SZE is proportional to , while the X-ray emission due to thermal bremsstrahlung is proportional to , where is the electron density, is the electron temperature, and is the X-ray cooling function, which depends on temperature. The X-ray observations constrain the density and temperature profiles, allowing one to predict the expected SZE towards a cluster. The comparison of the X-ray and SZE observations, coupled with the assumption that clusters are spherically symmetric, provides a measurement of .
Accurate detections of the SZE are now becoming fairly routine. See, for example, Carlstrom et al., Grainge et al., Myers et al., and Holzapfel et al.. However, other than Myers et al., most groups have focused on high redshift clusters where it is more difficult to define a complete sample. Also, as mentioned above, there are still a number of difficulties associated with the SZE/X-ray determination of :
-
1.
Cluster asphericity:
The observational evidence suggests clusters are not spherically symmetric . One can overcome this by selecting a complete sample of clusters and averaging the measurements over the entire sample. The random orientations will cancel out statistically, providing one with an unbiased measurement of . We plan to accomplish this using an X-ray flux-limited sample, discussed below.
-
2.
Sub-clumping of cluster gas:
The cluster gas is usually represented by a smooth -model profile. Other SZ studies don’t take into account the effect of a clumpy gas distribution, and we hope to do this by observing nearby clusters, where the density structure will be easier to observe and understand.
-
3.
Non-isothermal cluster gas:
The value of depends strongly on the model used for the gas temperature profile. Cluster temperature profiles have been difficult to constrain due to insufficient X-ray data, but detailed XMM observations should remedy this problem.
3 Sample Selection
We wish to minimize the effects of cluster asphericity by studying a complete orientation unbiased sample. To compile such a sample, we combined the results of ROSAT cluster surveys by Ebeling et al. 1996, 1998, and De Grandi et al. and imposed a flux limit erg cm-2 s-1 which is significantly higher than the expected completeness levels of the various catalogs. We then assembled a volume complete sample out to our redshift cutoff by only including clusters with erg s-1. This luminosity cutoff should also eliminate any possible optical bias in the catalogs by removing the poorer clusters from the sample, as discussed in detail by Mason and Myers. Our sample contains 25 clusters which are observable with the CBI. The 19 most luminous clusters have pointed ROSAT and ASCA observations available, and these clusters constitute our primary sample.
4 CBI Observations: Abell 478
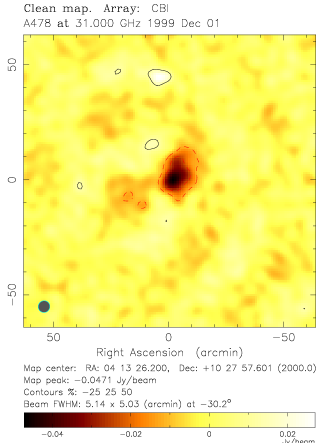
We observed Abell 478 with a subset of the CBI (9 of 13 antennas and 7 of 10 channels) in December 1999. To remove the ground spillover detected at the 1 Jy level on short (100 cm) baselines, we observed lead and trail fields at the same declination and hour angle range, and subtracted the average of the lead and trail fields from the cluster field. This method allows for accurate removal of the ground signal, but increases the rms noise by a factor of and triples the on source integration time. Fig. 3 shows a CBI image of A478, taken with the partial array in December over about 6 hours (on source time). The noise is 4.2 mJy/beam, so the peak detection is about 11-. The CBI has been in full operation since January 2000. We have preliminary observations of A85, A1651, A2029, A2384, A2597, A3158, A3667, and A3921, and we will continue to conduct observations of these and the remaining clusters during the next year.
5 Tentative Error Budget
Intrinsic anisotropy fluctuations are the largest source of random error in the determination of from low- clusters. Our simulations indicate that errors in of 35% to 40% per cluster due to intrinsic anisotropy would be typical. The expected random error in the determination of from sources including these fluctuations, asphericity, residuals from point source subtraction, observational noise and calibration, and derivation of cluster parameters from X-ray observations is about 45%. For a sample of 19 clusters, we expect a random error of about 10% in our final determination of .
By accounting for clumpy, non-isothermal gas distributions we should minimize the systematic errors from these sources, although we currently cannot quantify by how much. We anticipate a systematic error due to CBI absolute flux calibration of about 5-6%.
Acknowledgments
The CBI is a project of the California Institute of Technology, in collaboration with the University of Chile. The construction of the CBI has been made possible by the generous support of the California Institute of Technology, Ronald and Maxine Linde, Cecil and Sally Drinkward, and grants from the National Science Foundation (awards AST-9413935 and AST-9802989). PSU gratefully acknowledges support from the NSF Graduate Fellowship program.
References
References
- [1] Carlstrom, J.E., Joy, M., and Grego, L. 1996, ApJ, 456, L75
- [2] De Grandi, S. et al. 1999, ApJ, 514, 148
- [3] Ebeling, H. Edge, A.C., Böhringer, H., Allen, S.W., Crawford, C.S., Fabian, A.C., Voges, W., and Huchra, J.P. 1998, MNRAS, 301, 881
- [4] Ebeling, H., Voges, W., Böhringer, H., Edge, A.C., Huchra, J.P., and Briel, U.G. 1996, MNRAS, 281, 799
- [5] Grainge, K., Jones M., Pooley, G., Saunders, R., Baker, J., Haynes, T., and Edge, A. 1996, MNRAS, 278, L17
- [6] Henry, J.P. and Briel, U.G. 1995, ApJ, 443, L9
- [7] Holzapfel W.L., Arnaud, M., Ade, P.A.R., Church, S.E., Fischer, M.L., Mauskopf, P.D., Rephaeli, Y., Wilbanks, T.M., Lange, A.E., 1997, ApJ, 480, 449
- [8] Markevitch, M., Forman, W.R., Sarazin, C.L., and Vikhlinin, A. 1998, ApJ, 503, 77
- [9] Mason, B.S., and Myers, S.T. 2000, ApJ, 540, 614
- [10] Mould, J.R., et al., 2000, ApJ, 529, 786
- [11] Myers, S.T., Baker, J.E., Readhead, A.C.S., Leitch, E.M., and Herbig, T. 1997, ApJ, 485, 1
- [12] Struble, M.F., and Rood, H.J., 1991, ApJS, 77, 363
- [13] Sunyaev, R.A., and Zel’dovich, Ya. B. 1980, ARA&A, 18, 537