Runaway collisions in star clusters
Abstract
We study the occurrence of physical collisions between stars in young and compact star cluster. The calculations are performed on the GRAPE-4 with the starlab software environment which include the dynamical evolution and the nuclear evolution of all stars and binaries. The selection of the initial conditions is based on existing and well observed star clusters, such as R136 in the 30 Doradus region in the Large Magellanic Cloud and the Arches and Quintuplet star clusters in the vicinity of the Galactic center. Collisions between stars occurred rather frequently in our models. At any time a single star dominates the collision history of the system. The collision rate of this runaway merger scales with the initial relaxation time of the cluster and is independent on other cluster parameters, such as the initial mass function or the initial density profile of the cluster. Subsequent encounters result in a steady grow in mass of the coagulating star, until it escapes or explodes in a supernova. The collision rate in these models is about collisions per star per Myr for a cluster with an initial relaxation time of 1 Myr.
1. Introduction
The central regions of young star clusters, globular clusters and galaxies have a high stellar density and close encounters between stars are thought to occur on a regular basis. In some cases stars may even collide and form new objects. However, proof for the occurrence of such collisions has never been found explicitly in observations or in theoretical models. Direct evidence for collisions could be provided by the observation of a blue straggler with a mass exceeding three times the mass of the clusters’ turn off, by discovery of a blue straggler in an eccentric orbit around another main-sequence star or by catching a collision in the act.
There are quite a few indications that collisions play a major role in the evolution of star clusters and their constituents. For example: the presence of blue stragglers and millisecond pulsars in globular clusters indicates that stellar collisions may play a role, even though alternative –non-collisional– scenarios have also been proposed (Leonard 1989).
Collision rates in star clusters have always been estimated using cross section arguments. Pioneering work in this field has been performed by Hills (1975) and Lightman & Shapiro (1977). Their general conclusions are:
-
1)
In order to get a runaway growth of a single star one requires a star cluster which contains typically more than stars.
-
2)
A massive star formed out of multiple collisions will always be accompanied by many objects which experienced only one or two collisions.
-
3)
Stellar collisions are so rare that they do not affect the evolution of the star cluster.
We show that these results are based on insufficient detail in the models and that the contrary has to be concluded:
-
ad 1)
Runaway growth is a natural phenomena which occurs even in rather small cluster.
-
ad 2)
The massive product of many collisions will therefore be well separated in mass from the other objects.
-
ad 3)
Even in star clusters where physical collisions are relatively rare the evolution of the star cluster is altered significantly.
We will address these issues by the direct integration of the orbits of all the stars in such clusters, while accounting for the tidal field of the Galaxy and the internal evolution of the stars and binaries. Our model calculations are performed using the starlab software environment with up to 32k stars. The calculations are sped up with the special purpose computer GRAPE-4. The initial conditions are taken to represent observed compact star clusters such as R136 (the compact star cluster in the 30 Doradus region), the Arches cluster and the Quintuplet system.
1.1. The model
To model a dense star cluster we use a hydride computer program that consists of two independent parts. An -body model integrates the equations of motion of all stars and at the same time the other part computes the evolution of the stars. The back coupling between the stellar evolution and the stellar dynamics is taken into account in a self consistent –object oriented– fashion.
All computations are performed using the starlab toolset (Portegies Zwart et al. 2000b, see also http://www.manybody.org). Starlab consists of the -body integrator kira and the stellar and binary evolution program SeBa. The calculations are accelerated using the special purpose computer GRAPE-4 (Makino et al. 1997).
2. Initial conditions
Selection for the initial conditions in our calculations were guided by the well studied Arches and the Quintuplet clusters and the central star cluster R136 in the 30 Doradus region of the Large Machelanic cloud. A compilation of the characteristics of these clusters is presented in Tab. 1. The Arches and Quintuplet cluster are very close to the Galactic center where R136 is completely isolated from the tidal perturbation of the Galaxy.
| Name | ref | Age | M | ||||
|---|---|---|---|---|---|---|---|
| [Myr] | [ ] | —— [pc] —— | [/pc3] | ||||
| R 136 | a | 2–4 | 21–79 | 50k | 4.6–5.2 | ||
| Arches | b | 1–2 | 12–50 | 30 | 1 | 0.2 | 5.6–6.2 |
| Quintuplet | c | 3–5 | 10–16 | 50 | 1 | 4.3–4.5 | |
References: a) Brandl et al. (1996); Campbell et al. (1992); Massey & Hunter (1998). b) Figer et al. (1999); c) Glass, Catchpole & Whitelock (1987); Figer, Mclean & Morris (1999).
We performed a total of 44 -body calculations over a wide range of initial conditions. The number of stars was varied from 1k (1024) to 32k. Initial density profiles and velocity dispersion for the models are taken from Heggie-Ramamani models (Heggie & Ramamani 1995) with ranging from 1 to 7. At birth, the clusters are assumed to perfectly fill the zero velocity surface in the tidal field of the Galaxy. In most cases we selected the initial mass function between 0.1 and 100 suggested for the Solar neighborhood by Scalo (1986), but several calculations are performed with power law initial mass functions with an exponent of -2 and -2.35 (Salpeter). The specification of the remaining parameters, such as the strength of the Galactic tidal field, the virial radius and the tidal radius, are discussed in a forthcoming paper. Here we only specify the initial relaxation time at the half mass radius of our models as this happens to be the fundamental parameter with which our results can be understood (see sect. § 3.). An overview of the initial conditions for the computed models is summarized in Tab. 2. A detailed discussion about several of the presented calculations by Portegies Zwart et al. (2001).
| model | IMF | |||||||
|---|---|---|---|---|---|---|---|---|
| R34W7 | 12k | Scalo | 7 | 0.4 | 2 | 16. | 10.4 | -3.70 |
| KML112 | 4k | -2 | 7 | 0.5 | 2 | 4.0 | 1.9 | -3.00 |
| KML101 | 4k | -2 | 4 | 1.4 | 2 | 2.0 | 1.0 | -3.60 |
| KML142 | 6k | -2.35 | 4 | 1.9 | 1 | 1.0 | 2.2 | -4.13 |
| KML111 | 4k | -2 | 1 | 2.3 | 2 | 0.5 | 6.7 | -4.95 |
| R90W7 | 12k | Scalo | 7 | 2.8 | 1 | 13. | 10.0 | -4.44 |
| R34W4 | 12k | Scalo | 4 | 3.2 | 3 | 6.3 | 30.0 | -4.26 |
| KML144 | 14k | -2.35 | 4 | 3.9 | 1 | 2.0 | 2.4 | -4.18 |
| R150W7 | 12k | Scalo | 7 | 4.5 | 2 | 10. | 21.3 | -4.52 |
| 6k6X5⋆ | 6k | Scalo | 6 | 5.0 | 1 | 21. | 47.9 | -3.47 |
| R34W1 | 12k | Scalo | 1 | 5.5 | 3 | 4.7 | 29.1 | -4.28 |
| R90W4 | 12k | Scalo | 4 | 8.1 | 5 | 5.8 | 10.0 | -4.47 |
| Nk6X10⋆ | 9k | Scalo | 6 | 10.0 | 8 | 10. | 18.0 | -3.94 |
| R150W4 | 12k | Scalo | 4 | 13.0 | 4 | 8.5 | 7.3 | -4.70 |
| R90W1 | 12k | Scalo | 1 | 14.6 | 1 | 7.0 | 9.8 | -4.57 |
| 6k6X20⋆ | 6k | Scalo | 6 | 20.0 | 2 | 4.0 | 95.4 | -4.19 |
| R150W1 | 12k | Scalo | 1 | 23.6 | 2 | 3.0 | 2.1 | -4.87 |
| R300W4 | 12k | Scalo | 4 | 55.6 | 1 | 1.0 | 10.0 | -5.77 |
| R34W1 | 32k | Scalo | 1 | 58.1 | 1 | 4.0 | 35.8 | -5.89 |
The -body system is fully determined once the tidal field, the initial mass function, the number of stars and the relaxation time of the cluster are selected. The total mass of the stellar system determines the unit of mass in the -body system, the tidal radius sets the distance unit and the velocity dispersion together with the size of the stellar system sets the time scale (see Heggie & Mathieu 1986). The evolution of the cluster is subsequently followed using the direct -body integration including stellar and binary evolution and the tidal field of the Galaxy (see Portegies Zwart et al. 2000b). For economic reasons not all stars are kept in the -body system, but stars are removed when they are 3 from the center of the star cluster.
The evolution of our star clusters is driven by two-body relaxation, by stellar mass loss and by the external tidal field of the parent Galaxy. The initial relaxation time, however, appears to be the most fundamental parameter for the range of parameters we study here. The two-body relaxation time:
| (1) |
Here is the number of stars and is a scaling factor, introduced to model the effects of the cut-off in the long range Coulomb logarithm (see Giertz & Heggie 1994; 1996). Here is the half-mass crossing time of the cluster is
| (2) |
Here is its half mass radius and is the mass of the cluster.
2.1. Scaling the collision cross section
The rate at which stars in a cluster experience collisions can be estimated via
| (3) |
Here is the number density of the stars in the core, is the collision cross section (for approach within some distance ), and is the velocity dispersion of the cluster stars.
The central density and the collision cross section are given by the following proportionalities:
| (4) |
We neglect the term in the cross section. In the case of constant crossing time, , we may write . The number of collisions is then computed by substitution of Eq. (4) into Eq. (3) to obtain resulting in a collision rate per star per relaxation time of:
| (5) |
From a theoretical perspective one expects therefore that the collision rate scales with the number of stars and inversely with the initial relaxation time of the stellar system. The normalization constant, however, is hard to estimate from first principals.
3. Results
Shortly after the start of our calculations, each model experiences core collapse. This event is triggered by the more massive stars in the cluster, which sink into the cluster core in a fraction of the initial relaxation time; . Once in the cluster core these massive stars dominate the dynamics by forming binaries with other stars. This phase of cluster evolution continues until the massive star is either kicked out of the cluster by a strong encounter or the star explodes in a supernova (see Portegies Zwart et al 1999). The period over which the massive star can dominate the cluster dynamics depends on the initial conditions of the star cluster.
All our models finally dissolve in the tidal field of the Galaxy. (Except the isolated models which are terminated after one initial relaxation time lapsed.)
Once a massive star settles in the cluster center and forms a binary with another star the cluster tends to becomes dominated by collisions. For an detailed description of this process we refer to Portegies Zwart et al. (1999).
3.1. The collision rate from model calculations
The number of collisions in each simulation ranges from 0–24, resulting a rate of — collision per star per Myr (see Tab. 2)111Collision rates are computed over the time interval from zero age to the moment the last collision occurs.. These numbers are about two orders of magnitude higher than expected from simple cross section arguments. The reason for this discrepancy hides in the effect of mass segregation and the formation of binaries.
The number of collisions depends on the number of stars and on the initial relaxation time of the stellar system. We therefore define as:
| (6) |
Here is the time of the last collision. In Fig. 1 we give the collision rate per star per million years as a function of the initial relaxation time of the model cluster.
Models with the same initial conditions (Galactic tidal field, relaxation time and mass function) are averaged.

The solid line in Fig 1 is a least squares fit to the results of our -body calculations, and yields
| (7) |
The fit (Eq. 7) is excellent, which is somewhat surprising since the models range a large area of parameter space, in initial density profile, mass function and tidal field (or not). Apparently these parameters hardly affect the collision rate. The fundamental parameters appear to be the initial relaxation time of the stellar system and the number of stars .
3.2. The collision partners
From cross section arguments one would expect that the most common collision candidates are among the stars which have the largest collective cross section (the collective projected area of the stars convolved with their gravitational focusing). Fig. 2 gives the probability distribution of the stars which are most likely to be involved in a collision; the most likely collision counterparts are rather low mass stars, which are most common (see Portegies Zwart et al. 1999 for details).
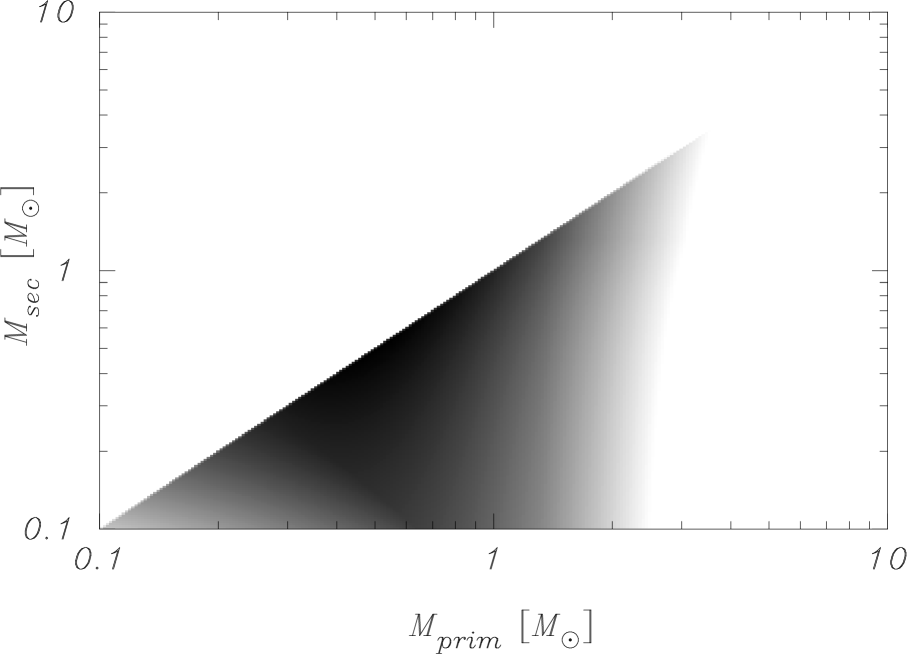
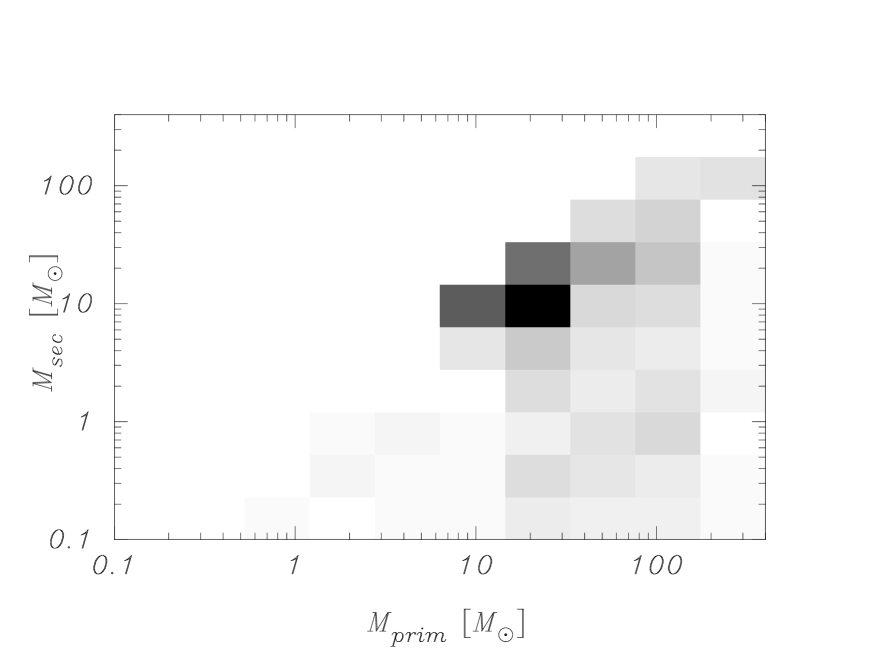
Fig. 3 gives the probability distribution for the stars that did experience a collision in our model calculations. The data are taken from a rather inhomogeneous sample of calculations (see Tab. 2).
The most striking difference between Fig. 2 and Fig. 3 is the mean mass of the colliding stars. Where Fig. 2 only extends to 10 stars and gives a highest probability for a collision between 0.7 stars, Fig. 3 shows that much higher mass stars are much more likely to experience collisions. The mean mass of the colliding stars according to the model calculations exceeds 10 . The reasons for these discrepancies hide in the effect of mass segregation and the formation of binaries in the core of the stellar system (see Portegies Zwart et al. 1999 for details).
3.3. Runaway growth
The mean mass of a collision counterpart is about 10 and many collisions involve the same star, the growth rate of this star is about 10 per collision. Once the collision runaway explodes in a supernova or is ejected from the stellar system its growth stops and another star takes its place until the cluster dissolves in the tidal field of the Galaxy. (The models which were calculated without an external potential were stopped well before the cluster dissolved.)
Fig. 4 presents the evolution tree for the collision sequence for two of the models. In this (an all other) cases a single object keeps colliding with other stars at a high rate. Only a few collisions occur between stars which do not finally coalesce with this collisions runaway. Only after the previous collision runaway is ejected from the cluster, another can take its place (see left panel in fig. 4).


4. Discussion
In star clusters with a relaxation time smaller than a few 10 Myr collisions are quite common. The majority of collisions involve one selected object; the runaway merger. This seed object involves generally one of the initially most massive stars in the initial star cluster. If the cluster is embedded in the tidal field of the Galaxy, this selected star may eventually escape as a main sequence star or as the leftover from a supernova (a neutron star or black hole). Once the runaway merger has escaped another star will take its place until the cluster dissolves in the tidal field of the Galaxy. In an isolated cluster (or if the tidal fields on the cluster are small) it is harder to get rid of the collision runaway and in these cases the runaway merger may continue to grow in mass (see right panel in Fig. 4).
Most of our calculations, however, were computed with rather strong tidal forces, and these models dissolve within a few initial half mass relaxation times.
4.1. Observable characteristics of a collision runaway
4.2. Super blue stragglers
The stars which have experienced several collision may be brighter and bluer than any other star in the cluster, though detailed characteristics are hard to sketch. A few trivial characteristics may be those of a blue straggler much more than twice the mass of the clusters’ turn off (Sills & Lombardi 1997). For compact young star cluster such a characteristic, however, is not very useful as the turn off is ill defined for these systems.
The three most massive stars in R 136 have spectral type WN4.5 and appear to be younger than the other stars. Their age is estimated to be about 1 Myr (Massey & Hunter 1998; de Koter et al. 1997). These stars show violet absorption edges, which are common for late type (WN8 and later) stars but highly unusual for these early types (Conti et al. 1983). Also striking is that these stars are unusually hydrogen rich (Massey & Hunter 1998). They are about an order of magnitude brighter than normal for such stars. Estimates for their masses range from 112 to 155 (Chlebowski & Garmany 1991; Vacca et al. 1996). Two of them lie well inside the core of the cluster; the third is at a projected distance of about 0.6 pc from the core.
Also the Quintuple cluster contains a very over-massive star, the Pistol star, with and estimated mass of about 150 (Lang et al. 1999). Also this star appears to be rather odd and somewhat younger than the rest of the cluster stars.
We aregue that both stars may be the result of (multiple) collisions, causing a supermassive star which is slightly younger due to the rejuvenation in the collision process.
4.3. Super novae
Mass segregation causes massive cluster members to be preferentially in the cluster center. This causes them to be excellent candidates for subsequent collisions. In our calculations the mean mass of a collision member is 10 . Stars with masses are expected to end their fuel burning life in a supernova, leaving a neutron star or a black hole. Collisions tend to reduce the number of type Ib/c and type II supernovae. Stars which normally would explode in a supernova (zero age mass ) are likely collision counterparts. A collision between two of such stars reduces therefore the number of supernova.
4.4. Hypernovae?
In compact young star clusters the mean accumulating mass (mean addition in mass per collision) is about 10 (see Fig. 3). After collisions the initially most massive star (of 60 to 100 ) in the stellar system (the most likely collision runaway) has gained 10 resulting in a total mass of . Each collision may have rejuvenated the collision runaway somewhat, but eventually its core will grow until it exceeds a Chandrasekhar mass in iron, causing the star to explode in a supernova. The star itself is likely to be rapidly rotation, possibly close to break-up (Sills & Lombardi 1997). The enormous mass of the exploding star together with its high rotation rate may cause it to explode quite differently than stars in isolation. Nakamura et al. (2000) argues that stars with an extremely high mass which are rotating very rapidly may be excellent candidates for Hypernovae, possibly even causing gamma-ray bursts.
4.5. The formation of massive black holes
As long as the collision runaway remains on the main sequence or one of the giant branches its cross section for further collisions remains large, due to the large size of the star. As soon as it explodes in a supernova things become somewhat uncertain as we do not understand the supernova mechanism very well. It is generally accepted that such massive stars form black holes but how much mass is lost from the collapsing star is uncertain. If the star loses a lot of mass in the supernova it may eject itself from the cluster, because the star was most likely to be a member of a close binary, which receives a high runaway velocity upon the supernova explosion (see Blaauw 1961; van den Heuvel et al. 2000; Portegies Zwart 2000). When little or no mass is lost in the supernova event the black hole remains in the cluster and may continue to grow in mass via subsequent collisions with other stars. Even though the size of the black hole has decreased dramatically it will still dominate the collision rate as its cross section is dominated by gravitational focusing.
If we allowed little mass loss upon the supernova the formed black hole continues to grow in mass at about the same rate as before the supernova, indicating that the collision cross section is dominated by gravitational focusing. Take into account that if no mass is lost upon the supernova the black hole remains deep in the cluster core, where the collision are occurring.
When more and more stars end their lifetime in a supernova the cluster will lose more mass. This results in a local expansion of the cluster core, finally terminating the collision efficiency. We therefore do not expect that collisions remain dominating the cluster evolution for more than a few 10 Myr. In older clusters binaries consisting of previously formed black holes start to heat the cluster (see Portegies Zwart & McMillan 2000). This will all finally result in a termination of the collision rate and causes the cluster to expand. Whether the cluster finally dissolves or remains bound to experience another phase of core collapse depends on details concerning the initial conditions of the star cluster. The further evolution of the cluster and its central massive black hole is a complicated matter and requires more study. We are quite happy that this matter is beyond the scope of this paper.
4.6. The effect of primordial binaries
All our calculations started without primordial binaries, which, of course, is an ill assumption. These clusters most likely contain a rich population of binaries, which have been formed together with the other stars in the cluster. For studying the collisional growth of a central object primordial binaries might not be very important. Of course, the total mass in a binary is –on average– 1.5 times higher than the mean mass if single stars, but it will only make the increase in mass of the runaway merger larger and the absence of primordial binaries therefore reduces the effect of runaway growth. On the other hand, primordial binaries may heat the core at such a rate that collision are prevented altogether. This is very unlikely, as by the time binaries become hard enough to heat the cluster they are extremely vulnerable to collisions. Also, our runaway merger was generally a binary member, simply due to binary formation in the usual 3-body processes. We therefore expect the a rich population of primordial binaries does not lower the observed collision rate in our models. Detailed calculations in which we take a rich population of primordial binaries into account are in progress.
5. Conclusions
We performed a large number of -body simulations which include the effects of stellar evolution, binary evolution and the tidal field of the Galaxy. The initial conditions are selected to represent the young and compact stars clusters such as Arches and the Quintuplet systems.
Our model clusters are highly collisional, in the sense that collisions occur at a very high rate, much higher than expected from simple cross section arguments. The stars which are participating in collisions are generally much more massive than the mean mass in the cluster. Generally one of the most massive stars in the cluster experiences multiple collisions until it either explodes in a supernova or is ejected from the cluster by a dynamical encounter. The collision rate per star per million years in our models scales very nicely with the initial relaxation time of the models, via:
| (8) |
Here is the clusters’ initial relaxation time in million years.
Acknowledgments.
SPZ is grateful to the Institute for Advanced Study, Drexel University and Tokyo University for their hospitality and the use of their GRAPE-4 hardware. This work was supported by NASA through Hubble Fellowship grant HF-01112.01-98A awarded by the Space Telescope Science Institute, which is operated by the Association of Universities for Research in Astronomy, by the Research for the Future Program of Japan Society for the Promotion of Science (JSPS-RFTP97P01102) and by NASA ATP grants NAG5-6964 and NAG5-9264.
References
- \astronciteBlaauw1961 Blaauw, A. 1961, ban, 15, 265
- \astronciteBrandl et al.1996 Brandl, B., Sams, B. J., Bertoldi, F., Eckart, A., Genzel, R., Drapatz, S., Hofmann, R., Loewe, M., Quirrenbach, A. 1996, ApJ, 466, 254
- \astronciteCampbell et al.1992 Campbell, B., Hunter, D. A., Holtzman, J. A., Lauer, T. R., Shayer, E. J., Code, A., Faber, S. M., Groth, E. J., Light, R. M., Lynds, R., O’Neil, E. J., J., Westphal, J. A. 1992, AJ, 104, 1721
- \astronciteChlebowski & Garmany1991 Chlebowski, T., Garmany, C. D. 1991, ApJ, 368, 241
- \astronciteConti et al.1983 Conti, P. S., Leep, M. E., Perry, D. N. 1983, ApJ, 268, 228
- \astroncitede Koter et al.1997 de Koter, A., Heap, S. R., Hubeny, I. 1997, ApJ, 477, 792
- \astronciteFiger et al.1999a Figer, D. F., Kim, S. S., Morris, M., Serabyn, E., Rich, R. M., McLean, I. S. 1999a, ApJ, 525, 750
- \astronciteFiger et al.1999b Figer, D. F., McLean, I. S., Morris, M. 1999b, ApJ, 514, 202
- \astronciteGiersz & Heggie1994 Giersz, M., Heggie, D. C. 1994, MNRAS, 268, 257
- \astronciteGiersz & Heggie1996 Giersz, M., Heggie, D. C. 1996, MNRAS, 279, 1037
- \astronciteGlass et al.1987 Glass, I. S., Catchpole, R. M., Whitelock, P. A. 1987, MNRAS, 227, 373
- \astronciteHeggie & Mathieu1986 Heggie, D. C., Mathieu, R. 1986, MNRAS, in P. Hut, S. McMillan (eds.), Lecture Not. Phys 267, Springer-Verlag, Berlin
- \astronciteHeggie & Ramamani1995 Heggie, D. C., Ramamani, N. 1995, MNRAS, 272, 317
- \astronciteHills1975 Hills, J. G. 1975, AJ, 80, 809
- \astronciteLang et al.1999 Lang, C. C., Figer, D. F., Goss, W. M., Morris, M. 1999, AJ, 118, 2327
- \astronciteLeonard1989 Leonard, P. J. T. 1989, AJ, 98, 217
- \astronciteLightman & Shapiro1977 Lightman, A. P., Shapiro, S. L. 1977, ApJ, 211, 244
- \astronciteMakino et al.1997 Makino, J., Taiji, M., Ebisuzaki, T., Sugimoto, D. 1997, ApJ, 480, 432
- \astronciteMassey & Hunter1998 Massey, P., Hunter, D. A. 1998, ApJ, 493, 180
- \astronciteNakamura et al.2000 Nakamura, T., Umeda, H., Iwamoto, K., Nomoto, K., Hashimoto, M., Hix, W. R., Thielemann, F. 2000, in Submitted to the Astrophysical Journal (August 11, 2000)., 11184
- \astroncitePortegies Zwart et al.2000a Portegies Zwart, S., Makino, J., McMillan, S., Hut, P. 2000a, ApJ Letters in press. (astro-ph/0008490)
- \astroncitePortegies Zwart et al.2000b Portegies Zwart, S., McMillan, S., Hut, P., Makino, J. 2000b, MNRAS in press., (astro-ph/0005248)
- \astroncitePortegies Zwart2000 Portegies Zwart, S. F. 2000, ApJ in press., (astro-ph/0005202)
- \astroncitePortegies Zwart et al.1999 Portegies Zwart, S. F., Makino, J., McMillan, S. L. W., Hut, P. 1999, A&A, 348, 117
- \astroncitePortegies Zwart & McMillan2000 Portegies Zwart, S. F., McMillan, S. L. W. 2000, ApJ, 528, L17
- \astronciteScalo1986 Scalo, J. M. 1986, Fund. of Cosm. Phys., 11, 1
- \astronciteSills & Lombardi1997 Sills, A., Lombardi, J. C. 1997, ApJ, 484, L51
- \astronciteVacca et al.1996 Vacca, W. D., Garmany, C. D., Shull, J. M. 1996, ApJ, 460, 914
- \astroncitevan Den Heuvel et al.2000 van Den Heuvel, E., Portegies Zwart, S. F., Batacharya, D., Kaper, L. 2000, A&A in press (astro-ph/0005245)